The ATT&CK chart is a heatmap describing the attacks carried out on a system in the form of attack tactics, techniques, and sub-techniques described by MITRE. You can select the ATT&CK chart from the search page only if you provide attack_id as a grouping parameter.
To populate the ATT&CK chart, LogPoint adds the following fields to the corresponding logs each time an alert is triggered:
attack_id: An ID for the attack.
attack_category: The type of attack tactic used.
attack_tag: The type of attack technique used.
The header row of the ATT&CK chart contains the tactics that may be used to perform an attack. The body of the chart displays the techniques used to execute the corresponding tactics.
The ATT&CK chart also displays a drop-down icon on some cells. You can select the icon to see the sub-techniques involved in the relevant attack technique.
Note
The color intensity for each cell is based on the frequency of the corresponding technique and sub-technique.
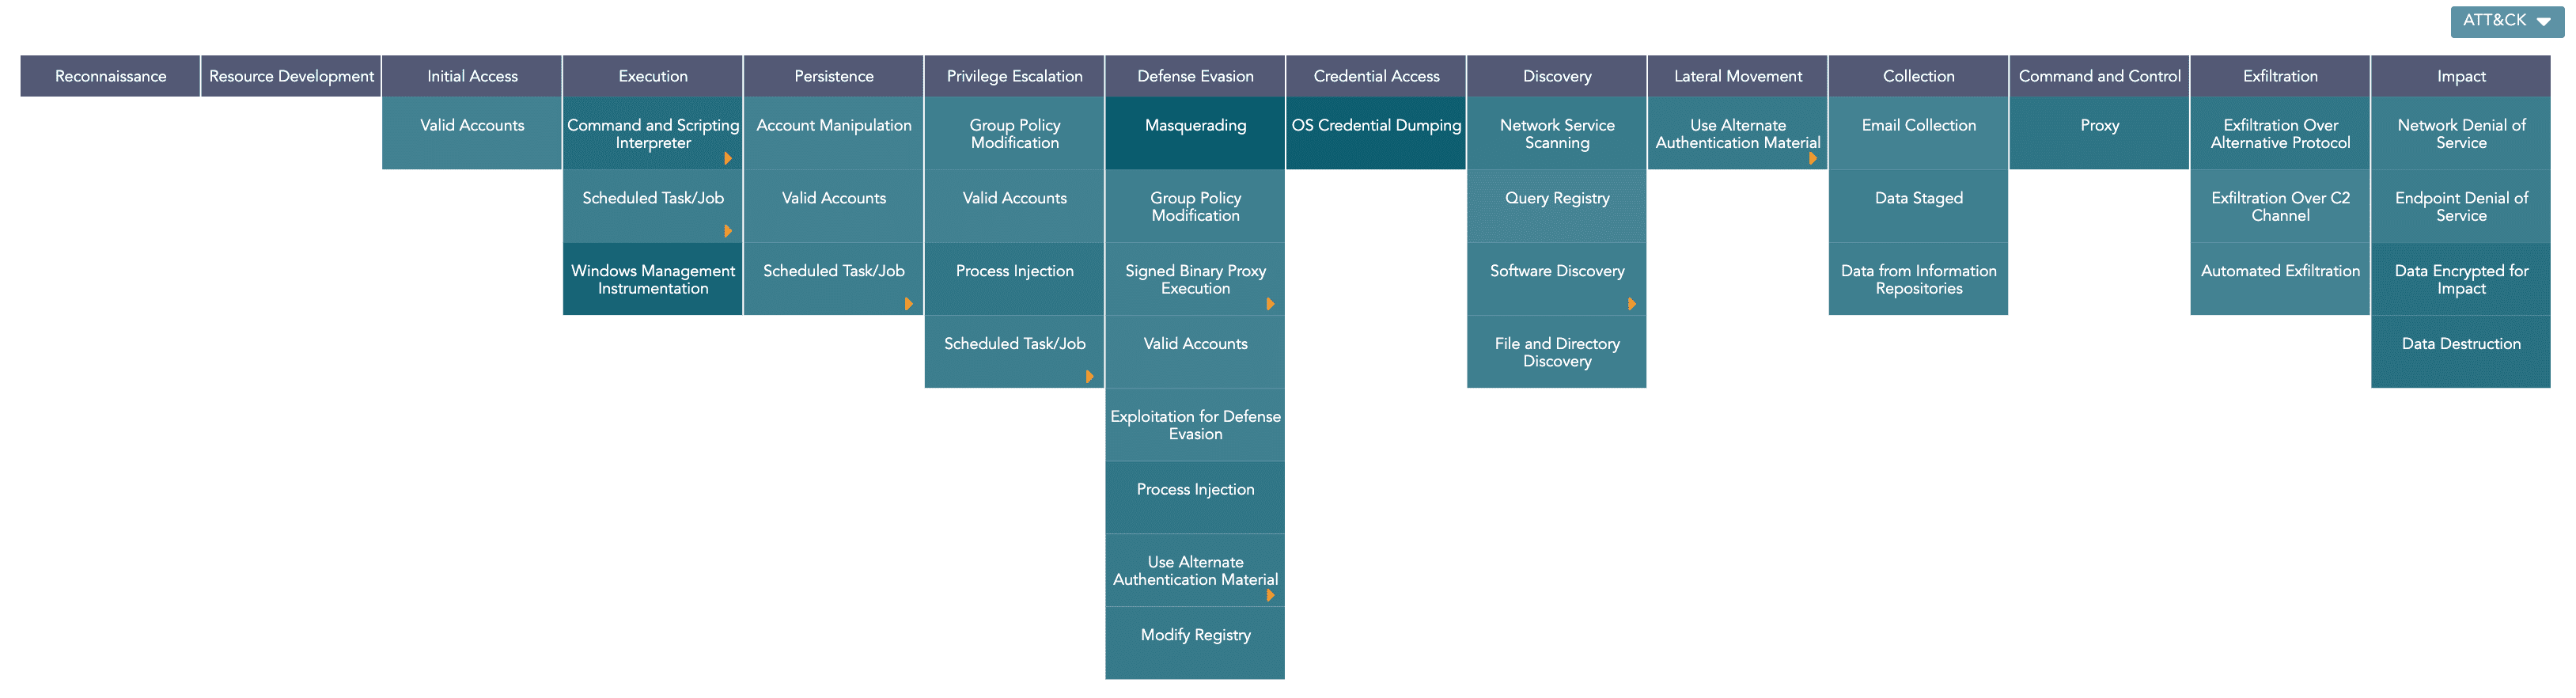
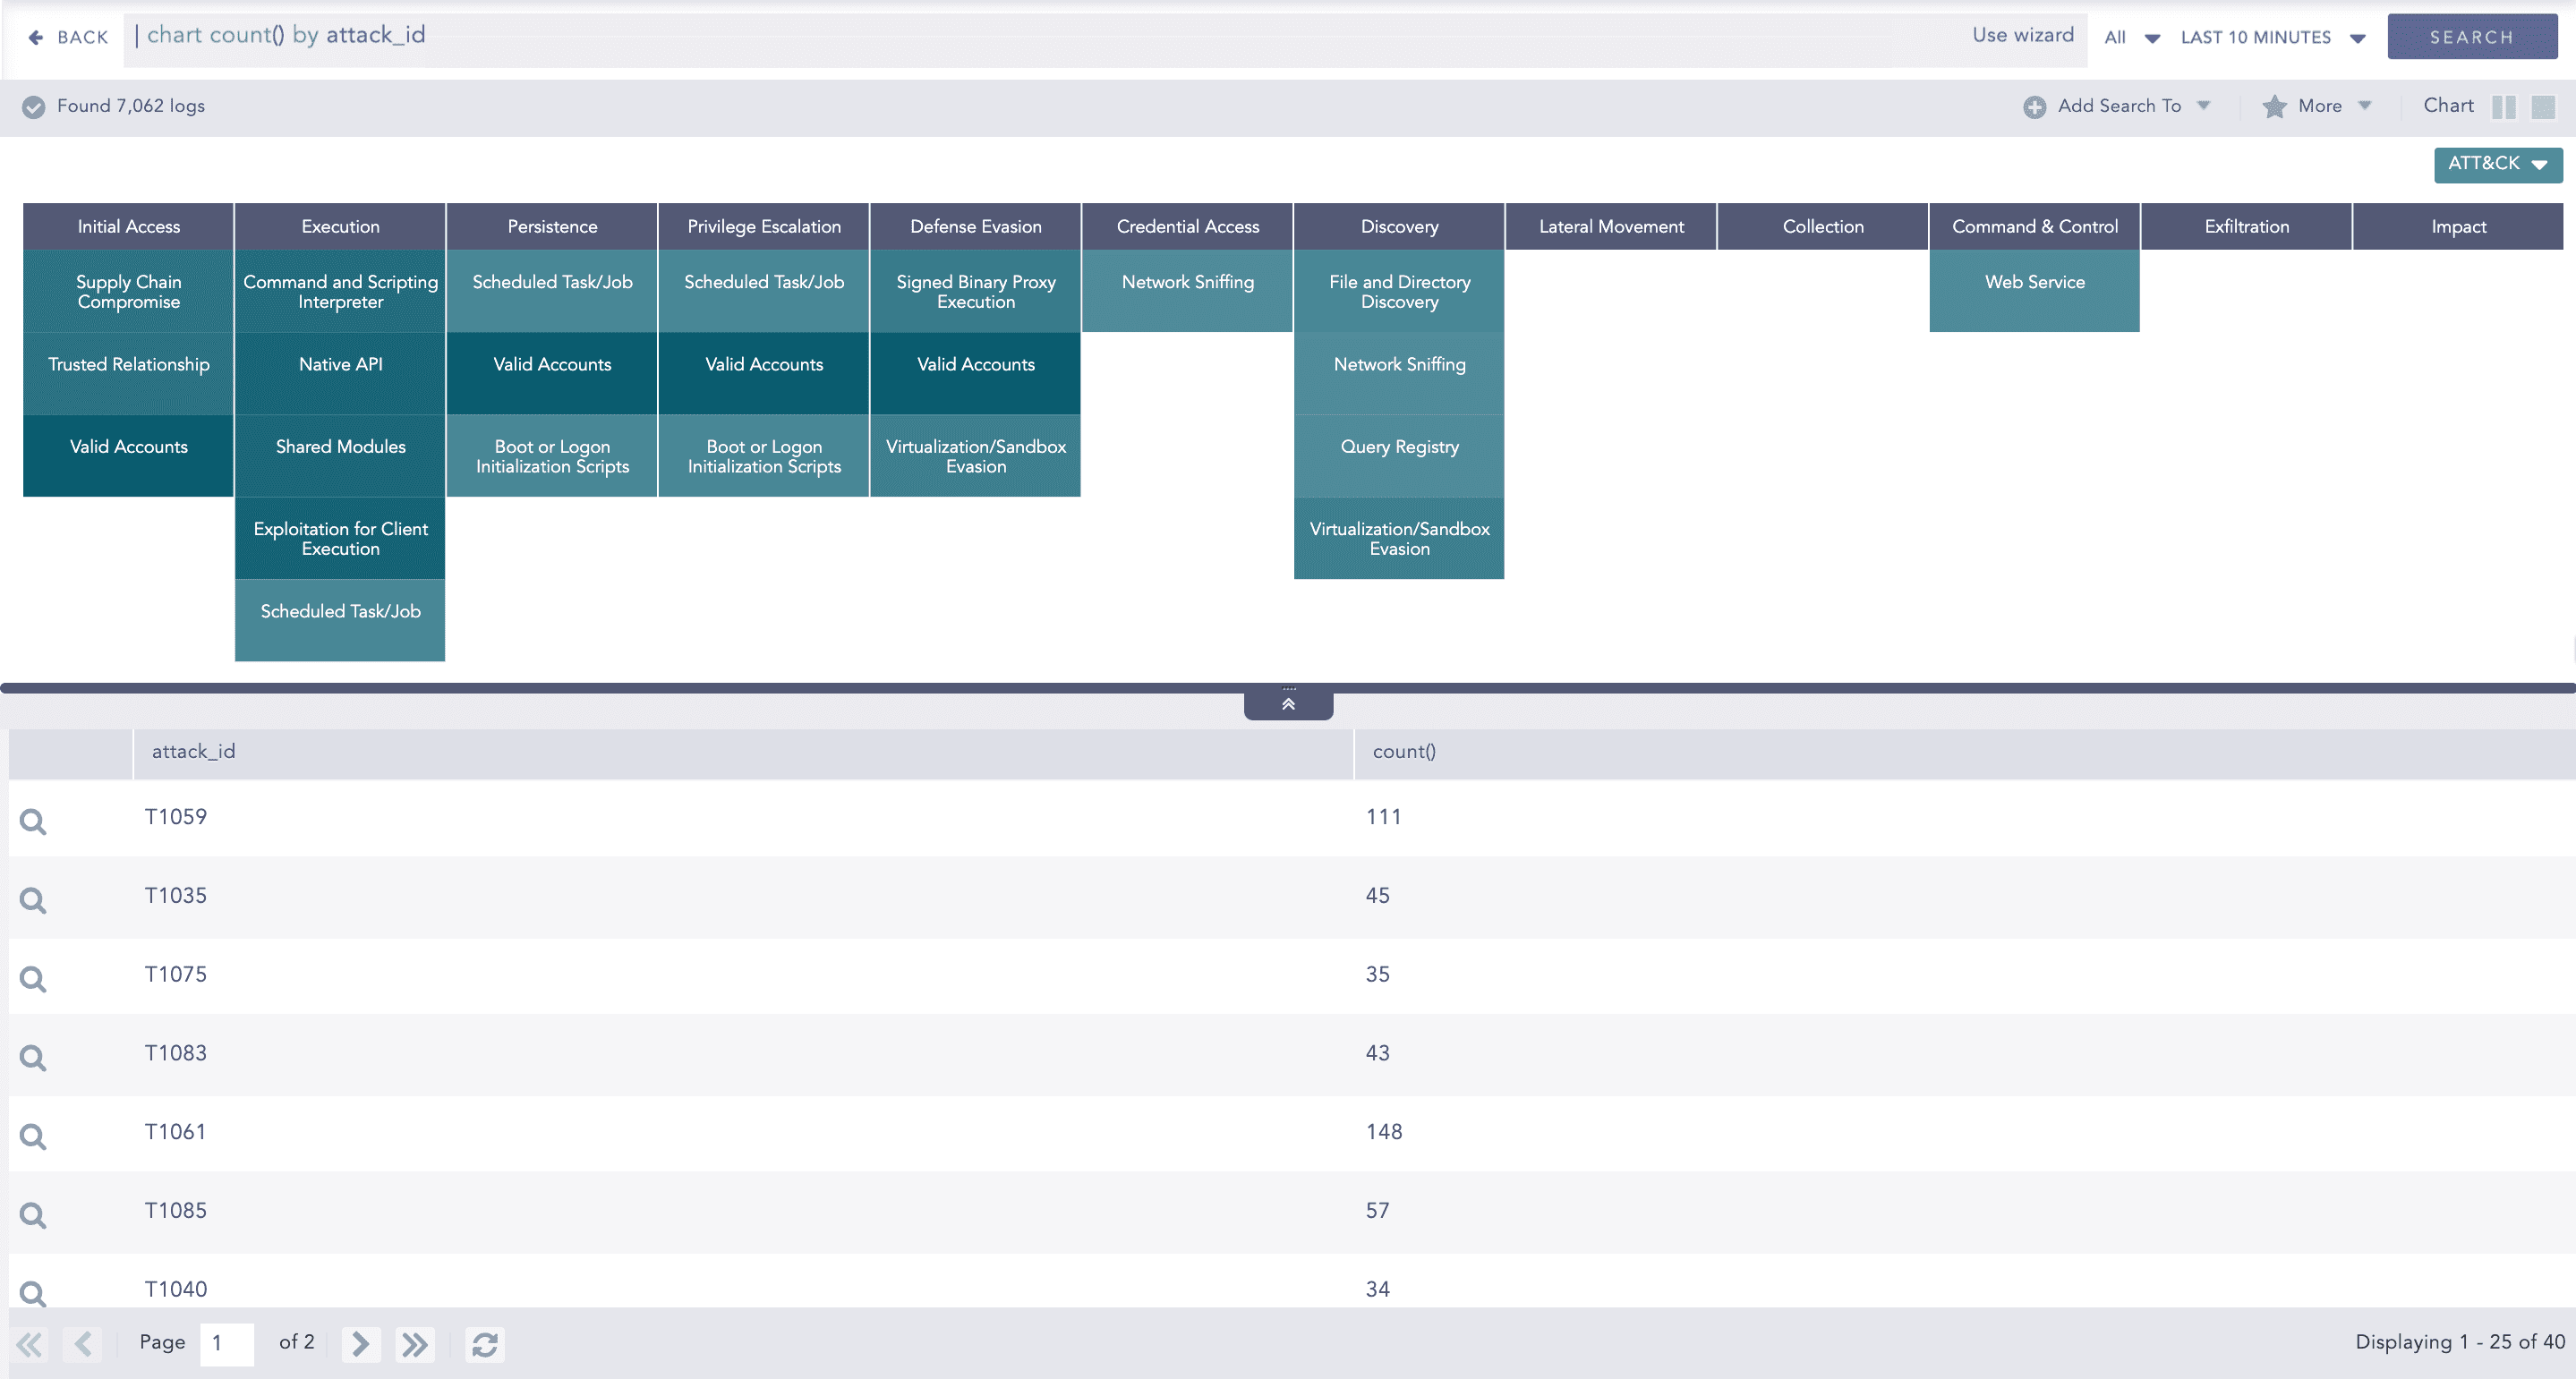
ATT&CK chart
The following query gives the output shown above.
| chart count() by attack_id
Note
You can drill down on the ATT&CK chart by clicking on each tactic on the header row and each technique and sub-technique cell on the heatmap.
LogPoint also provides the option to further analyze the ATT&CK chart based on multiple entities. You can do this by grouping the results using the required entity. LogPoint currently supports grouping by the following entities:
user
ip_address
workstation
| chart count() by attack_id, user
If you group the results by an entity, the ATT&CK chart provides the following additional features:
The Entity icon at the top-right corner of the visualization.
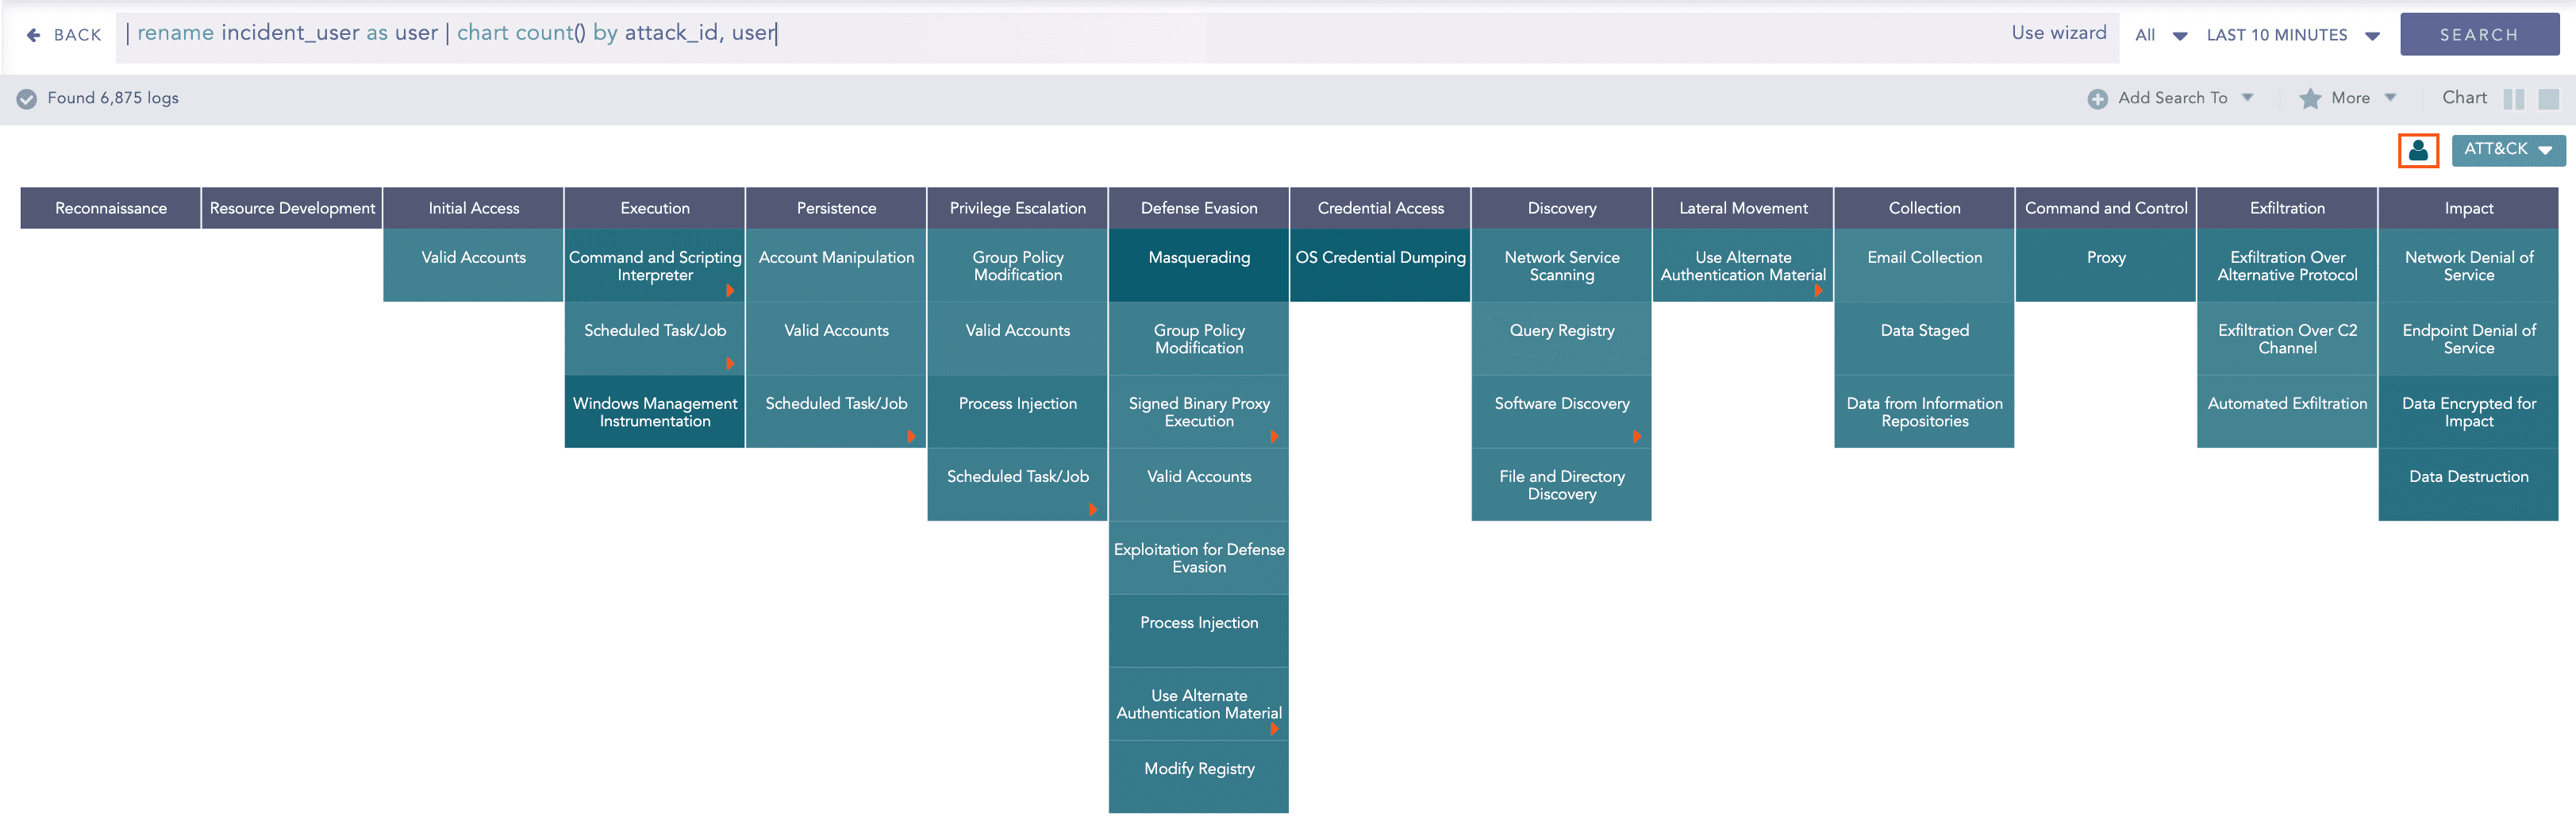
Entity icon in the ATT&CK chart
Clicking the icon displays a bar chart describing the contribution of each entity to the overall results. Here, the y-axis represents the entities and the x-axis represents the count of the entities in the overall results.
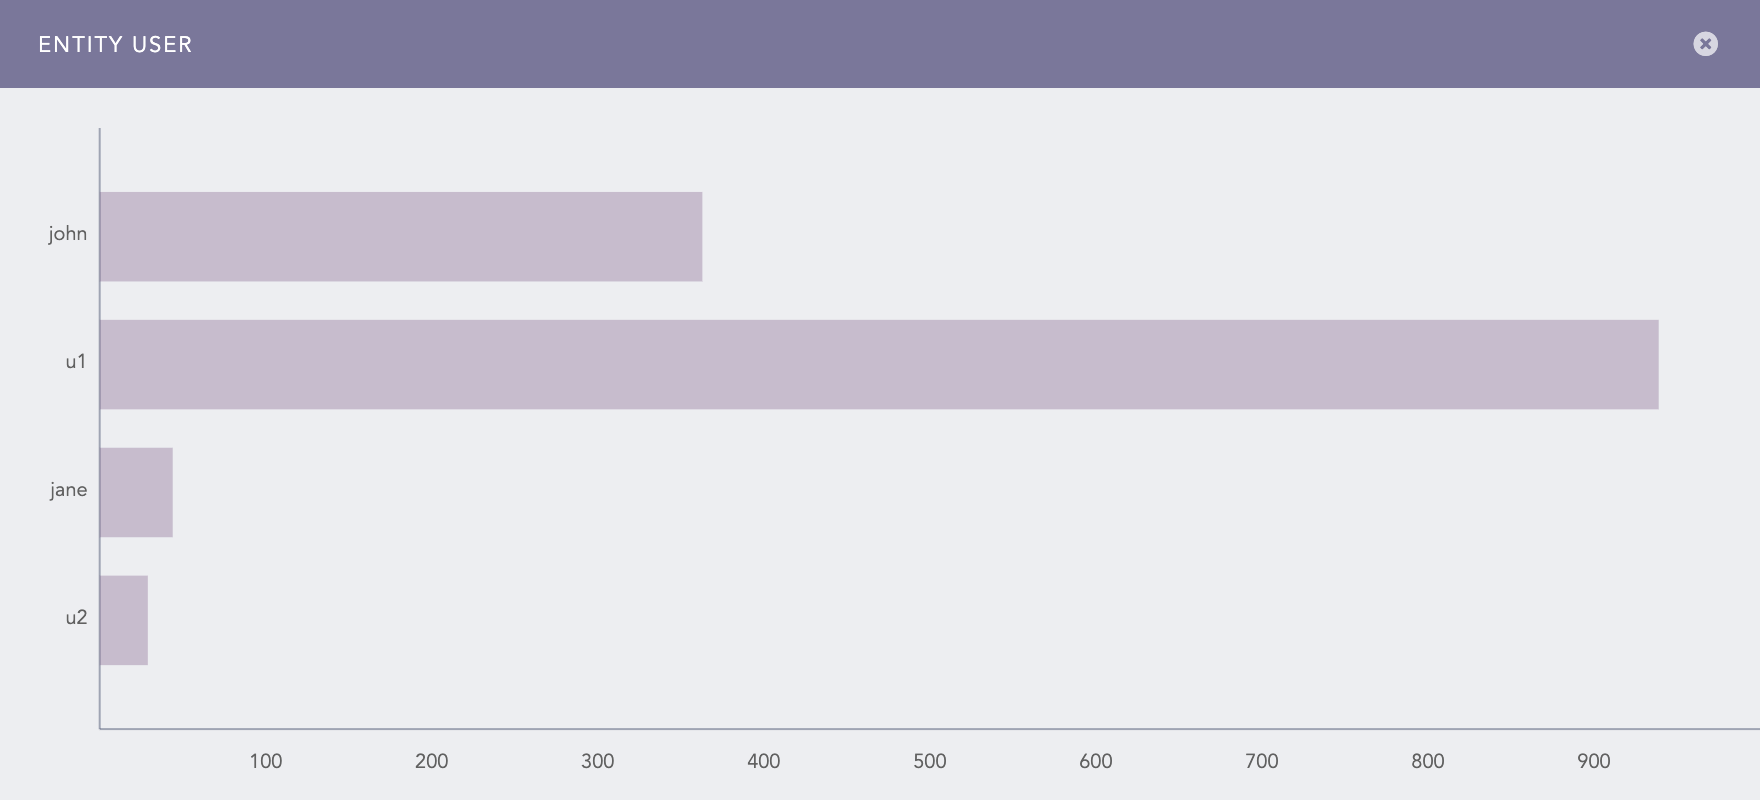
Contribution of user entities in the ATT&CK chart
The Info icon displayed while hovering on each cell of the ATT&CK chart.

Info icon in the ATT&CK chart
Clicking the icon displays a bar chart describing the contribution of the entities to the corresponding attack technique or sub-technique. Here, the x-axis represents the entities and the y-axis represents the count of the entities in the results for the selected technique or sub-technique.
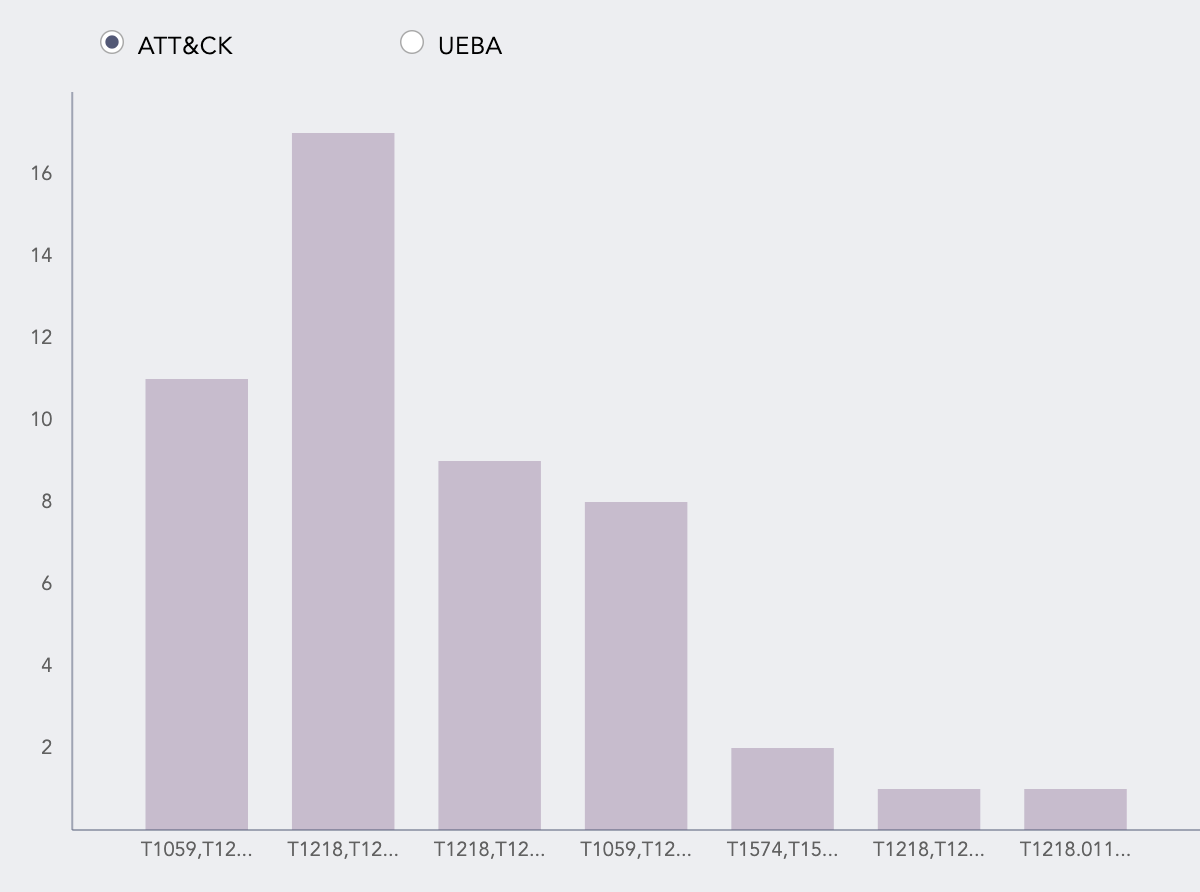
Contribution of user entities in the technique
Note
The bar chart shows the data for the selected technique or sub-technique under all the attack tactics. To display the data for only the selected tactic, you must group the results by attack_category as well.
If you have enabled LogPoint UEBA, you can also view the risk scores for the entities by clicking UEBA. This chart displays only the entities that have a risk score of more than one.
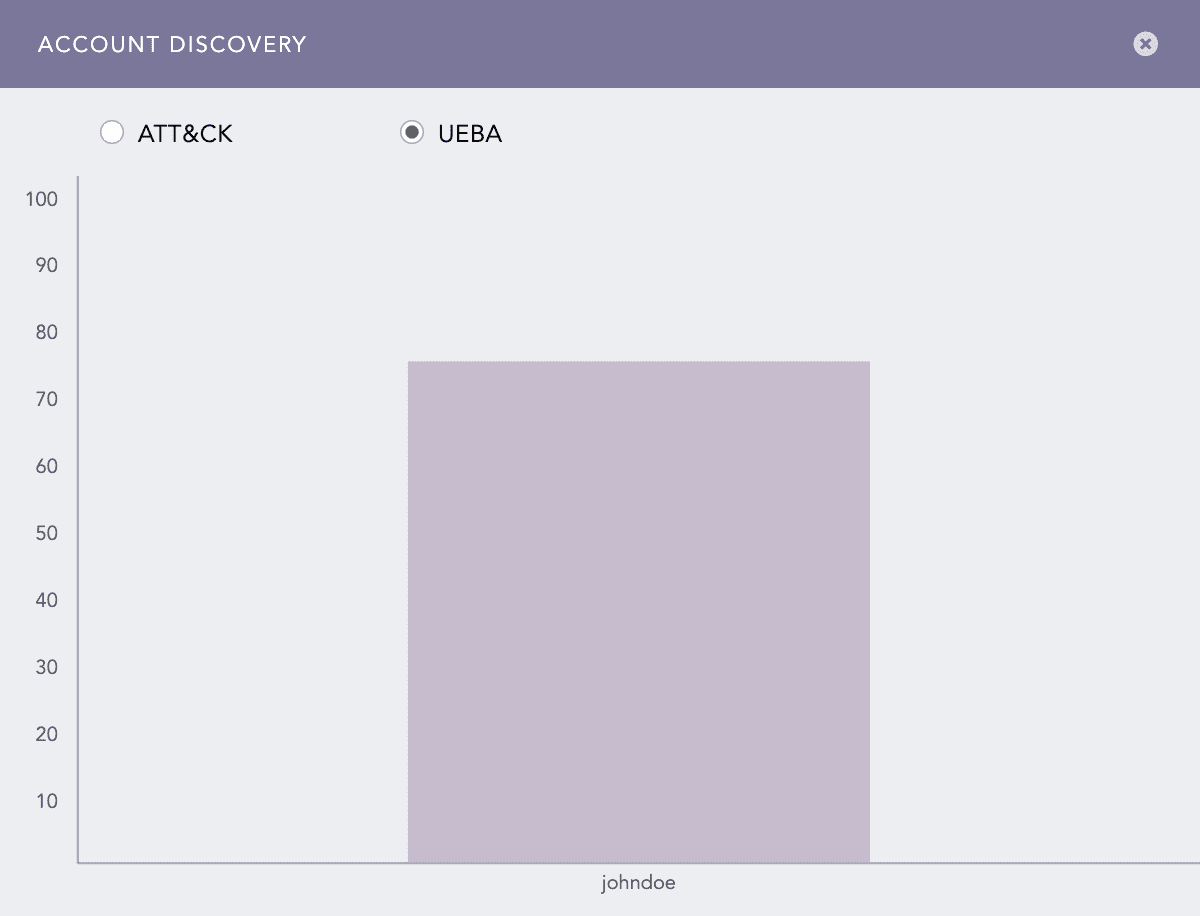
Entity risk scores
Note
The entity and info icons are displayed only if you group the results by user, ip_address, or workstation fields. Therefore, if you have a field named differently in the search results, make sure to rename the field to one of the required names using the rename command.
If you group the results by multiple valid entities, the results are grouped only by one of the provided entities. In this case, LogPoint prioritizes the entities in the following order:
user
ip_address
workstation
You can drill down on each entity’s results by clicking the corresponding column of the entity bar charts. Additionally, you can drill down onto the UEBA dashboard by clicking the risk score for each entity.
The entity icons are not displayed in the Search Templates and Dashboard.
The ATT&CK chart supports a single aggregation response type for the representation of search results in the visualization. It is:
Response Type |
General Syntax |
|---|---|
| chart aggregation_parameter by attack_id
|
Example:
| chart count() by attack_id
ATT&CK chart for Single Aggregation with Grouping
You can refer to Single Aggregation with Grouping for more details.