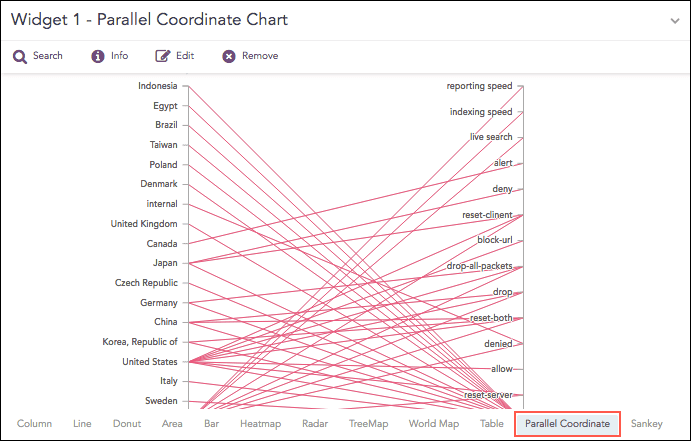
The Parallel Coordinate Chart is a visualization technique used to plot individual data elements across multiple dimensions. The charts are ideal for comparing many grouping parameters and analyzing the relationships between them. Each grouping parameter has its axis, and all the axes are placed in parallel to each other. Values are plotted as a series of lines that are connected across all the axes. This means that each line is a collection of points placed on each axis, which have all been linked together.
The Parallel Coordinate chart shows both the forest and the tree. You can see the big picture in the patterns of the lines. You can highlight the individual lines to see the performance of a specific value of parameters. It is useful in the situations when the behavior of particular parameters may not be of concern, but a combination of those parameters may emphasize an abnormal pattern or relationship.
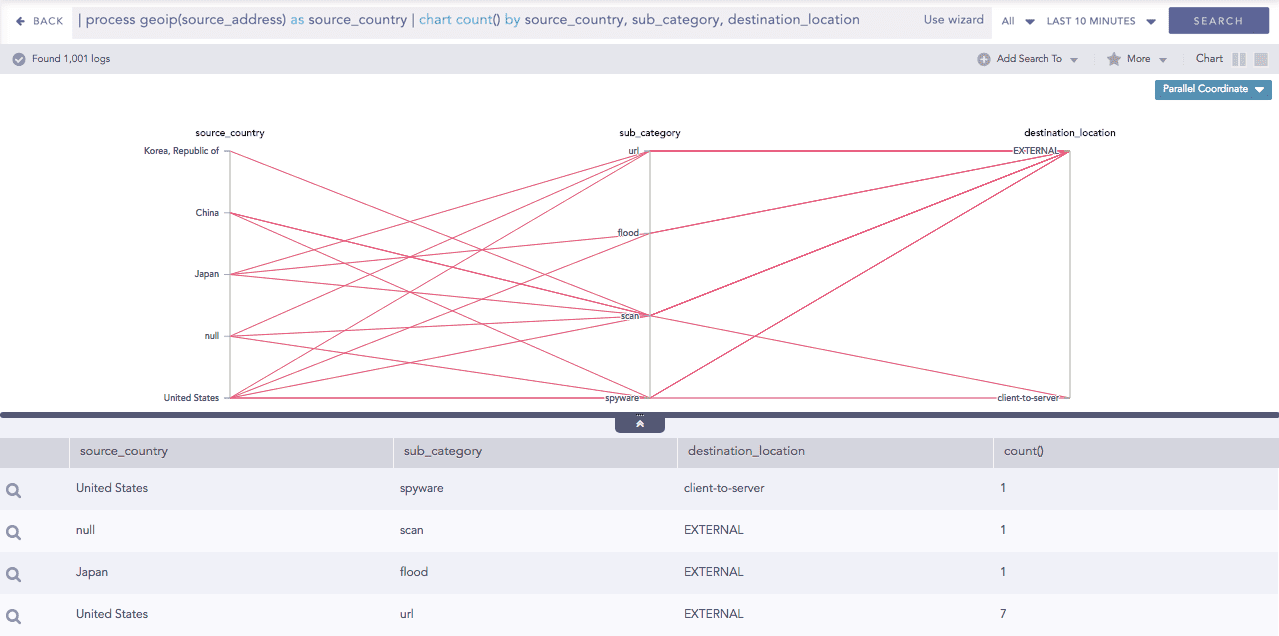
Parallel Coordinate chart
The following query gives the output shown above.
| process geoip(source_address) as source_country | chart count() by source_country, sub_category, destination_
location
Note
Each line represents a relationship between two parameters rather than a trend or change in value.
As the number of values increase, the graph may be cluttered or may even overlap at times, which makes it difficult to perceive. In such a case, use the Brushing feature to highlight an individual or a group of values for better understanding.
You can view the value of the aggregation parameter by hovering over a relationship line.
The Parallel Coordinate chart supports a single aggregation response types for representation of search results in the visualization. It is :
Response Type |
General Syntax |
|---|---|
| chart aggregation_parameter by grouping_parameter1, grouping_parameter2, ........, grouping_parametern
|
Example:
| process geoip(source_address) as source_country | chart count() by source_country, sub_category, destination_
location
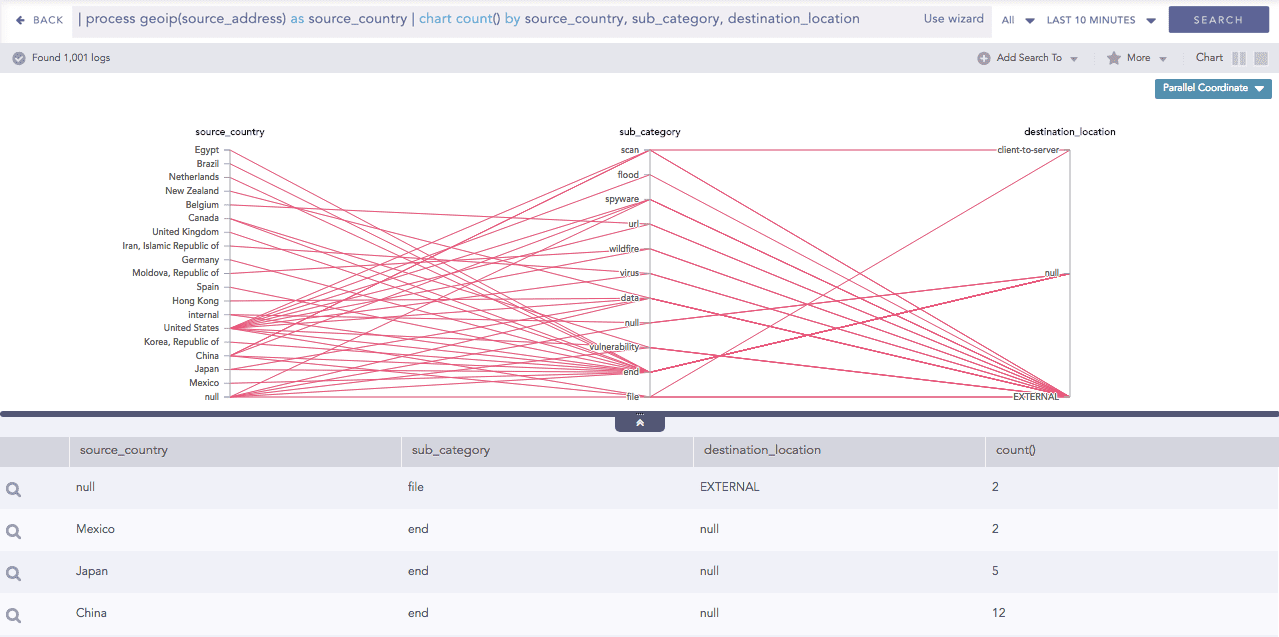
Parallel Coordinate chart for Single Aggregation with Grouping
Some notable points about the Parallel Coordinate chart are as follows:
Each line represents a relationship between two parameters rather than a trend or a change in value.
As the number of values increase, the graph may be cluttered or even overlapped at times, which makes it difficult to analyze. In this case, use the Brushing feature to highlight an individual or a group of values for better understanding.
You can view the value of the aggregation parameter by hovering over a relationship line.
You can refer to Single Aggregation with Grouping for more details.
The Brushing feature eliminates one of the primary drawbacks of the Parallel Coordinate chart, which is cluttering and overlapping of the graph. When the number of data items in a Parallel Coordinate chart gets very high, lines get cluttered and even overplotted which eventually becomes difficult to understand. Using the brushing feature, you can select an area containing one or many data points.
The line(s) under the brushed area is highlighted. You can view the details of the stressed relationship by hovering over the particular line. In addition to that, you can further drill-down to its details of the relationship by clicking it.
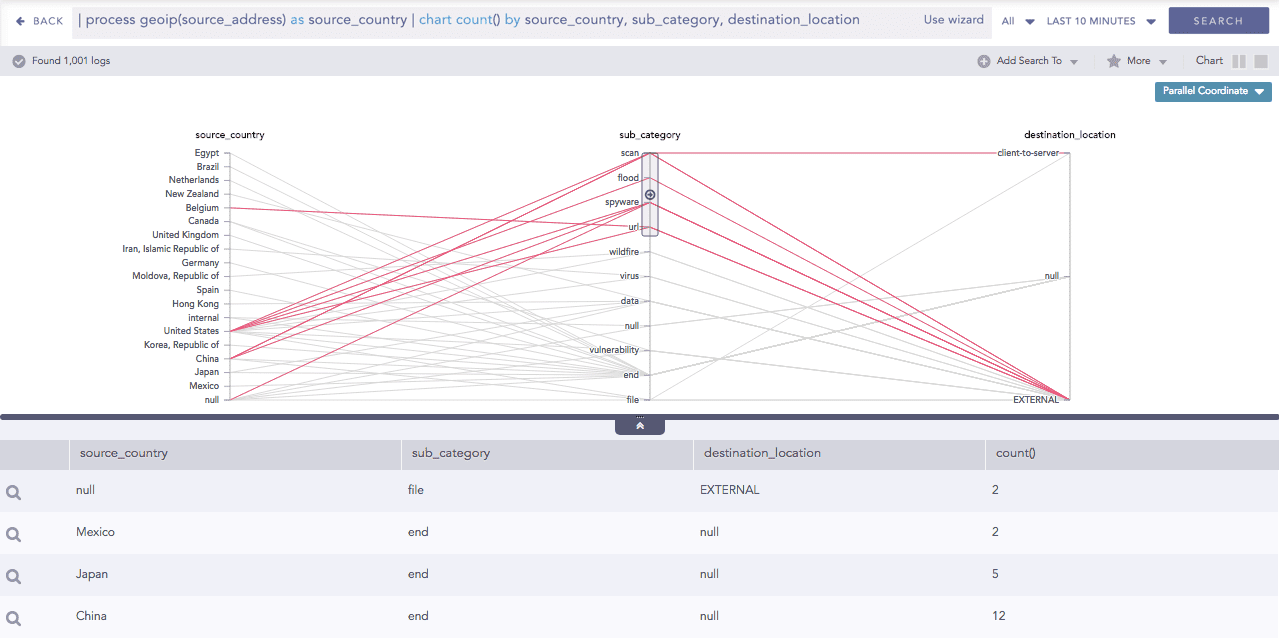
Brushing feature for Parallel Coordinate chart
In addition to the regular drill down operation, you can also perform a combined drill-down using the Brush. Select a range of values in multiple axes using a brush and click the brushed area, to drill down.
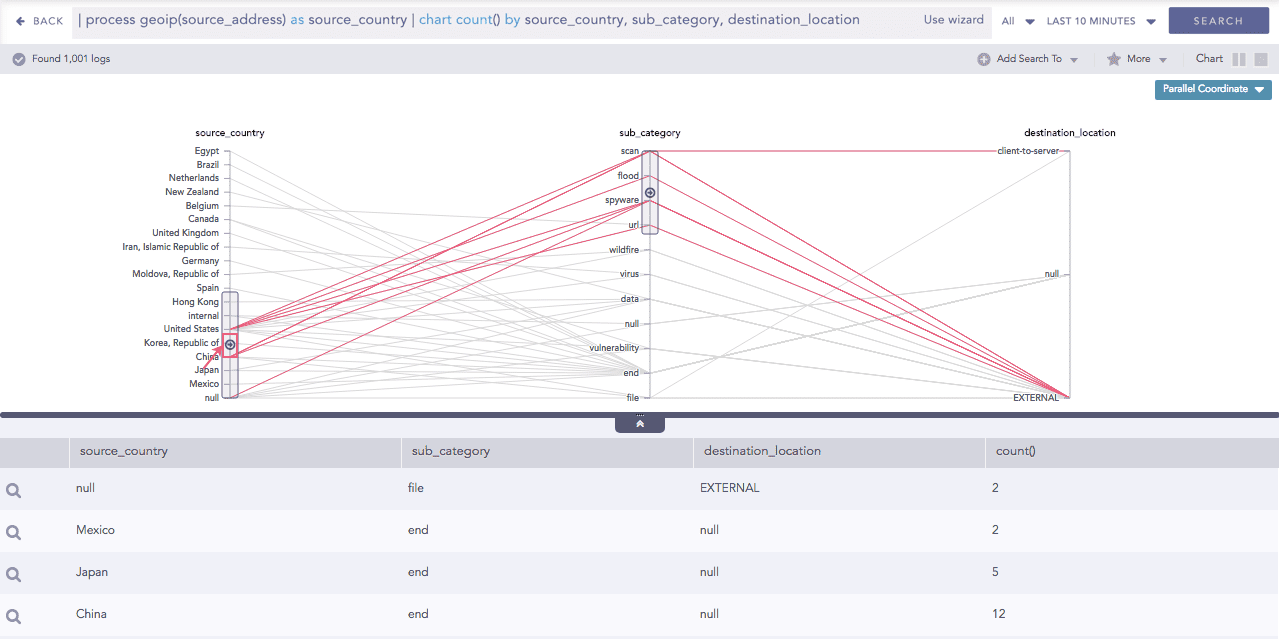
Drill-down using Brush
The results of the drill-down filters down to the combination of the selected grouping parameter values.
Drill-down results
By default, the first grouping parameter of the query is assigned to the first axis of the Parallel Coordinate chart, followed by the other grouping parameters.
For example, in the above query, the grouping parameter source_address, sub_category and destination_location are placed in first, second and third axes respectively.
You can also change the order of parameters by dragging them across the parameters with which the value is to be exchanged.
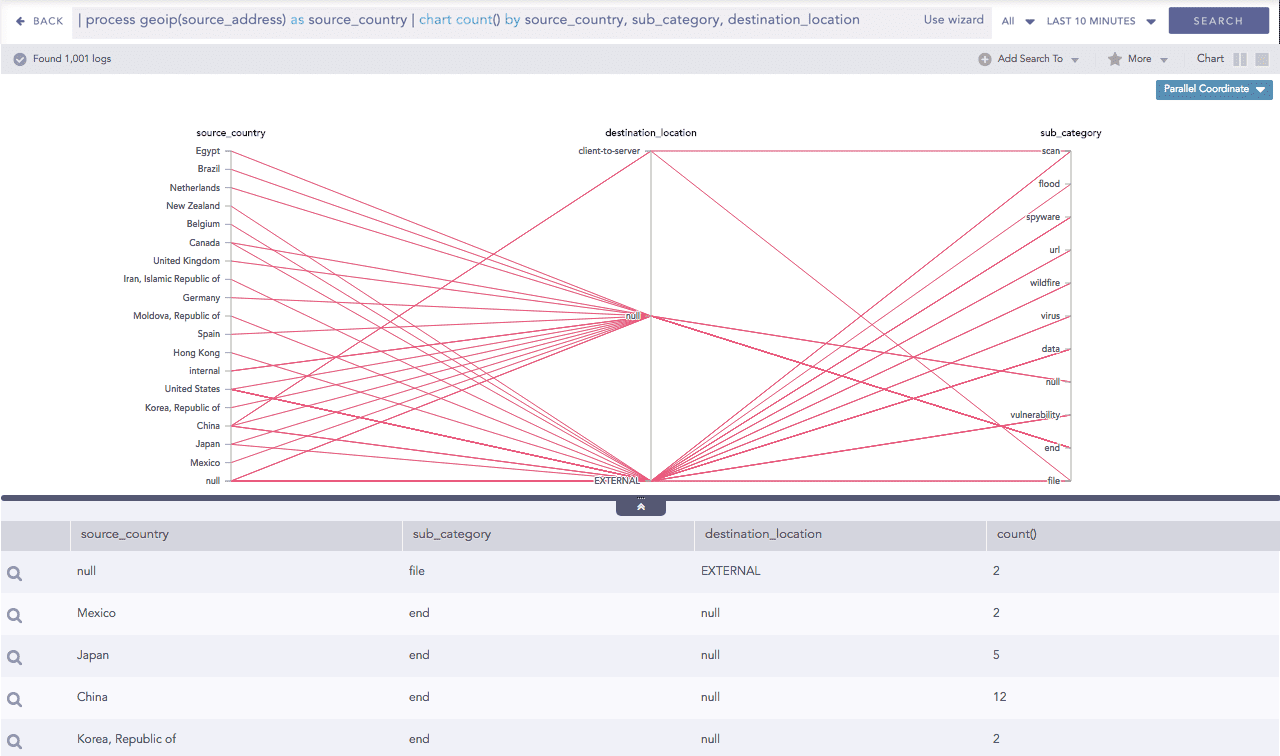
Change order of parameters.