Dashboard is data visualization updated in real-time. Logpoint comes with two main, pre-configured dashboards: All Dashboards and Overview.
All Dashboards allow you to create dynamic dashboards by adding multiple widgets. A widget can contain charts, tables, and graphs generated by a search query. A dashboard can also have diagrams, lists, and tables. If needed, you can change the widgets’ height, width, and positioning.
All Dashboards start with Quick Start, from which you can easily access most of the features of Logpoint. For more details, go to Introduction to All Dashboards.
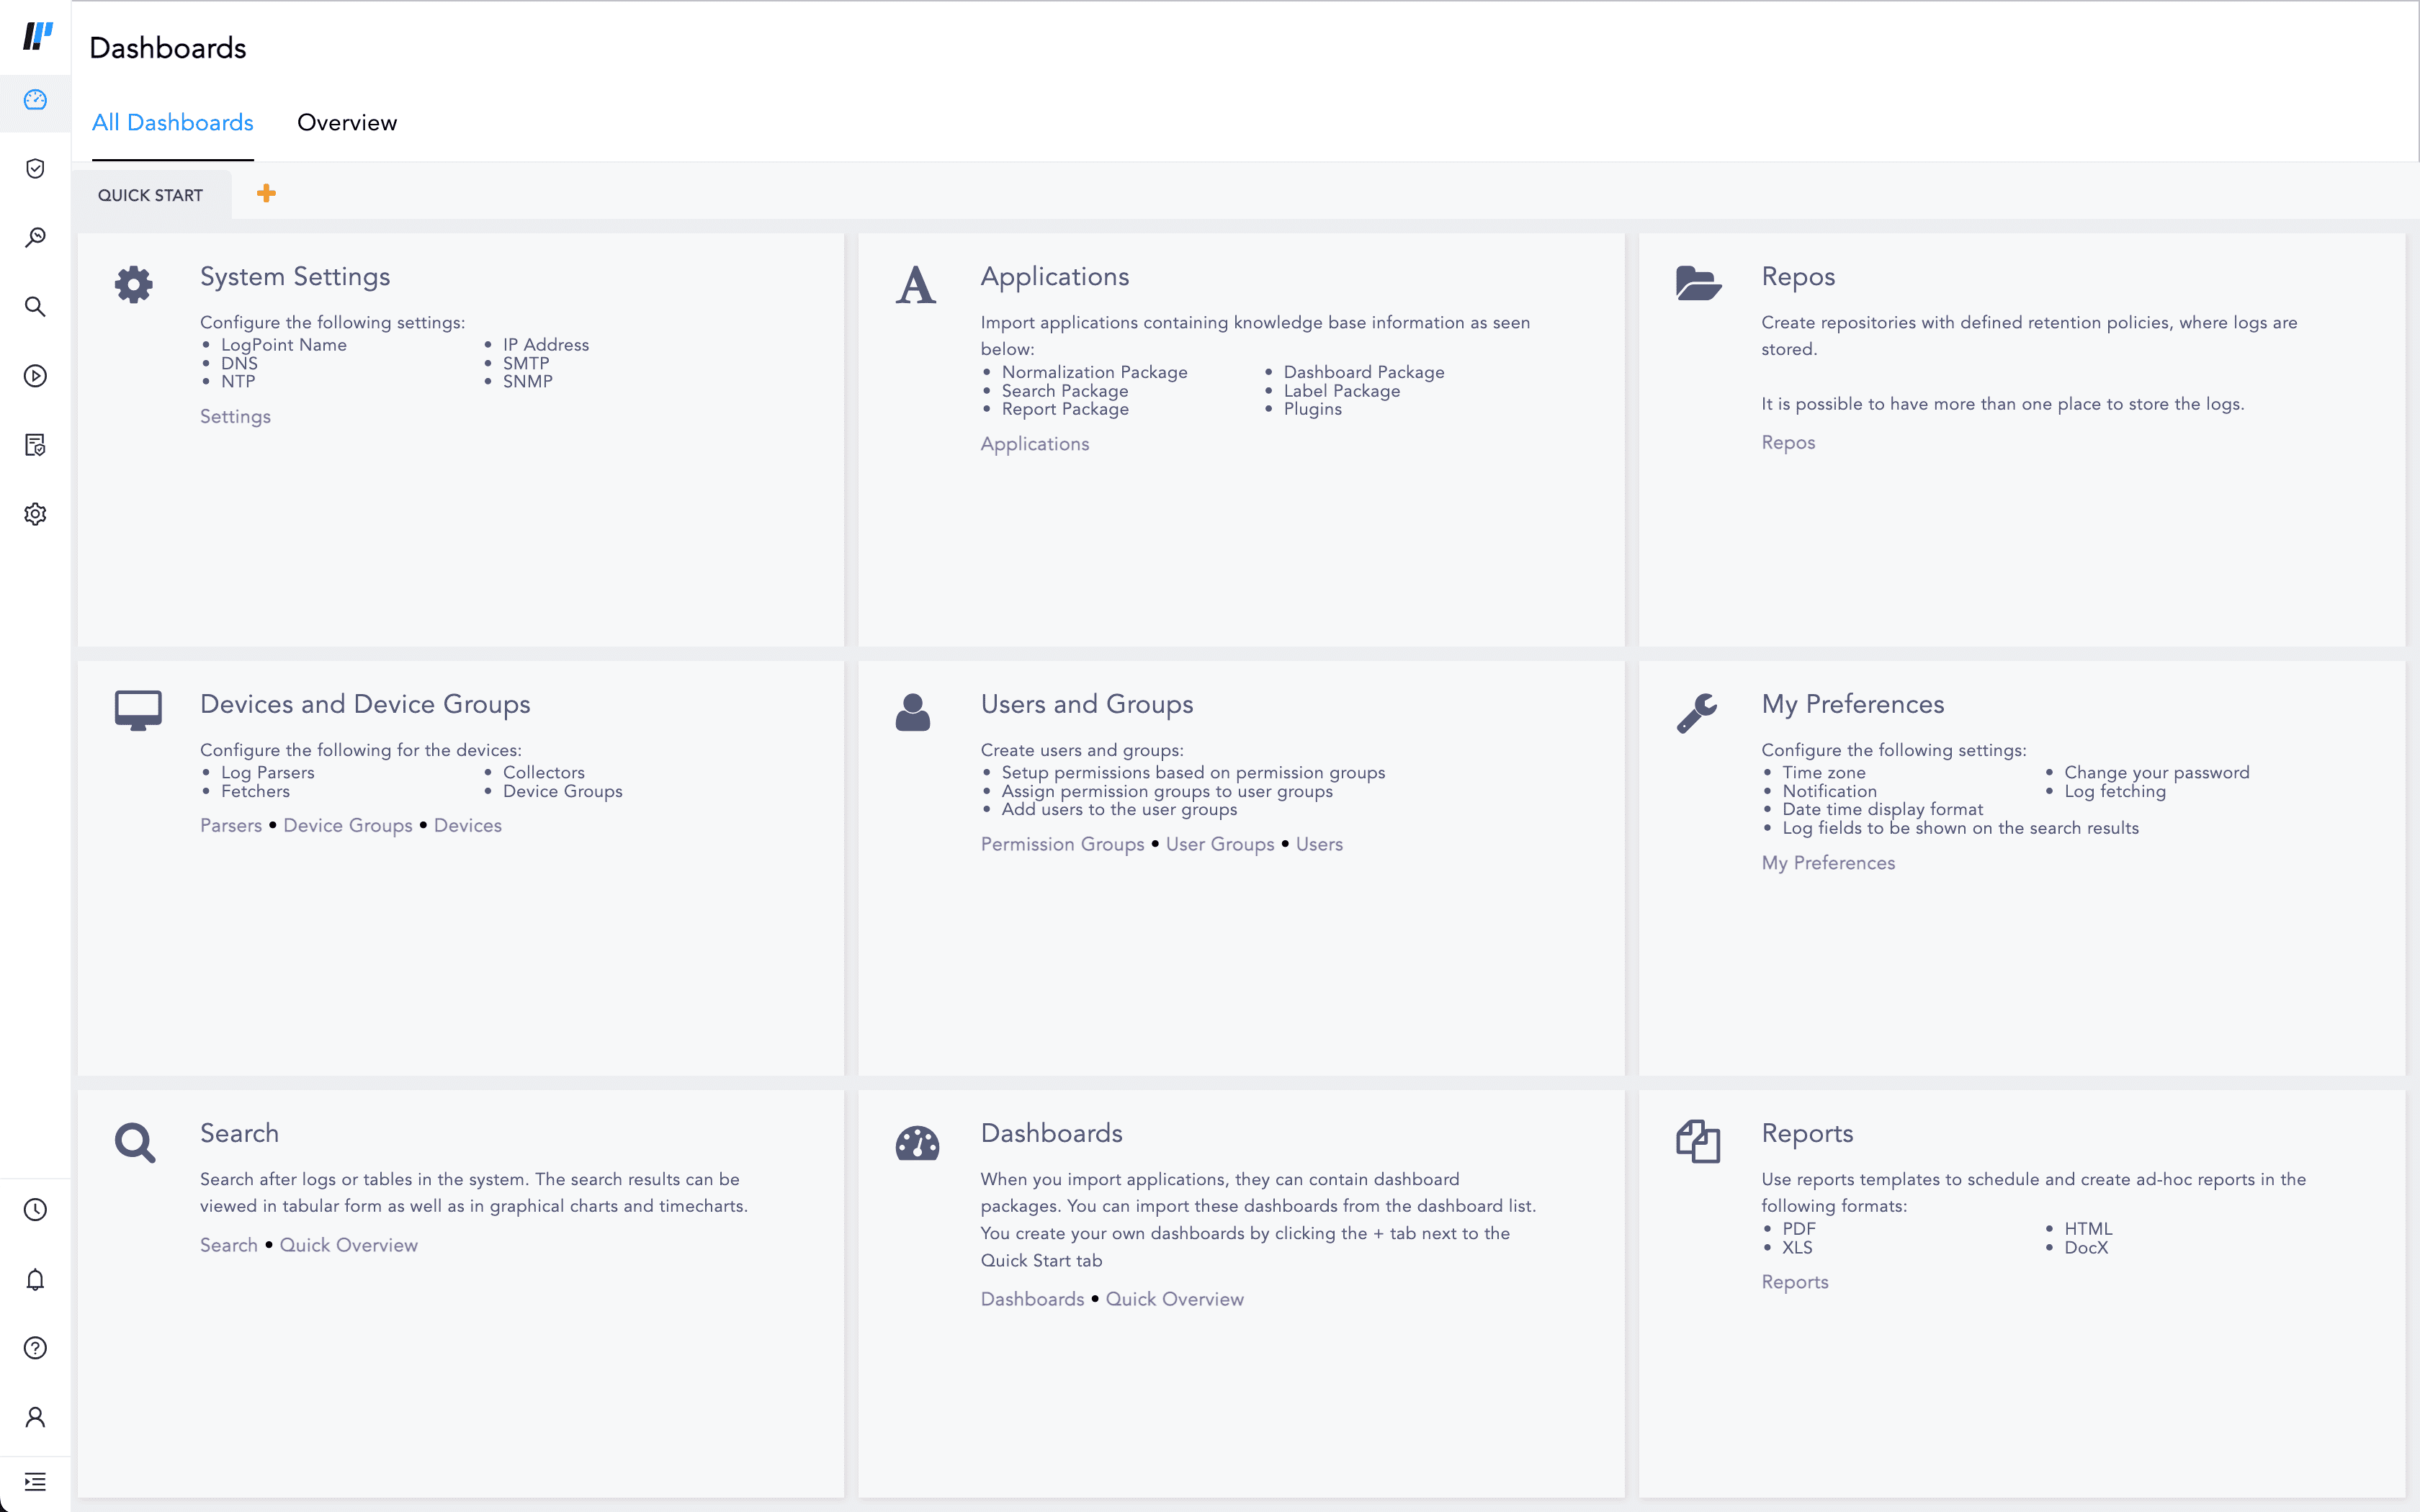
Dashboard Page
Overview allows you to monitor your system operations and real-time cybersecurity incidents based on key measures, workflows, and behavioral patterns. This is a static dashboard that you cannot customize. For more details, go to Introduction to Overview.
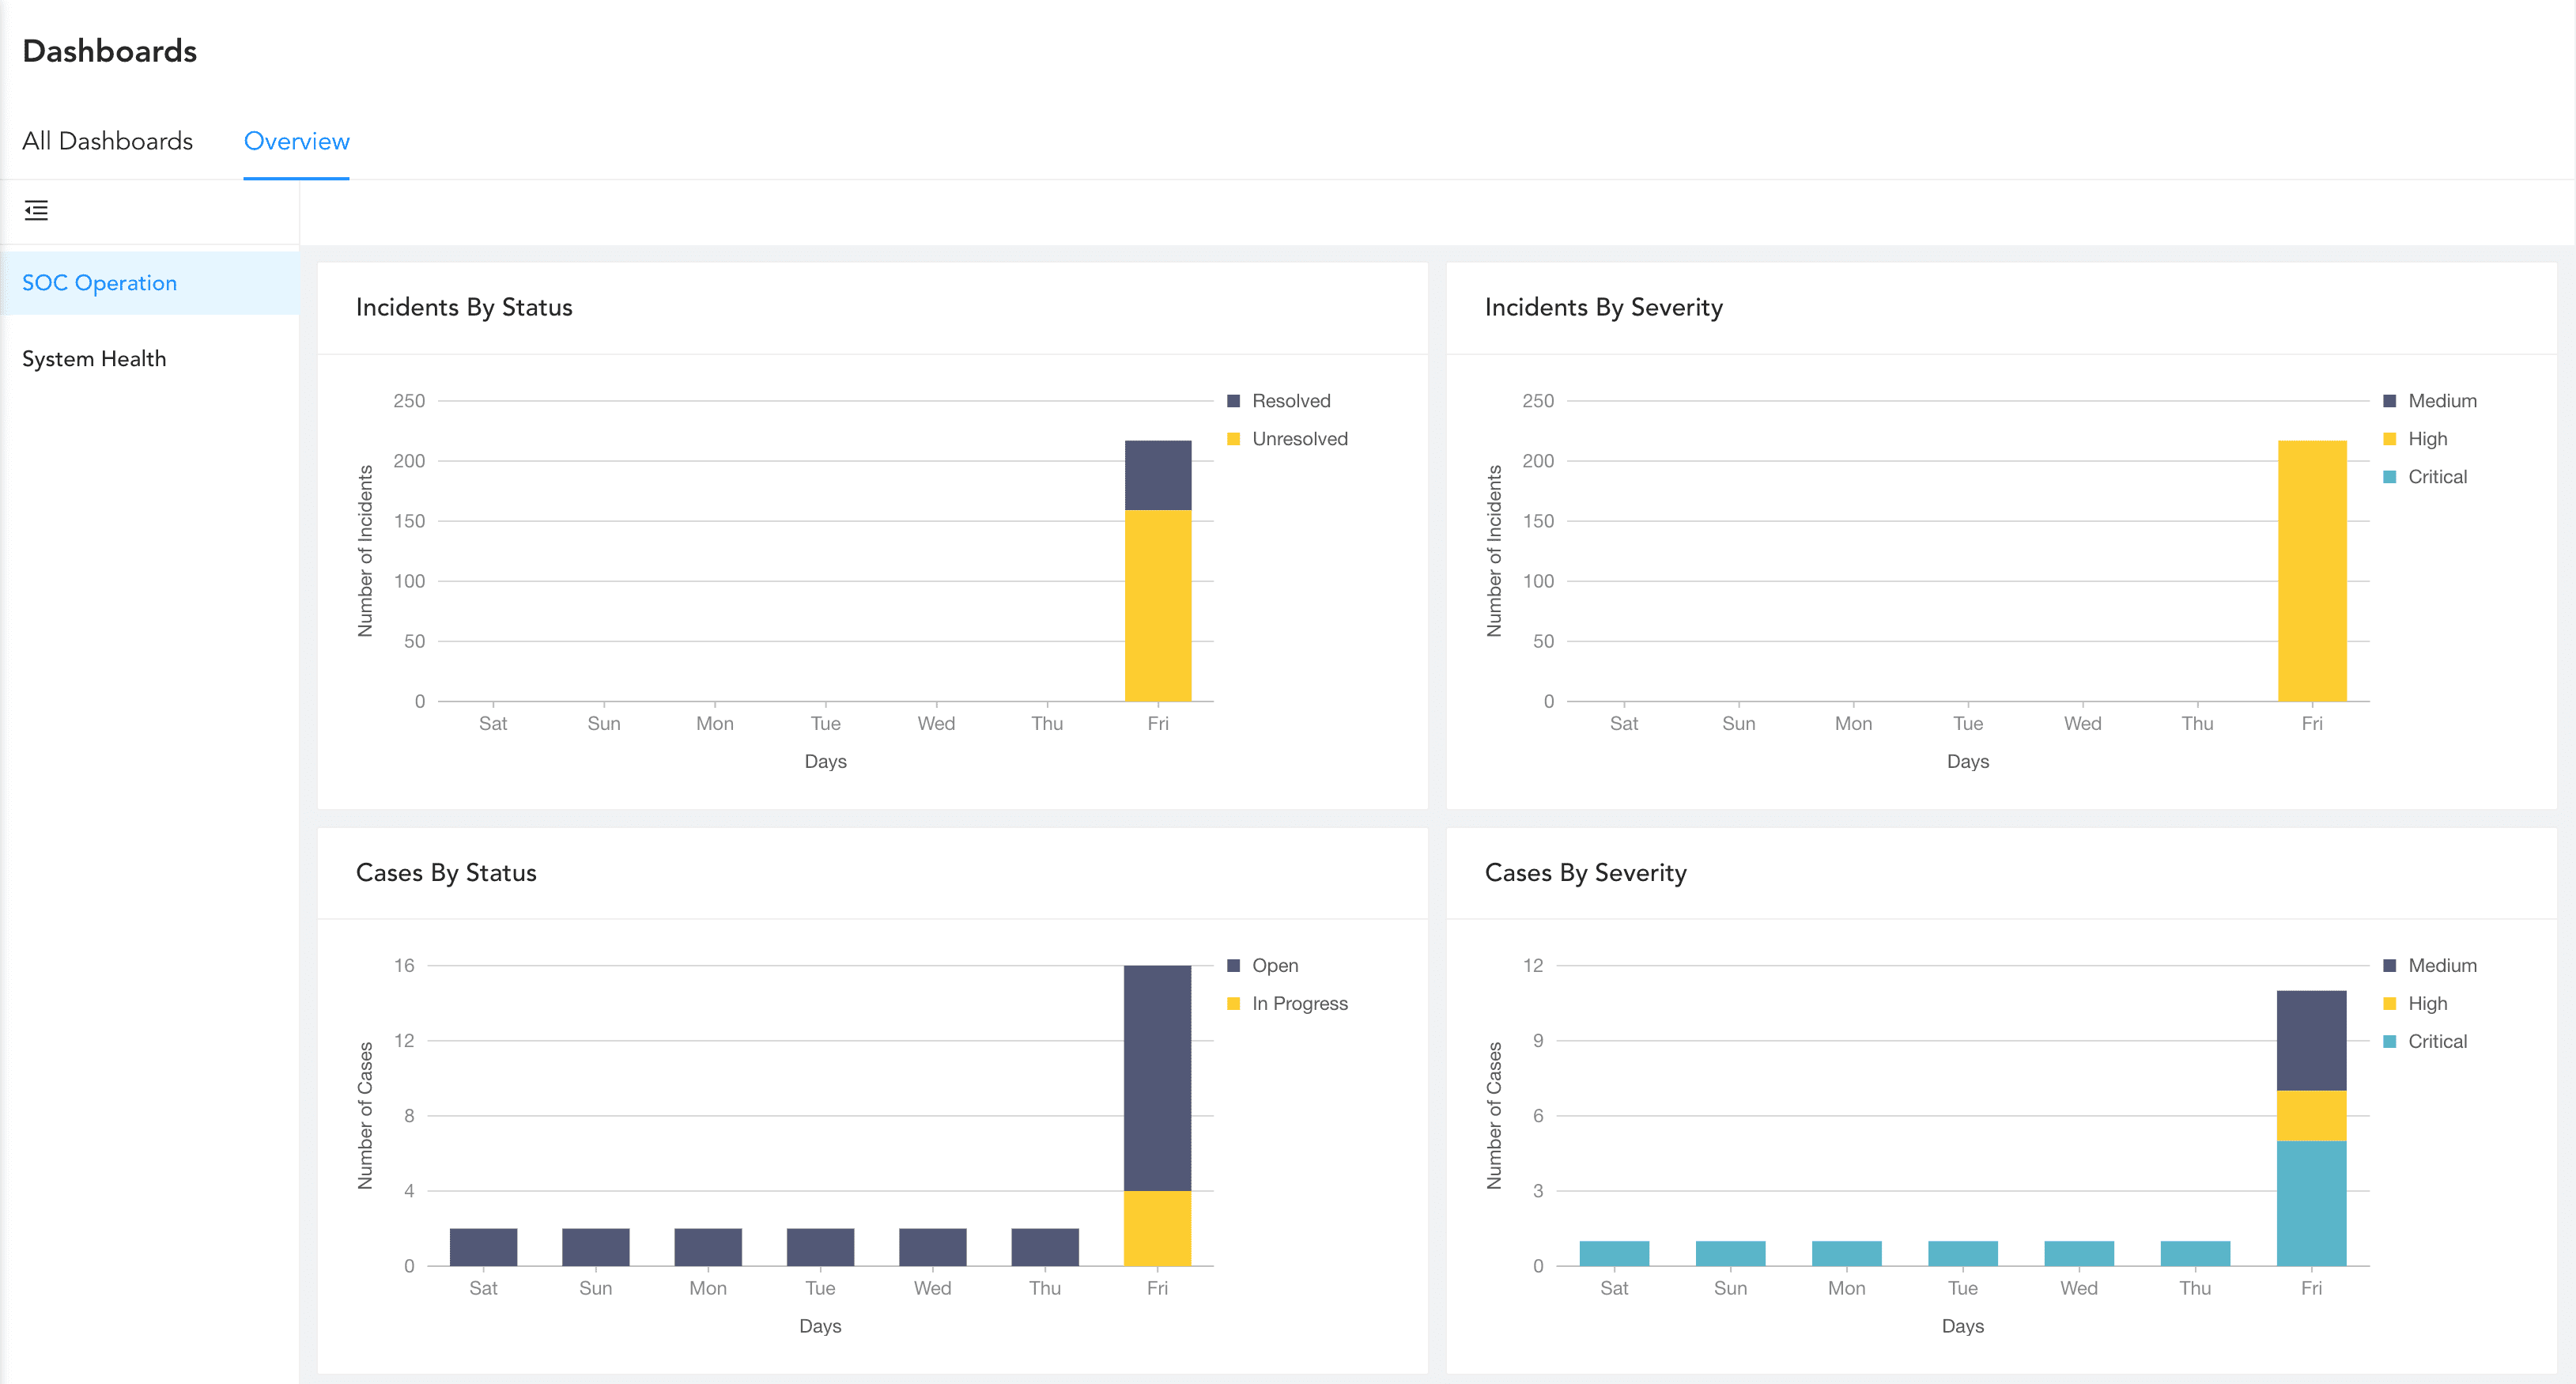
Overview Page
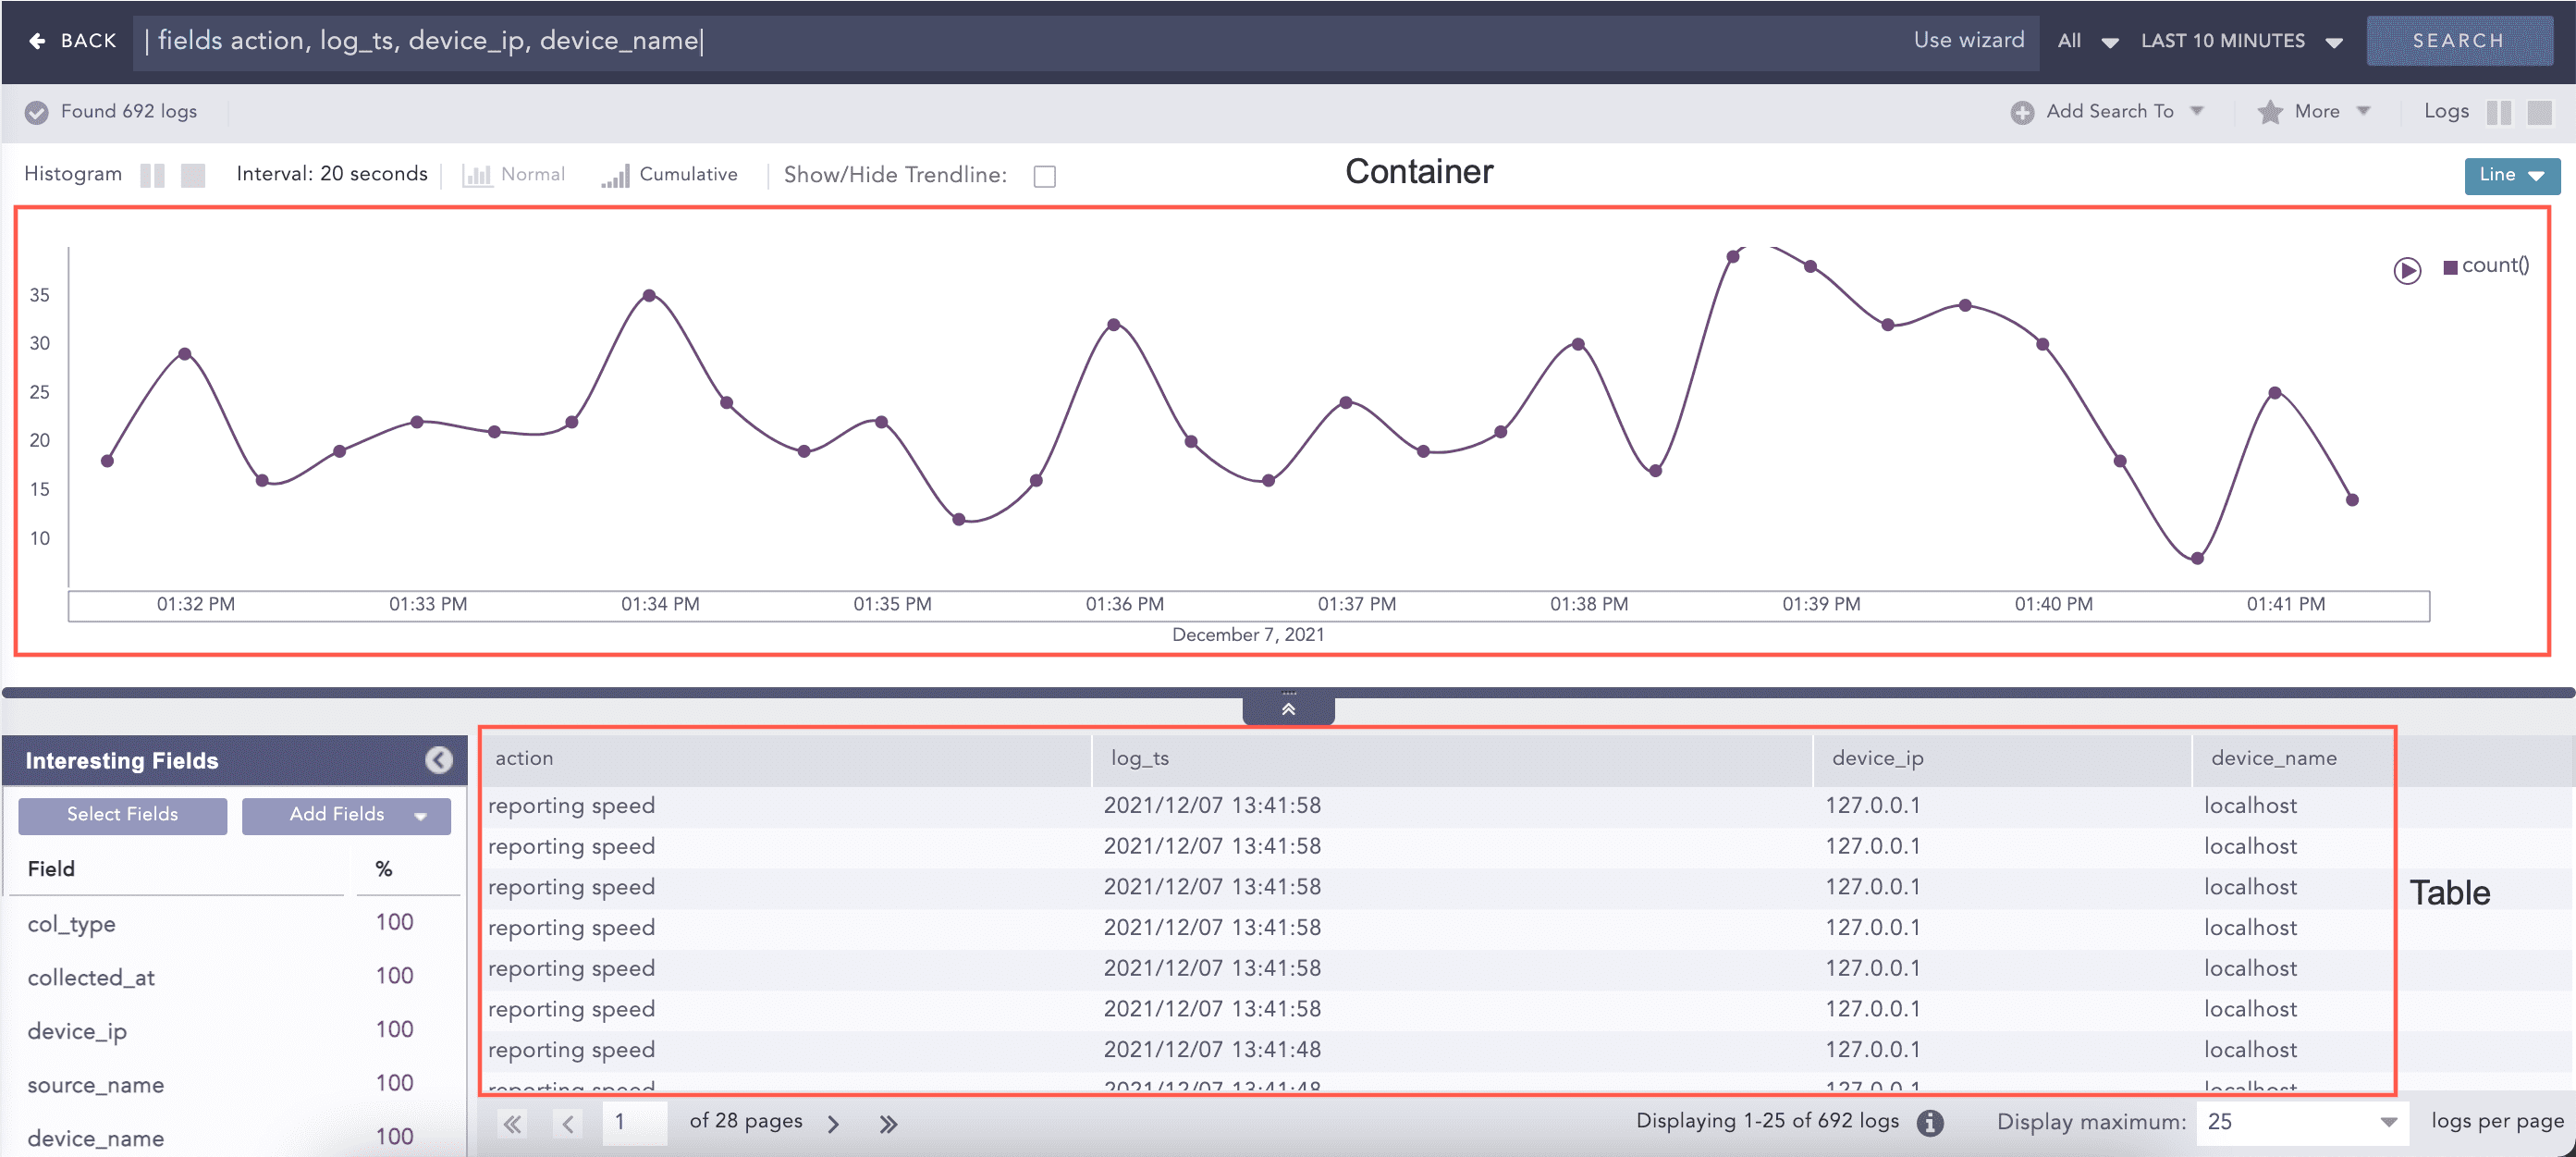
Logpoint provides you with an array of visualization options including regular bar, line and column charts, various other statistical tools have been added. Charts are not only an aesthetically pleasing way to view search results, they also help make data analysis easier.
Newer versions of Logpoint include even more intuitive features that help you gain more insights into optimizing the available resources, predict failures, foresee trends and tendencies, discover different patterns, and prevent potentially critical incidents altogether.
These options are available in:
Search Interface
Dashboards (Widgets)
Search Templates
Add new dashboards. Refer to Creating a Dashboard.
Add widgets to monitor logs in real-time. Refer to Adding a Widget.
Generate reports from the dashboard. Refer to Report.
Share dashboards. Refer to Sharing a Dashboard.
Change Repos for log results of all the widgets. Refer to Change Repos.
Automatically arrange your widgets. Refer to Auto Arrange.
Edit the widgets. Refer to Editing a Widget.
Export dashboards. Refer to Exporting Dashboards using Knowledge Base.
Import dashboards. Refer to Importing a Dashboard using Knowledge Base.
Learn how to drilldown from search visualization. Refer to Drilldown from Search Visualization.
Learn about the features of visualization. Refer to Features of Visualization.
Learn about the various response types to represent search results in visualization. Refer to Response Types in Visualization.