The TreeMap chart visualizes the hierarchical structure of a tree diagram. It displays the weight of each node in the form of the area size. Each node is assigned a rectangular area with their child nodes nested inside. The space of each node inside a parent node is displayed with proportion to all other nodes within the same parent node. If the weight of a child node is zero, the node is not included in the diagram.
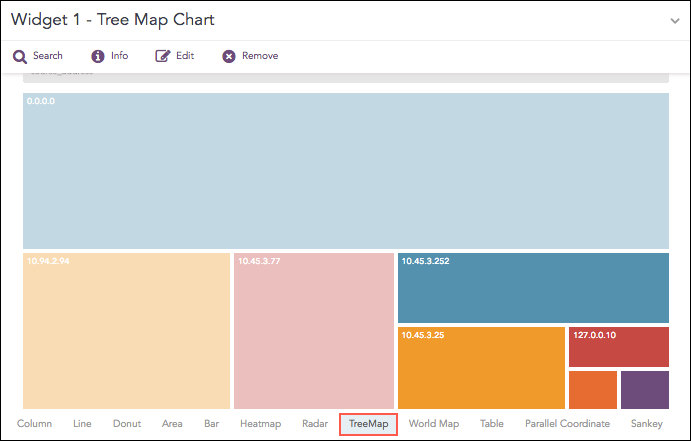
TreeMap chart
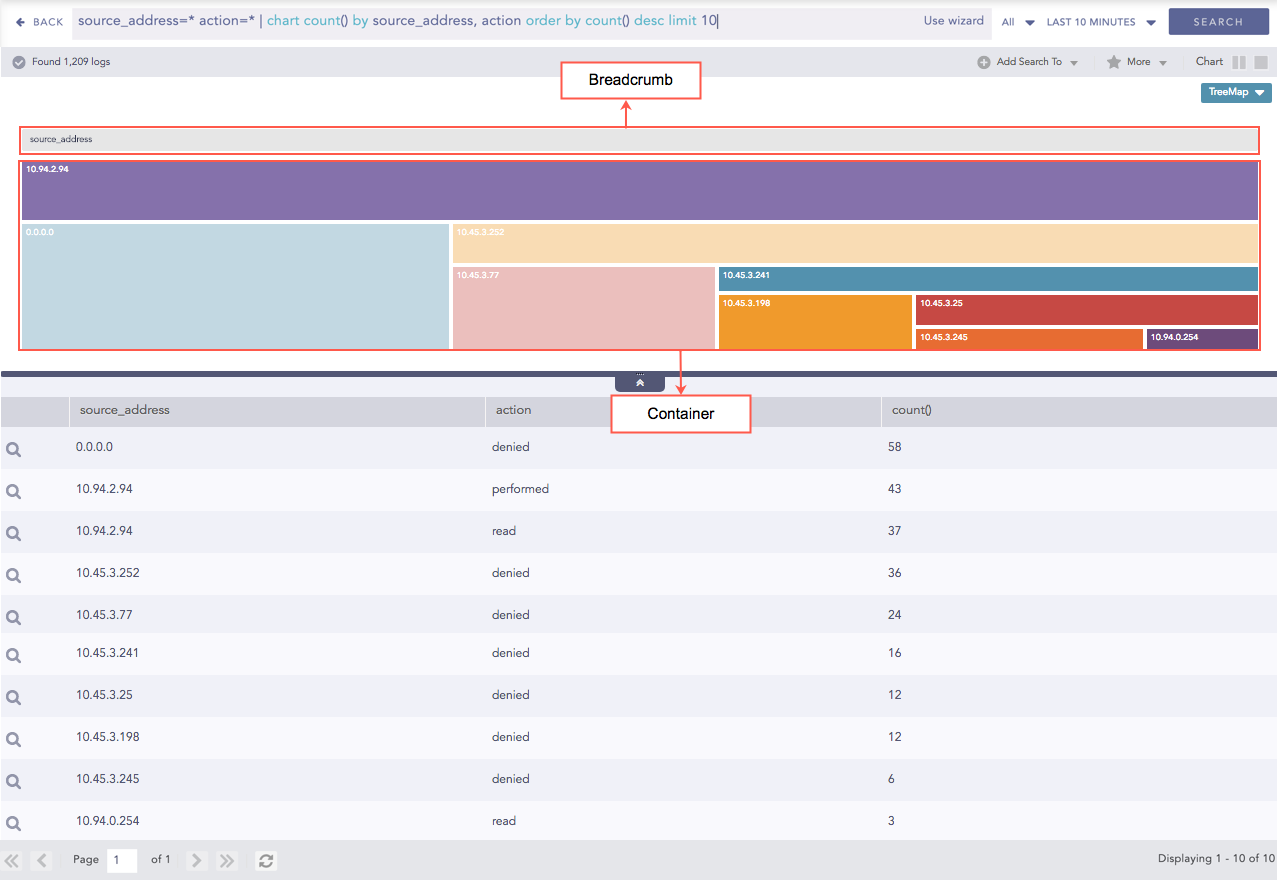
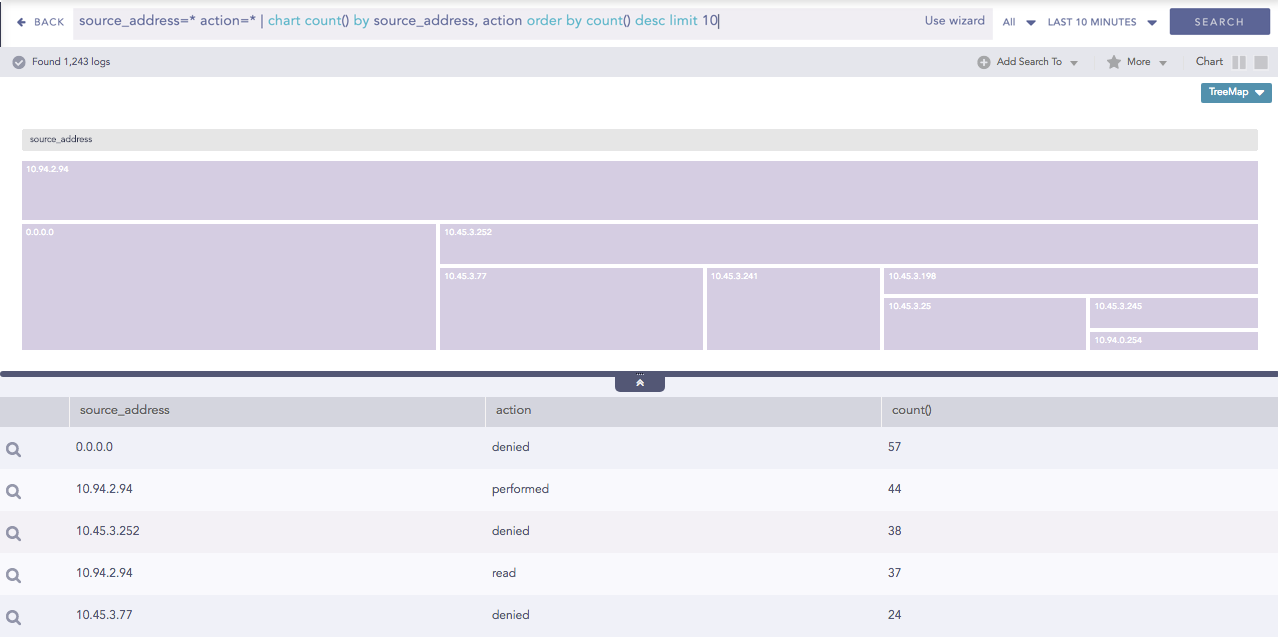
The following query gives the output shown above.
source_address=* action=* | chart count() by source_address, action order by count() desc limit 10
The first grouping parameter is the parent node of a TreeMap diagram, and all its successive parameters are the child nodes.
The name of the first grouping parameter is displayed in the breadcrumb, while all its fields are displayed in the containers as individual nodes.
The Treemap chart supports a single aggregation response types for representation of search results in the visualization. It is :
Response Type |
General Syntax |
|---|---|
| chart aggregation_parameter by grouping_parameter1, grouping_parameter2, ........, grouping_parametern
|
Example:
source_address=* action=* | chart count() by source_address, action order by count() desc limit 10
Treemap chart for Single Aggregation with Grouping
Note
The aggregation parameter determines the area size of each node in the container.
You can refer to Single Aggregation with Grouping for more details.
Click the gear icon on the right side of the breadcrumb to select the rendering parameters for the nodes of the treemap chart.
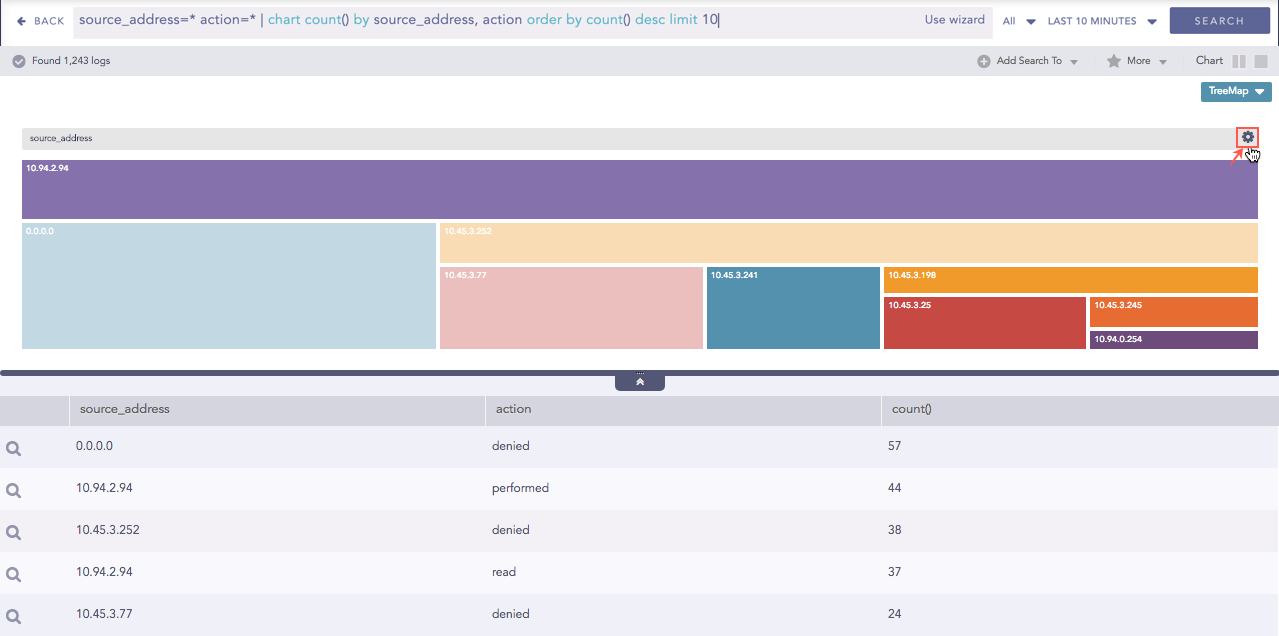
Gear icon for rendering parameter
You can choose one of the following type in the rendering parameters
Single
Unique
Gradient
If the Single type is selected, all the nodes in the container are represented by a single color. You can also select the color to represent the nodes from the Color picker tool.
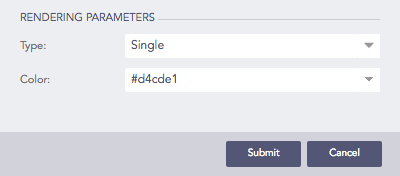
Selecting Single type rendering parameter
Results of Single type rendering parameter
If the Unique type rendering parameter is selected, all the nodes in the container are represented by a unique color. The colors are chosen randomly by the LogPoint itself.
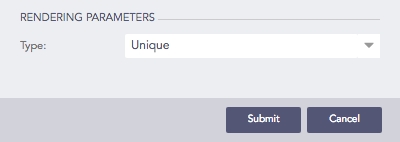
Selecting Unique type rendering parameter
If you select the Gradient type rendering parameter, the Color High represents the node with the most significant area size and Color Low represents the node with the least area size.
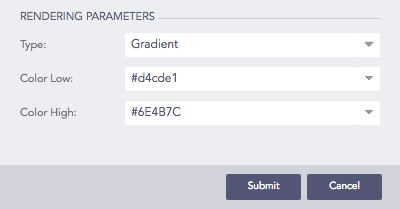
Selecting Gradient type rendering parameter
Each section has a defined color, and different shades of color represent all the nodes of the division. The darkest shade represents the node with the most significant area size, and the shade of the color fades as the area size of the nodes decrease.
You can select the color for the nodes of high area value and low area value from Color High and Color Low drop-down menu respectively.
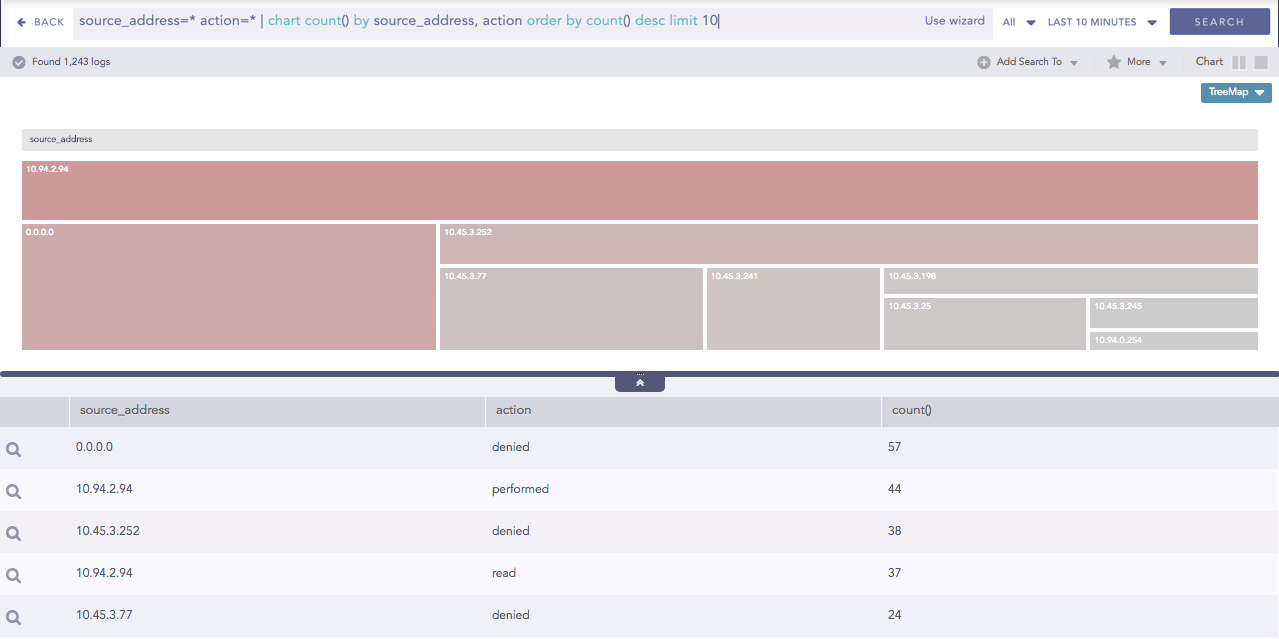
Results of Gradient type rendering parameter
The Zoom In feature allows you to click any node of the container and expand the chart further.
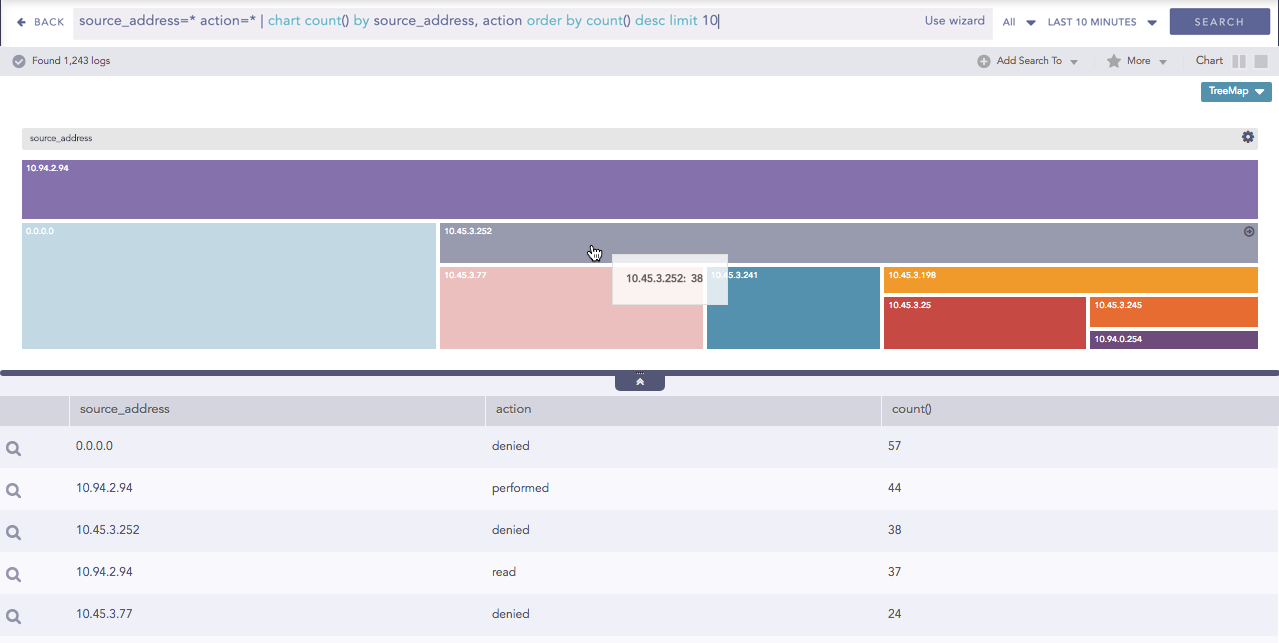
Zoom In feature of Treemap chart
The expanded diagram displays the nodes of the successive grouping parameter associated with the selected parent node. The new node is shifted to the breadcrumb, and the container is updated with the fields of the node in the breadcrumb.
For example: In the diagram above, when the user clicks source_address 10.45.3.252, it is shifted to the breadcrumb and all its related fields are displayed in the container.
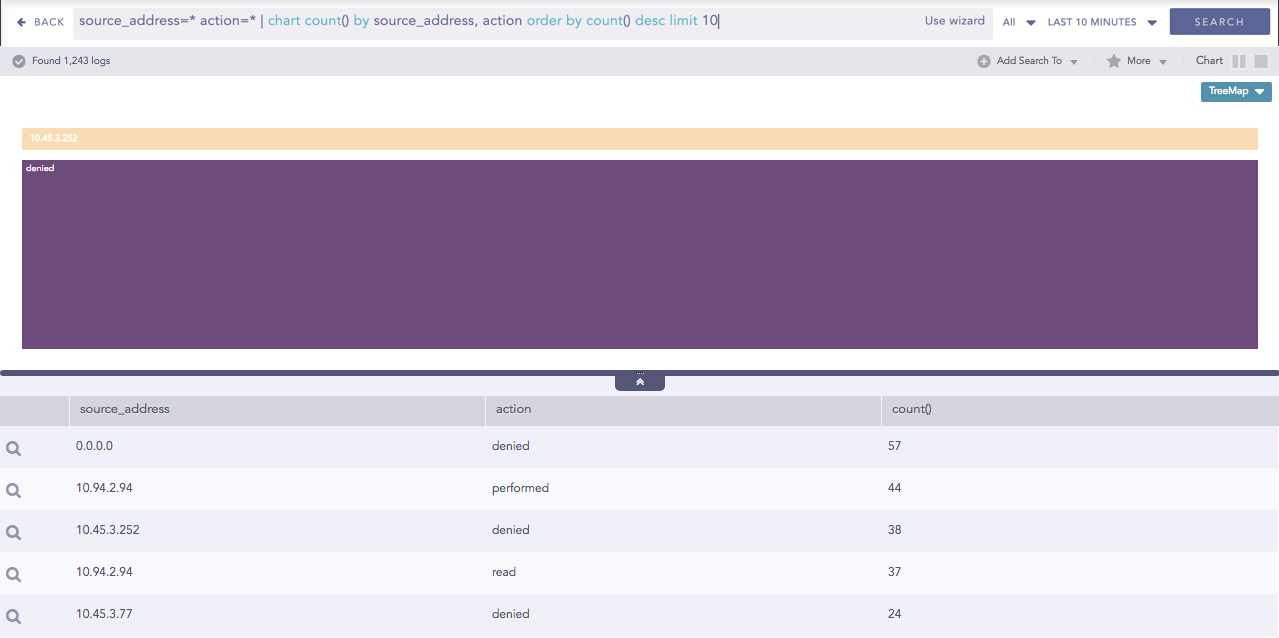
Treemap after zooming in to source_address 10.45.3.252
With the Zoom Out feature, you can go back to the previous state of the diagram by clicking the breadcrumb.