This dashboard consists of the following widgets:
Widget Name |
Description |
|---|---|
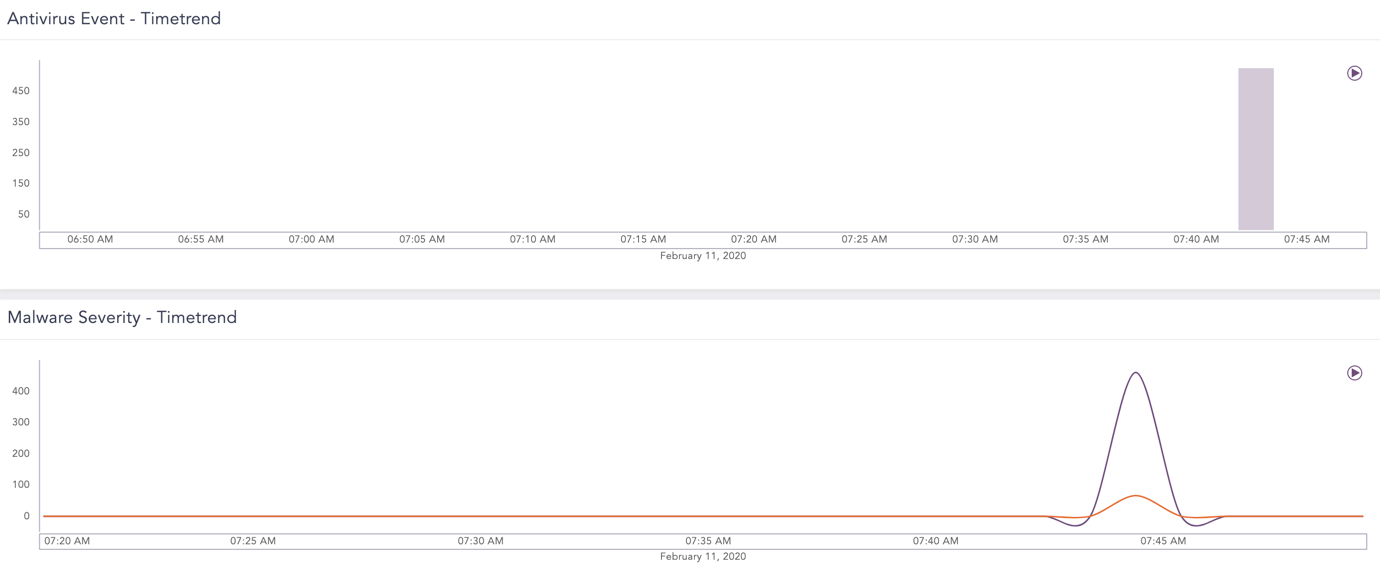
Antivirus Event - Timetrend |
The time trend of the antivirus events took place on a victim’s computer. |
Top 10 Infected Files |
The top ten files infected by a threat, virus or malware. |
Top 10 Viruses |
The top ten viruses or threats that could cause damage to data and software. |
Top 10 Actions |
The top ten actions, such as login attempts designed to damage a computer or server. |
Top 10 Infected File Path |
The top ten areas on the computer that malicious software is most likely to infect. |
Top 10 Users |
The top ten users detected on your network vulnerable to threats. |
Infection Details |
The details on how malware was introduced on the victim’s computer and its severity. |
Top 10 Infected Workstations |
The top ten workstations or hosts infected by a virus, threat or malware. |
Malware Severity - Timetrend |
The time trend of malware severity where 1-39 indicates information, 40-79 indicates warning and 80 - 100 indicates threat. |
Go to Settings >> Knowledge Base from the navigation bar and click Dashboards.
Select VENDOR DASHBOARD from the drop-down.
Click the Use icon from Actions.

Adding the ESET Dashboard
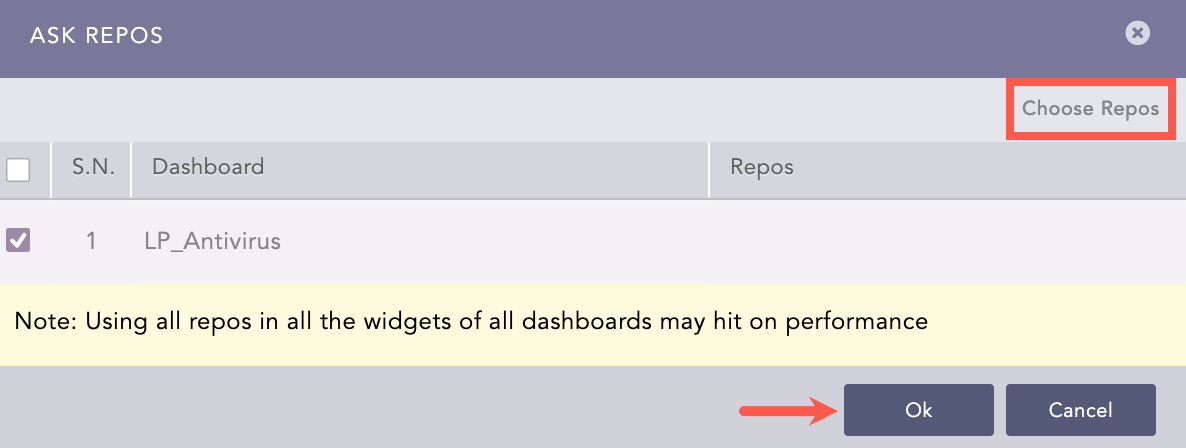
Click Choose Repos.
Selecting Repos
Select the repo and click Done.
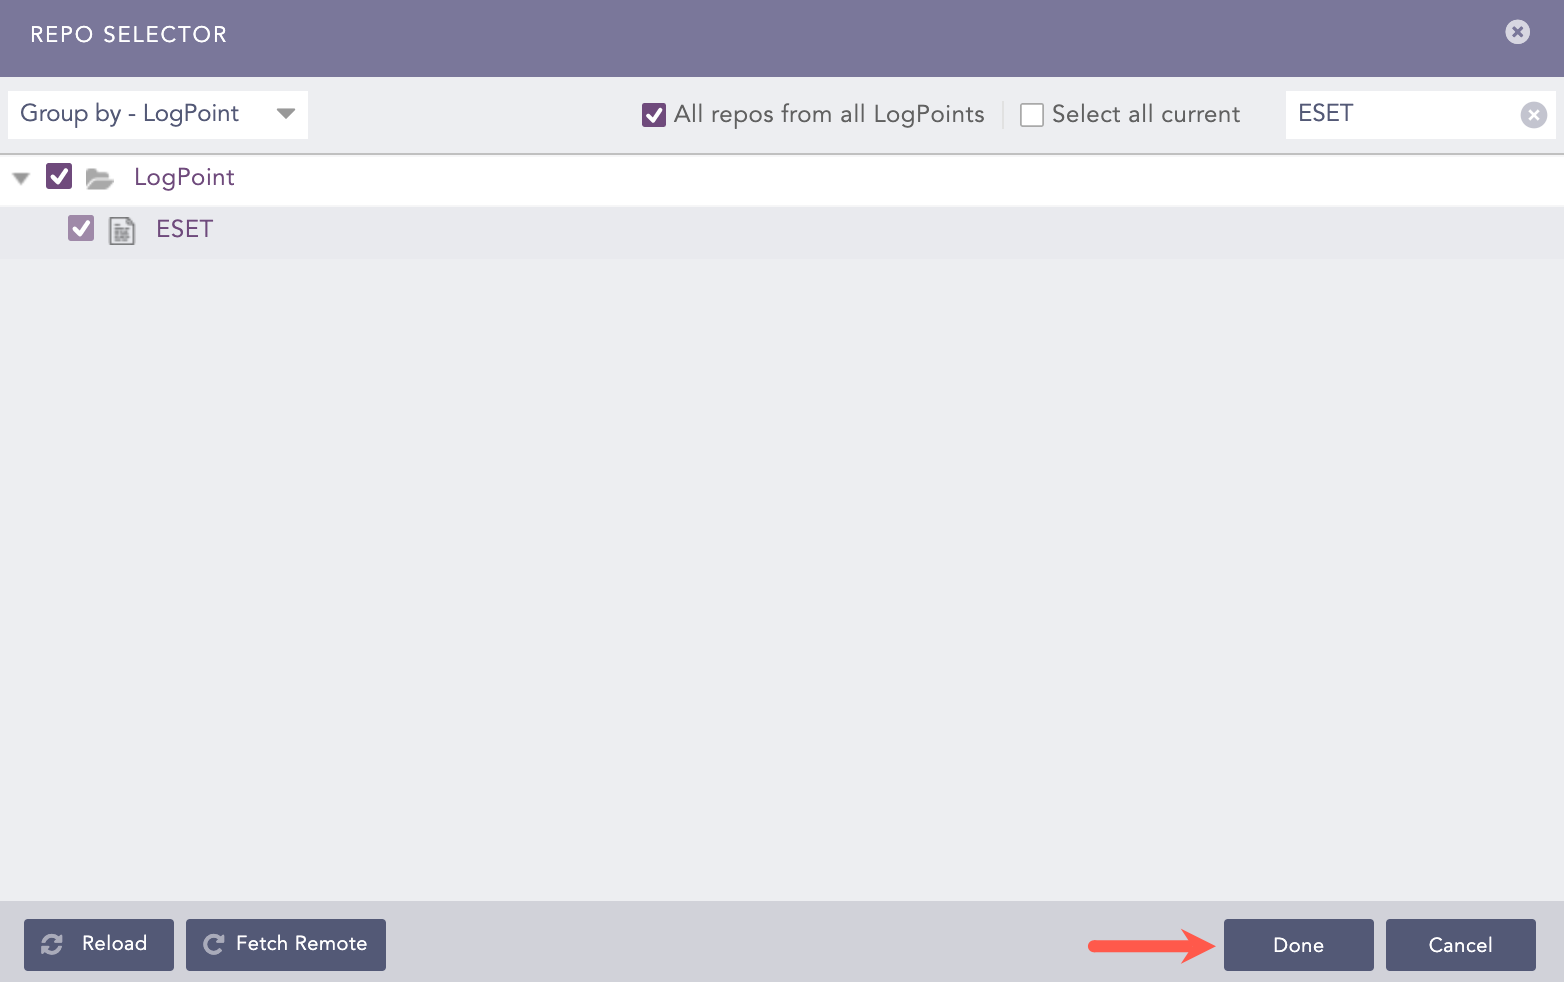
Selecting Repos
Click Ok.
You can find the ESET dashboard under Dashboards.
ESET Dashboard