Dashboard
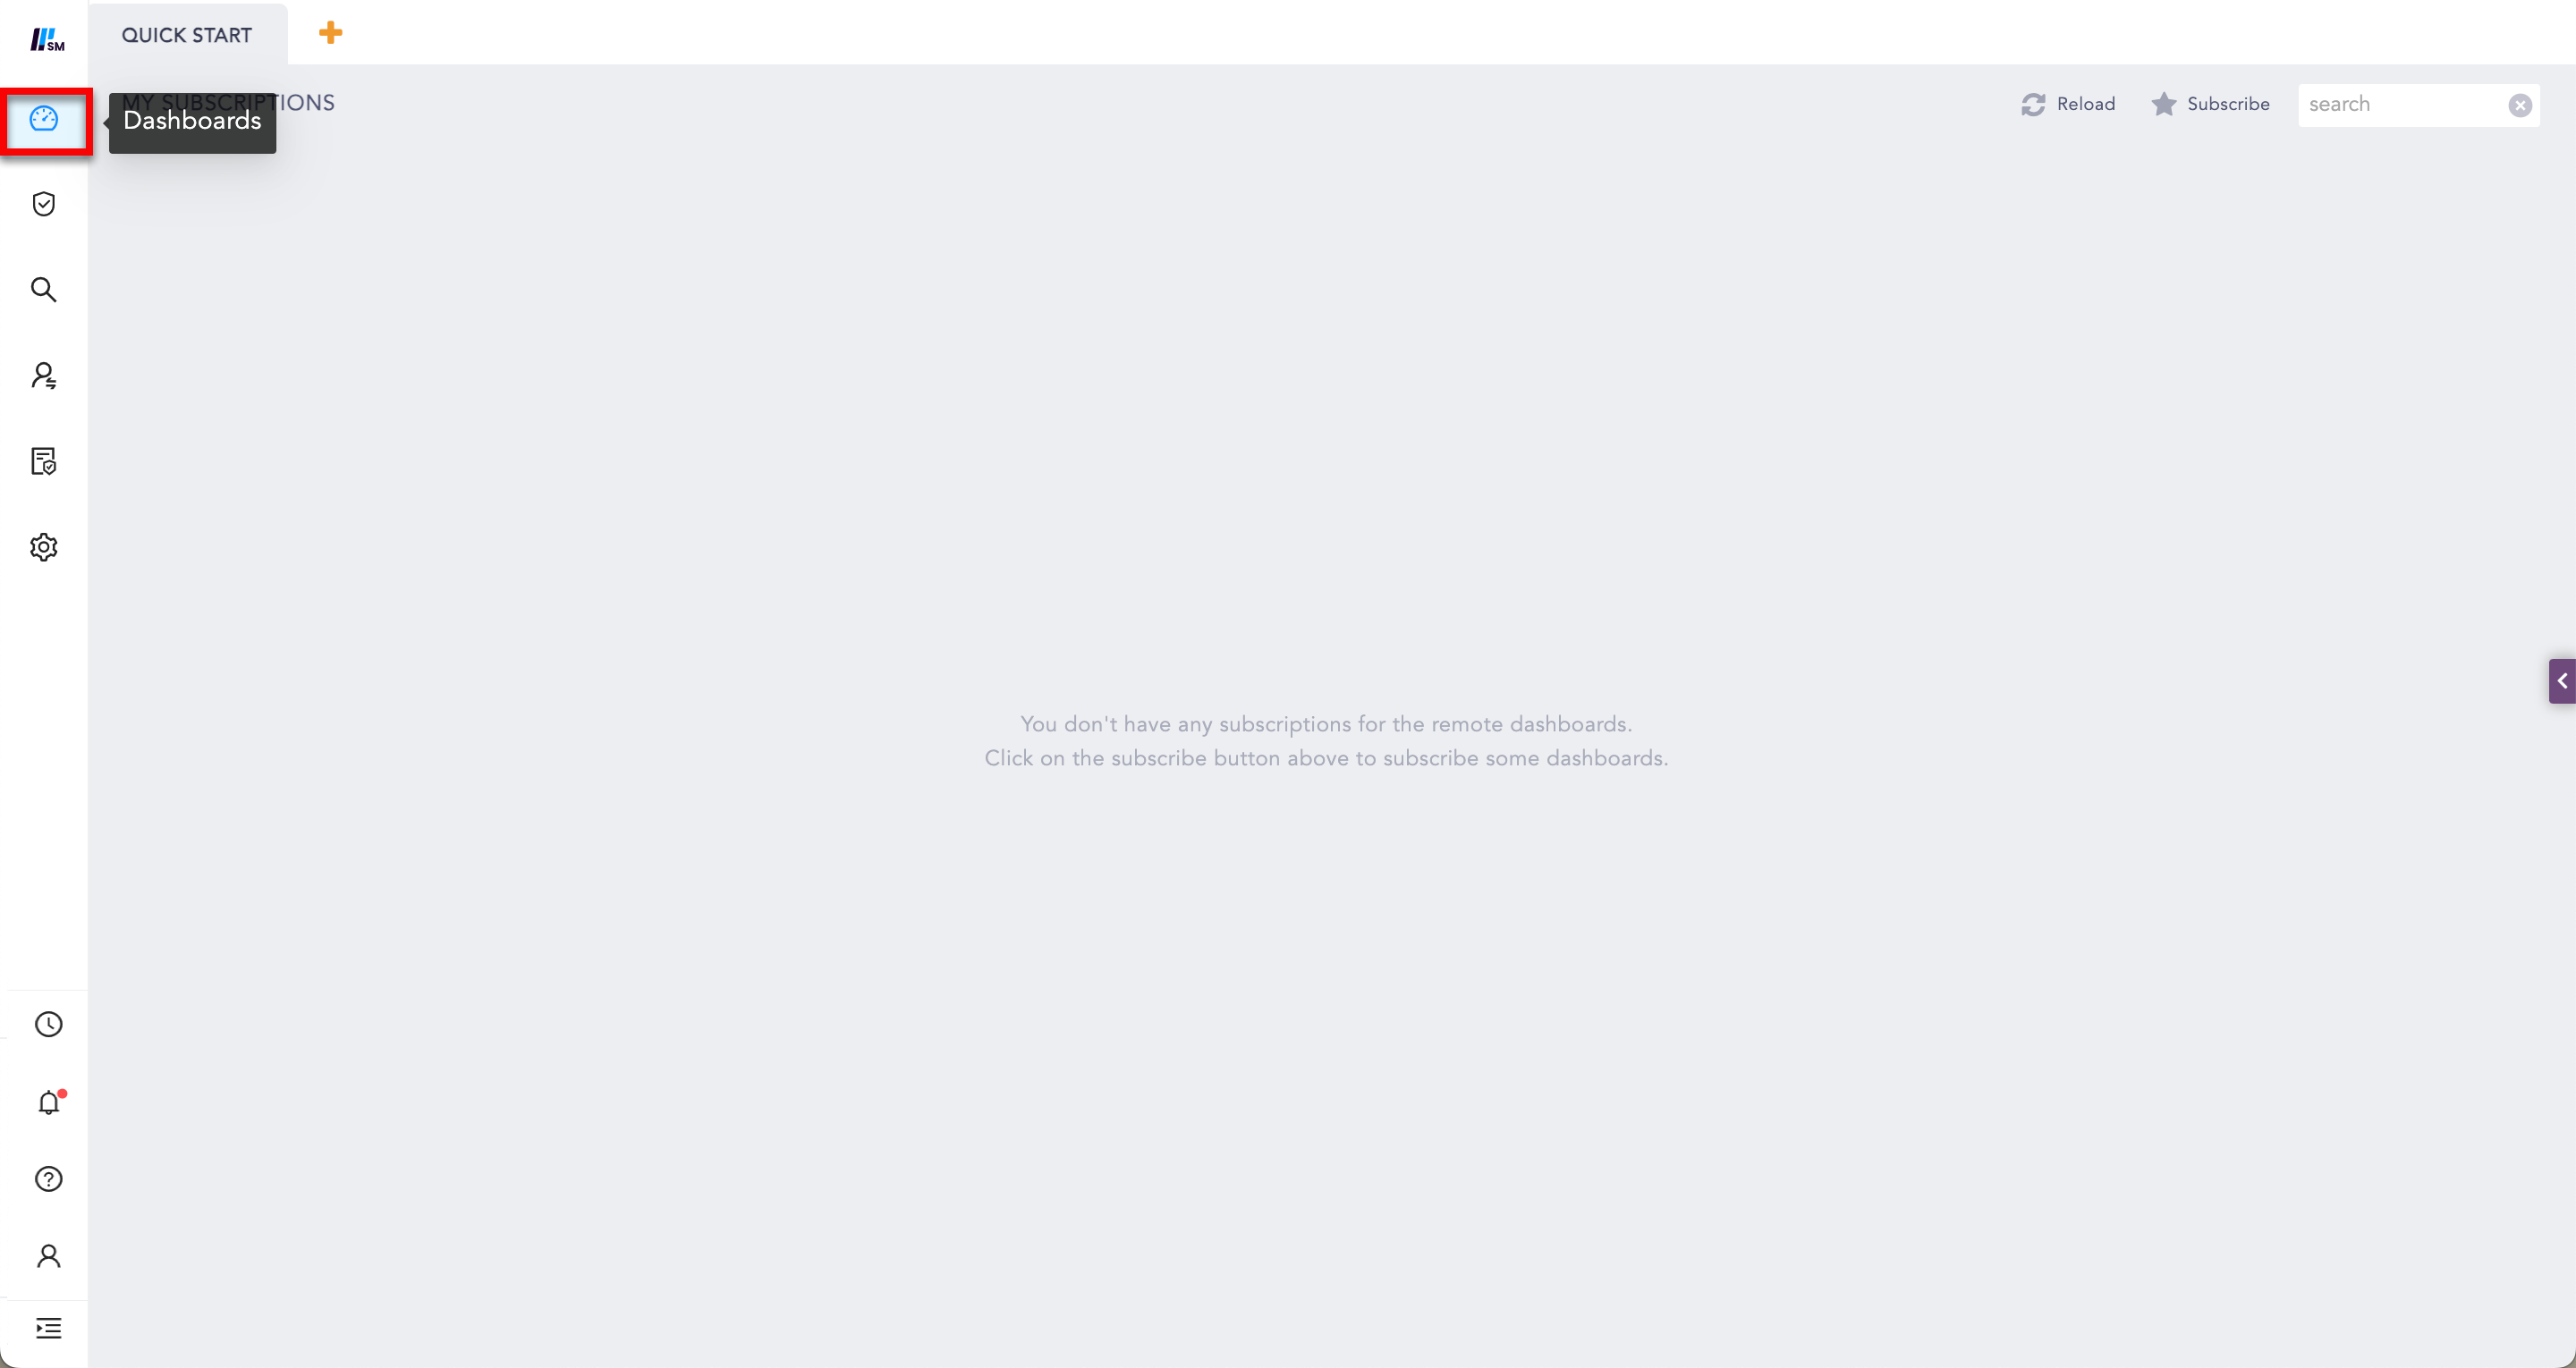
The Dashboards section lists all Fabric-enabled LogPoint dashboards. LPSM provides different actions to view and manage the dashboards from a central location.
You can perform the actions individually or in bulk. However, the dashboards of Fabric-enabled LogPoint instances must be compatible with each other to perform any action. The version compatibility of dashboard actions are:
Fabric-enabled LogPoint |
Compatible Fabric-enabled LogPoint Versions |
|---|
6.11.x |
6.10.x to 6.12.x |
6.12.x |
6.10.x to 6.12.x |
7.0.x |
6.10.x to 7.0.x |
7.1.x |
6.11.x to 7.2.0 |
7.2.x |
6.11.x to 7.2.x |
Adding Dashboards in a Fabric-enabled LogPoint
You can add a dashboard on behalf of any user of Fabric-enabled LogPoint from the Dashboard section. However, to do this, you should have the Create permission for dashboards.
Click the + icon beside the Quick Start tab.
Note
The + icon is hidden if you do not have sufficient permission to create dashboards.
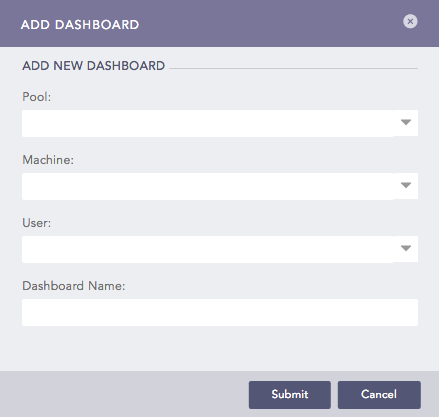
Select the LogPoint Pool where you want to create the dashboard. The Pool drop-down lists all the LogPoint pools created in the LPSM.
Select the LogPoint Machine where you want to create the dashboard. The Machine drop-down lists all the LogPoint machines within the selected LogPoint Pool.
Select the LogPoint User. The User drop-down lists all the LogPoint users within the selected LogPoint machine. The dashboard is created on behalf of the selected user.
Enter a Dashboard Name for the dashboard.
Click Submit.
The Dashboard is populated in the Quick Start tab and is subscribed by default.
Note
In LPSM, the data populated in the dashboard widget is user-specific. However, when the LPSM Users drill-down on the search result of a dashboard widget, they are forwarded to the Search page. They automatically have the administrative privilege of that Fabric-enabled LogPoint, which means they have access to all the Repos of the Fabric-enabled LogPoint.
For, example, let’s say a Fabric-enabled LogPoint “Fabric_LogPoint_A” has a user named “John” with access to only one Repo named “Repo_John.” This LogPoint has three other Repos named “default,” “_logpoint”, and “LogPoint_Alert.” Now in LPSM, a new dashboard tab is created on behalf of John. Here, while creating the dashboard widget, the only available repo option is “Repo_John.” Also, the data populated in the dashboard is extracted from the repo “Repo_John”. However, upon drill down of the data from the dashboard widget, the LPSM user gets navigated to the Search section. The search query thus performed gets access to all the available Repos: “default,” “_logpoint”, and “LogPoint_Alert” for that particular “Fabric_LogPoint_A.”
Some LPSM Dashboard Actions
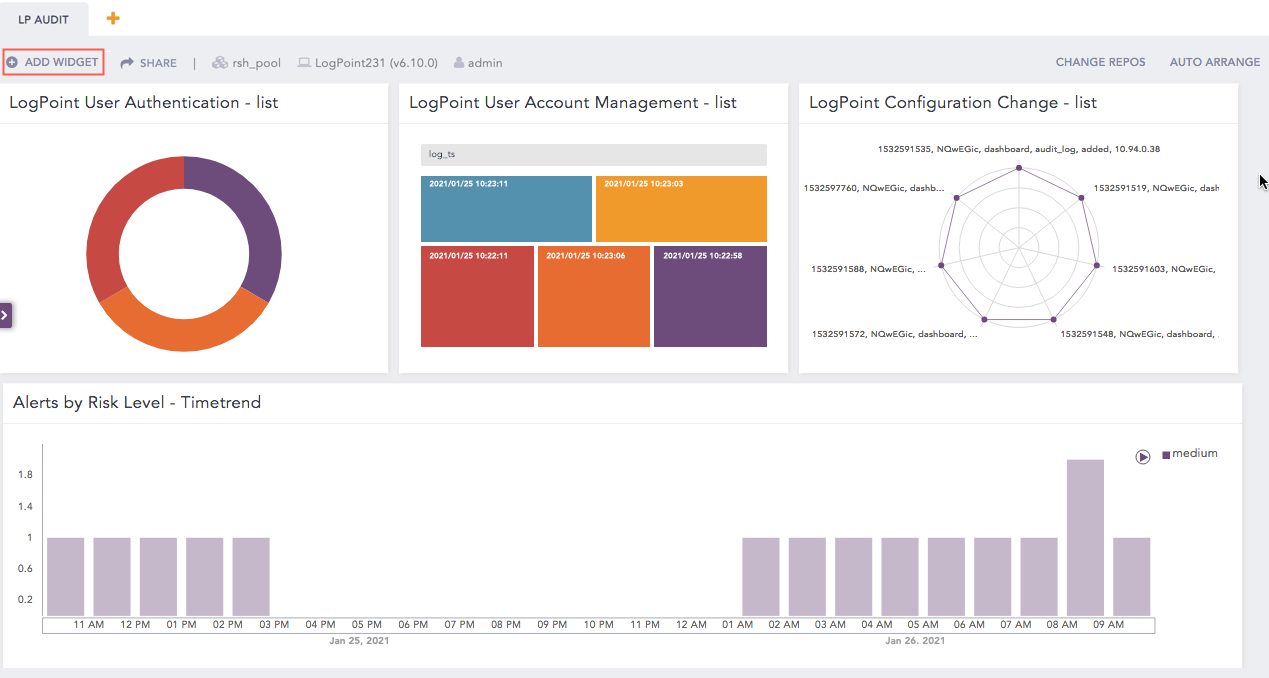
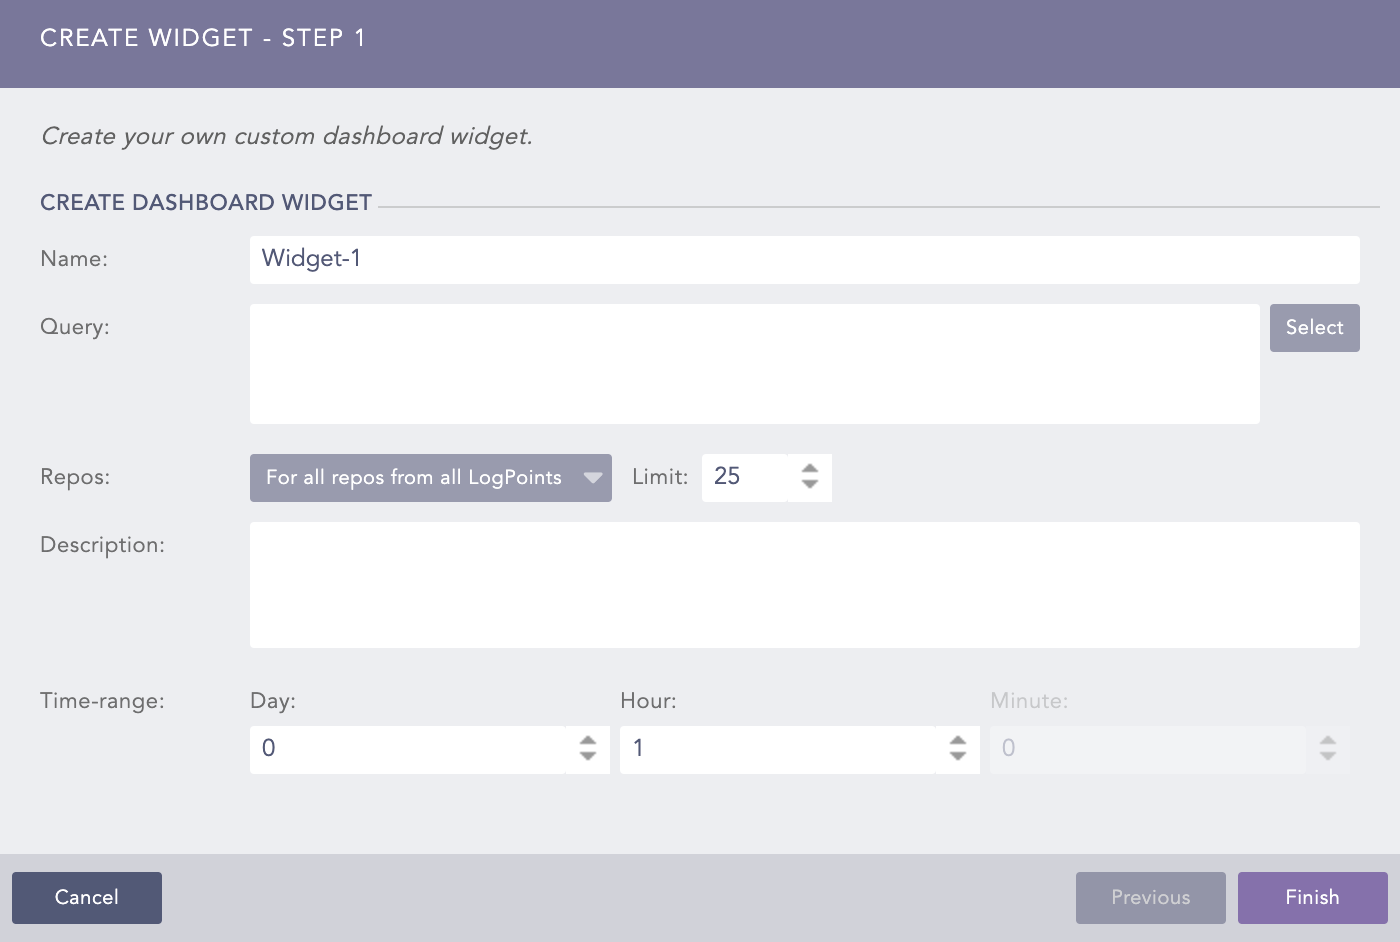
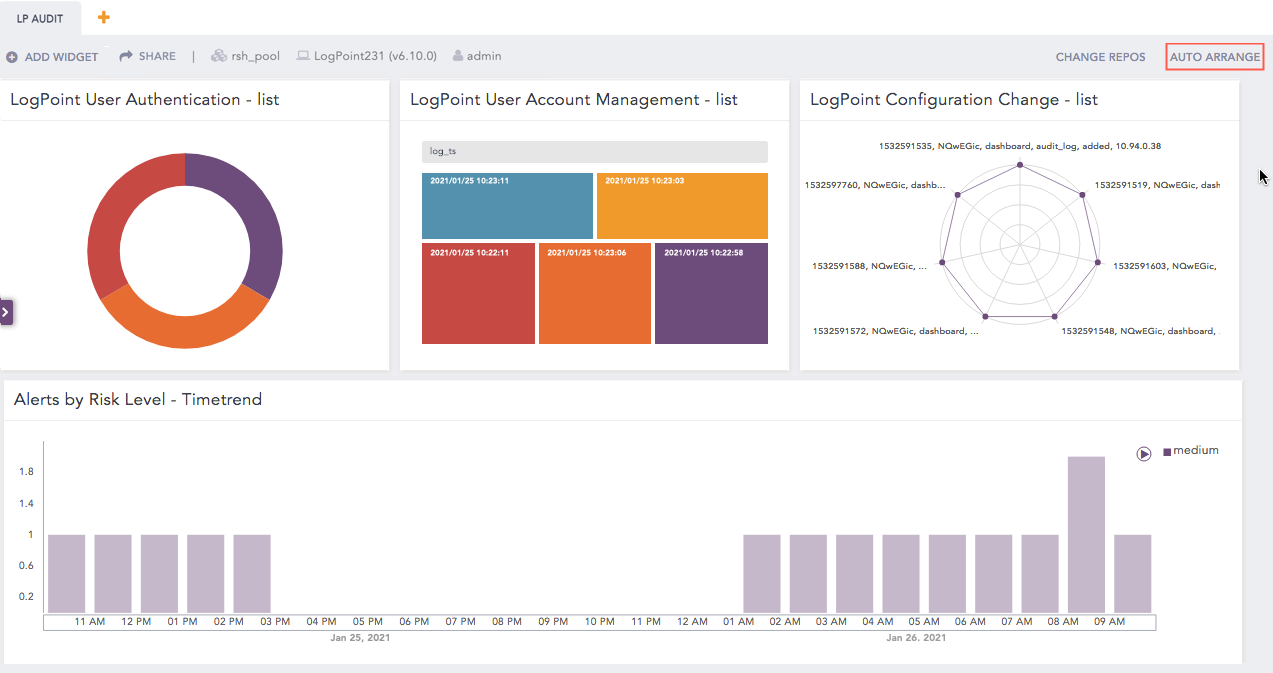
After you add the subscribed dashboards to the Dashboard, you can add, edit, or remove widgets or search from the dashboard.
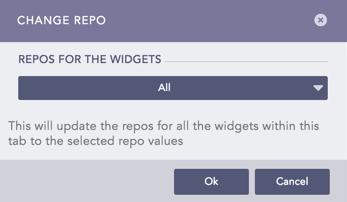
Changing Repos
You can update the repos for all the widgets of a particular dashboard tab.
Go to Dashboard from the navigation menu.
Select the subscribed dashboard where you want to change the repos.
Click Change Repos.
Select the option from Repos for the Widgets.
Click Ok.
Searching from Dashboard
You can directly navigate to the search page using the widget query of a dashboard.
Go to Dashboard from the navigation menu.
Select the widget of the subscribed dashboard to search.
Hover the mouse at the upper right corner of the concerned widget and click the Widget Options ( ) icon.
You can see the following editing icons for the widget.
Click the Search ( ) icon to navigate to the Search page and perform a search operation for the given widget configuration.
Note
The Search () icon allows to search logs as an admin user even if the dashboard widget is specific to a particular LogPoint user.
You can use the Details ( ) icon to view the details of the concerned widget.
You can now search the indexed logs coming from Fabric-enabled LogPoints for the corresponding widget query. Refer to the Search Page section for more details about LPSM Search.
Sharing Dashborads from the Dashboard Page
Go to Dashboard.
Select the dashboard you want to share and click Share.
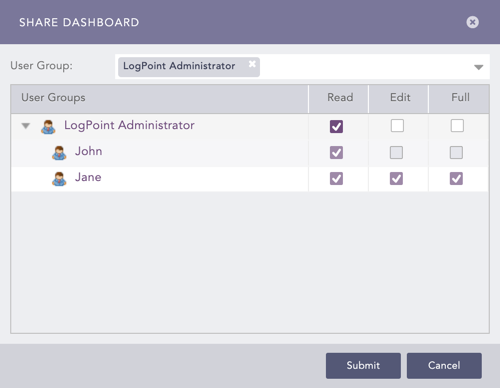
Select a User Group. All the users in that user group are listed in the drop-down.
Select the Read, Edit, or Full permission for the users.
Click Submit.
Sharing a Dashboard from the LogPoint Configuration Page
Go to Settings >> LogPoint Configuration >> Dashboards.
Click the Share ( ) icon from the Actions column for the dashboard.
Select a User Group. All the users in that user group are listed in the drop-down.
Select the Read, Edit, or Full permission for the users.
Click Submit.
Note
You can Unshare dashboards using the same method.
Pushing Dashboards
You can push dashboards to replicate it for Fabric-enabled LogPoint users across the same pool or different pools.
Follow the steps below to push dashboards:
Go to Settings >> LogPoint Configuration >> Dashboard.
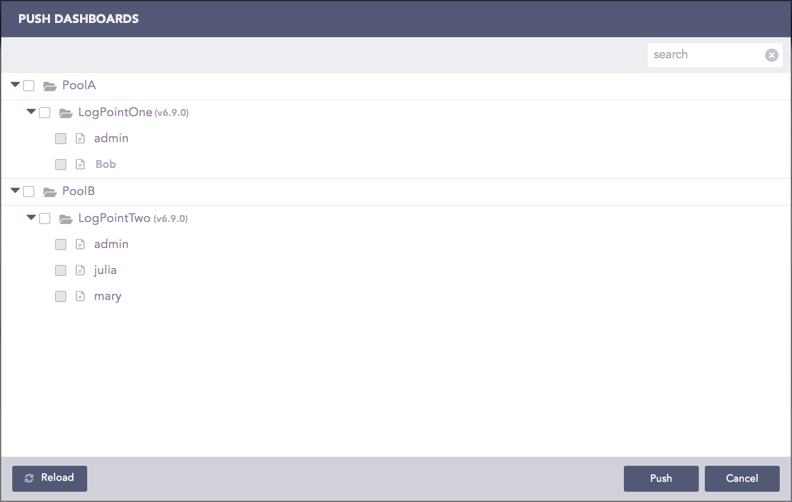
Select the dashboards and click Push.
Note
Make sure the selected dashboards are compatible with each other. Refer to the version compatibility table in the Dashboard section.
Select the pool, LogPoint, and user where you want to push the selected dashboards.
Note
Make sure the selected dashboards are compatible with each other. Refer to the version compatibility table in the Dashboard section.
Click Push.
Push History
You can click the Push History ( ) button to check the push history.
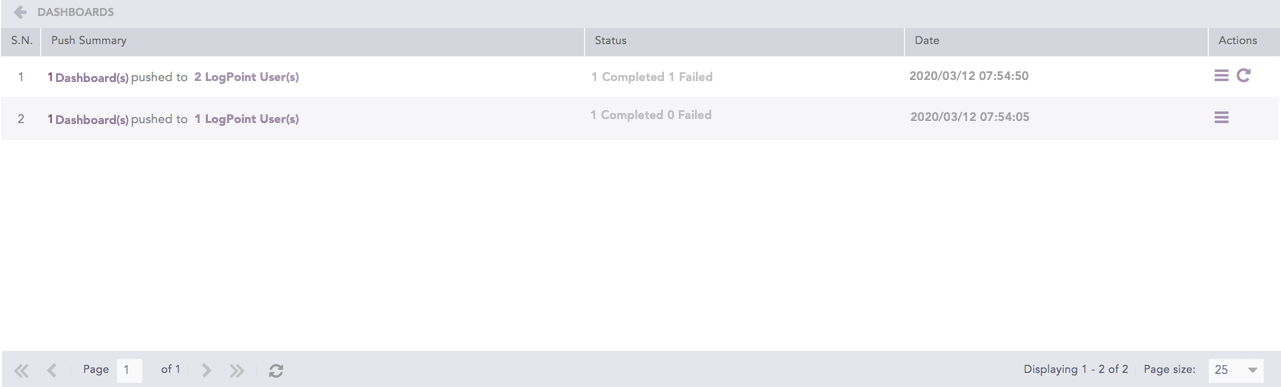
The Push History page lists the Push Summary, Status, Date, and Actions of all push attempts.
Click the Retry ( ) icon from the Actions column to retry the failed push attempt.
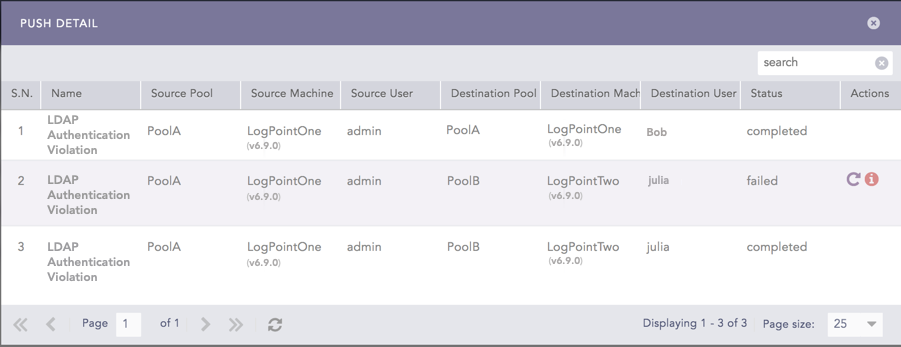
Click the Details ( ) icon from the Actions column to open the Push Detail page.
Note
For failed push attempts:
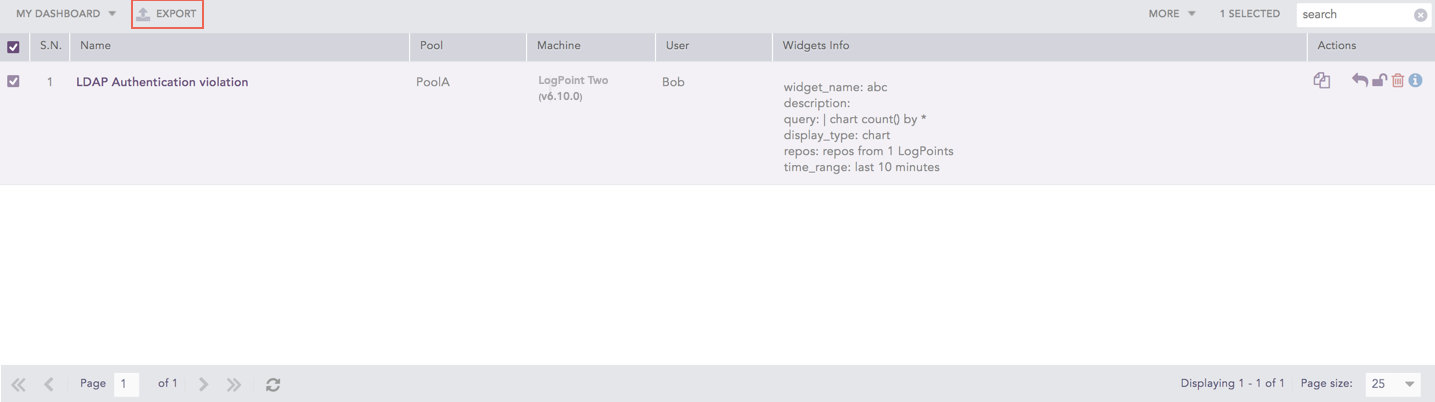
Exporting Dashboards
Go to Settings >> LogPoint Configuration >> Dashboards.
Select the dashboards and click Export.
The .pak file of the selected dashboards is downloaded to your local machine.
Note
Once you download the .pak file to your local machine, you can upload it to any other Fabric-enabled LogPoint from the Analytics Packages section.
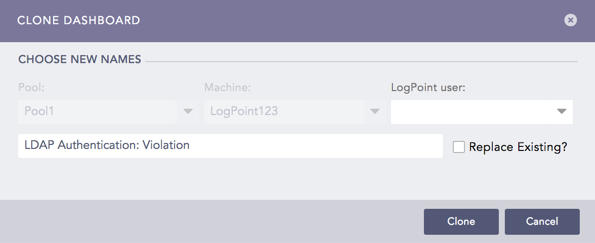
Cloning Dashboards
Go to Settings >> LogPoint Configuration >> Dashboards.
Click the Clone ( ) icon from the Actions column of the dashboard.
Select the LogPoint user from the drop-down menu. The Pool and the Machine cannot be changed.
Enter a Name for the cloned dashboard.
Check the Replace Existing? checkbox to replace the existing dashboard with the same name.
Click Clone.
Activating Dashboards
Note
A dashboard created by the LPSM on behalf of the Fabric-enabled LogPoint is automatically activated. However, when the dashboard is deleted from the Fabric-enabled LogPoint, it can be activated again from the LPSM.
Go to Settings >> LogPoint Configuration >> Dashboards.
Click the Activate ( ) icon from the Actions column for the concerned dashboard.
Note
You can Deactivate dashboards using the same method.
Locking Dashboards
Go to Settings >> LogPoint Configuration >> Dashboards.
Click the Lock ( ) icon from the Actions column of the dashboard.
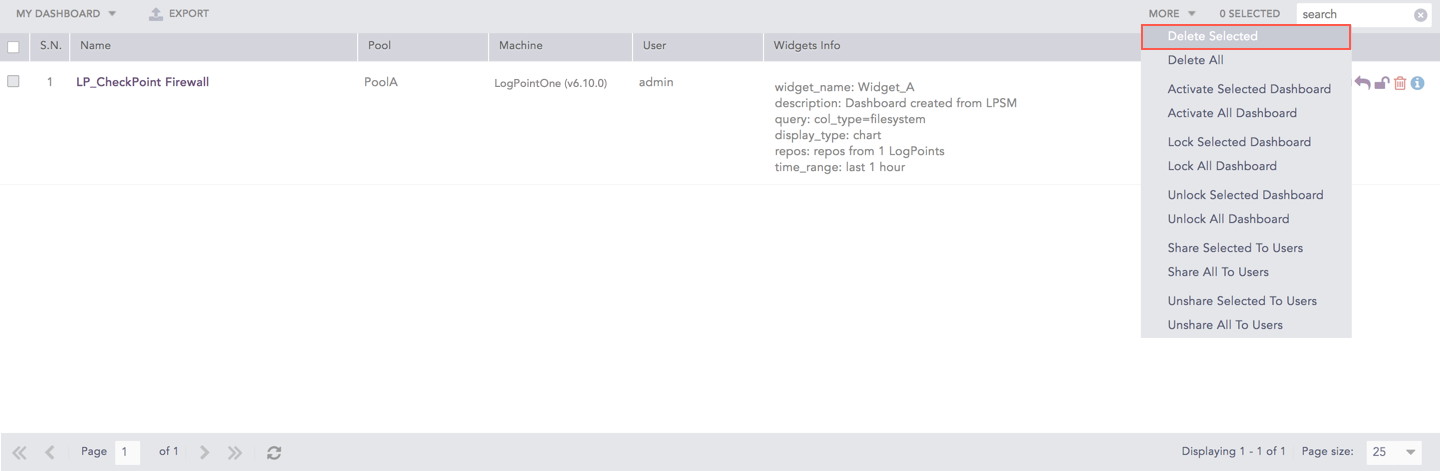
Deleting Dashboards
Go to Settings >> LogPoint Configuration >> Dashboards.
Click the Delete ( ) icon from the Actions column for the dashboard.
To delete multiple dashboards, select the concerned dashboards. Click the More drop-down and choose Delete Selected.
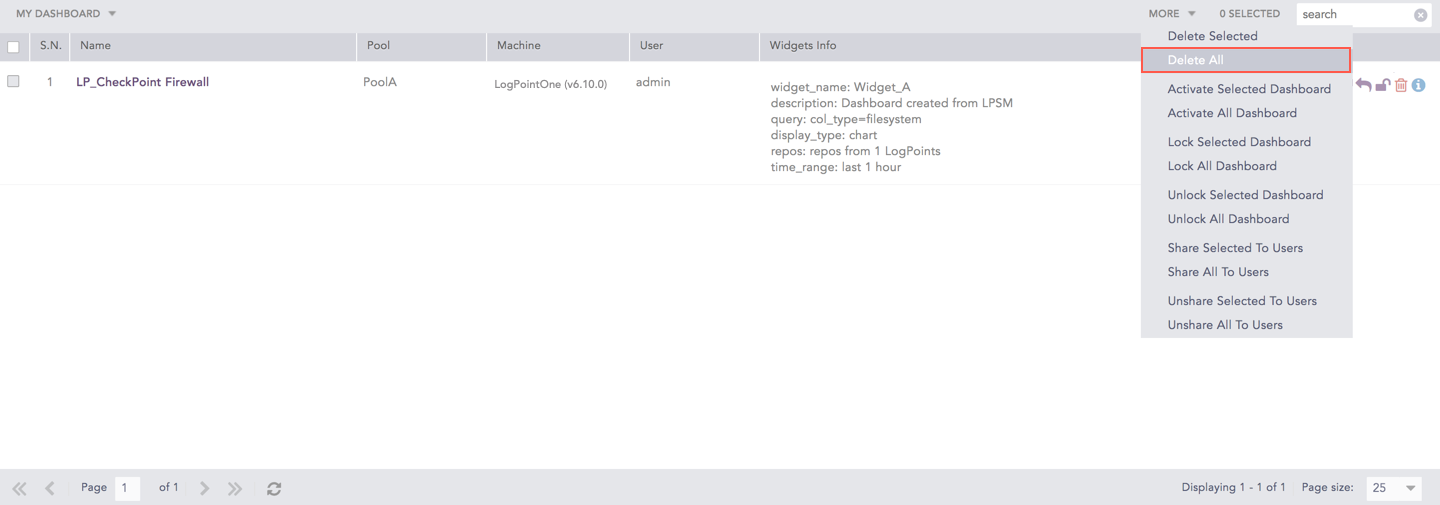
To delete all the dashboards, click the More drop-down and choose Delete All.
Click Yes.
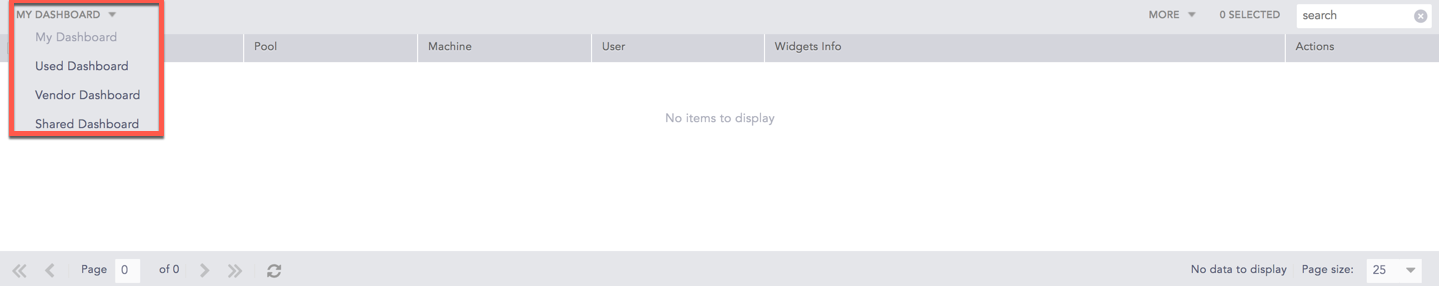
Category of Dashboard
There are four categories of dashboards: My Dashboard, Used Dashboard, Vendor Dashboard, and Shared Dashboard. They can be accessed from the drop-down at the top-left corner of the panel.
My Dashboard
Lists all the dashboards created by LPSM on behalf of Fabric-enabled LogPoints and all the dashboards created by the Fabric-enabled LogPoint.
Used Dashboard
Lists all the used dashboards.
Vendor Dashboard
Lists all the dashboards provided in your application packages.
Shared Dashboard
Lists all the shared dashboards.
Note
You can click the Clone () icon from the Actions column to use the shared and vendor dashboards. Provide a name for the clone and hit enter. The dashboard is activated, and the clone appears under the My Dashboard option.
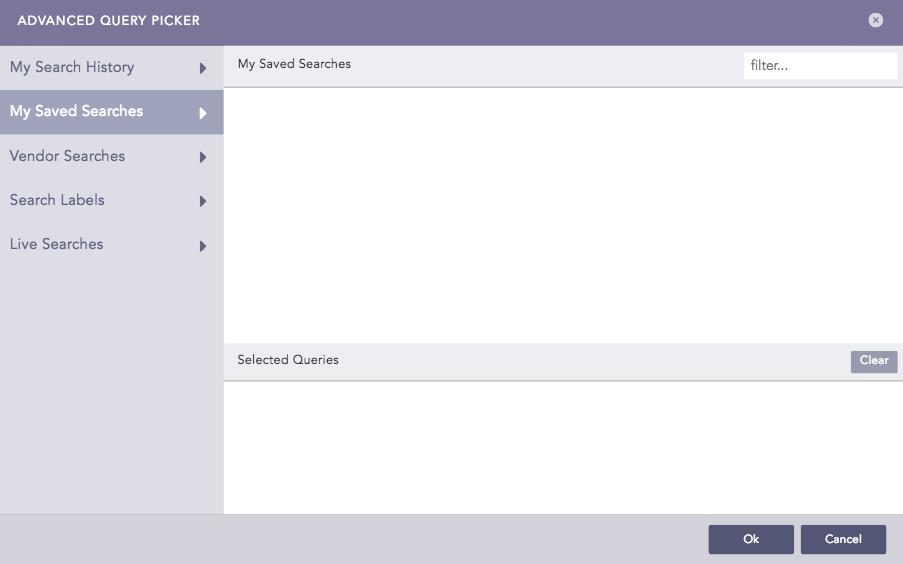
Subscribing Dashboards
The dashboards of the Fabric-enabled LogPoints have to be subscribed to view and edit their data.
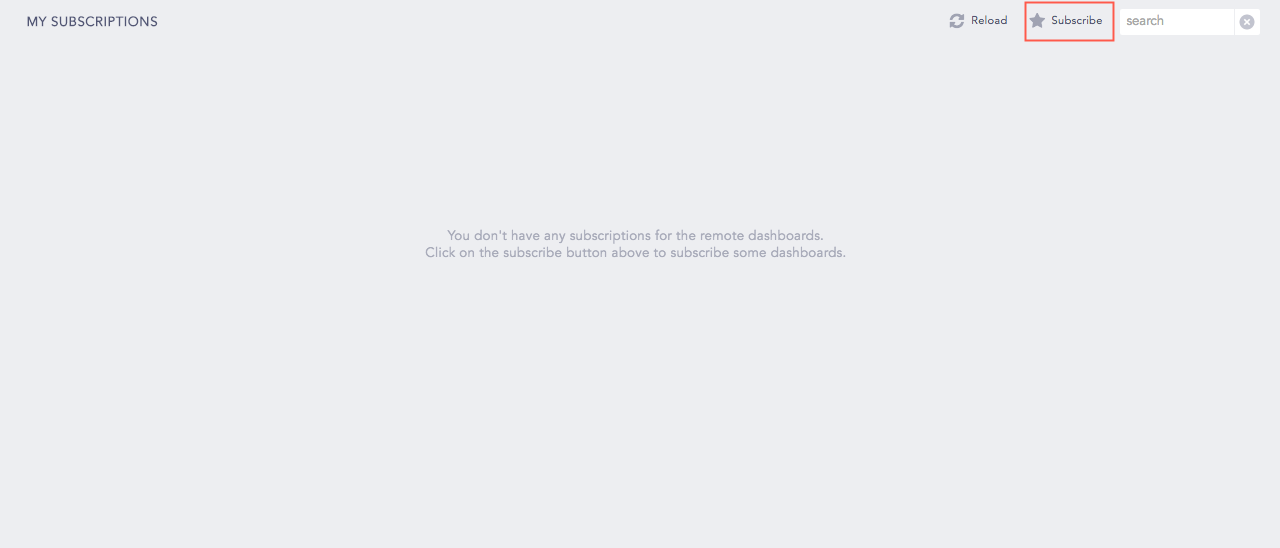
Go to Dashboard from the navigation menu.
Click Subscribe
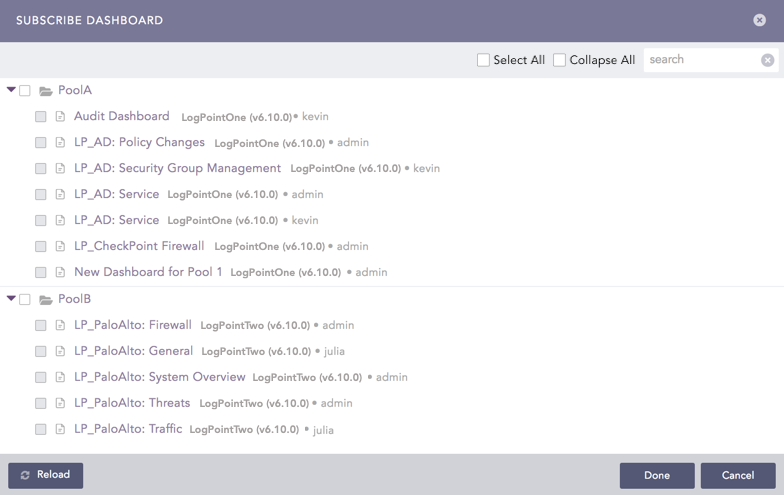
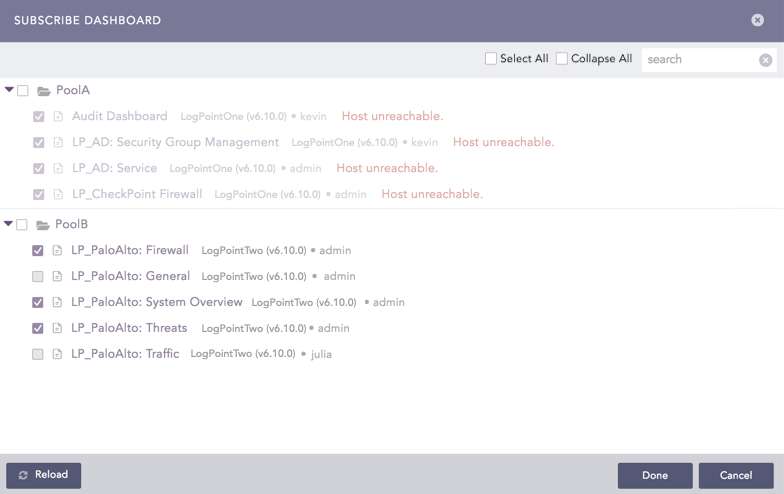
The pop-up panel lists all the dashboards of the Fabric-enabled LogPoints, categorizing them on the basis of the LogPoint Pool. The panel also includes the names of various Fabric-enabled LogPoints and the users who created the dashboards.
Click Reload to view the latest configuration and changes made in the dashboards of the Fabric-enabled LogPoints.
Select the dashboards from the Fabric-enabled LogPoint Pools.
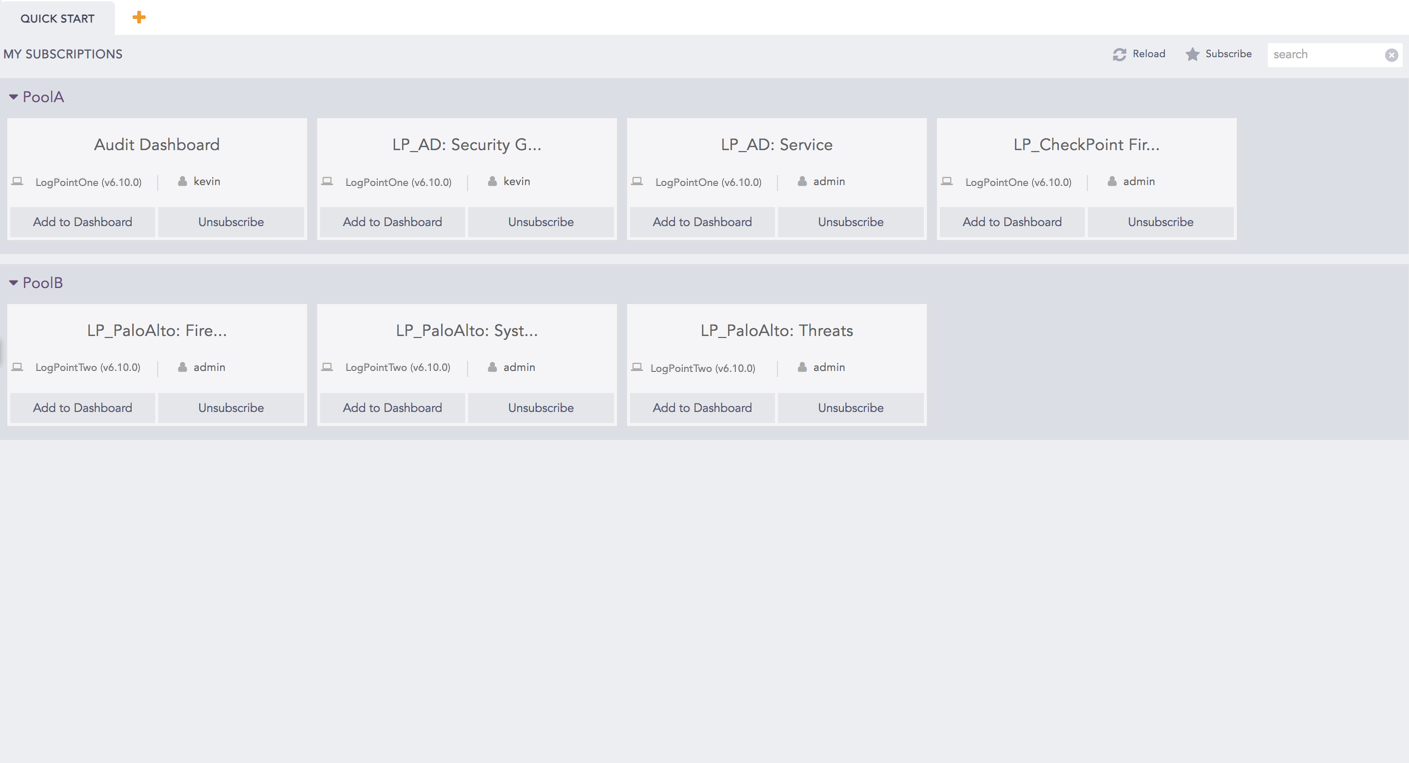
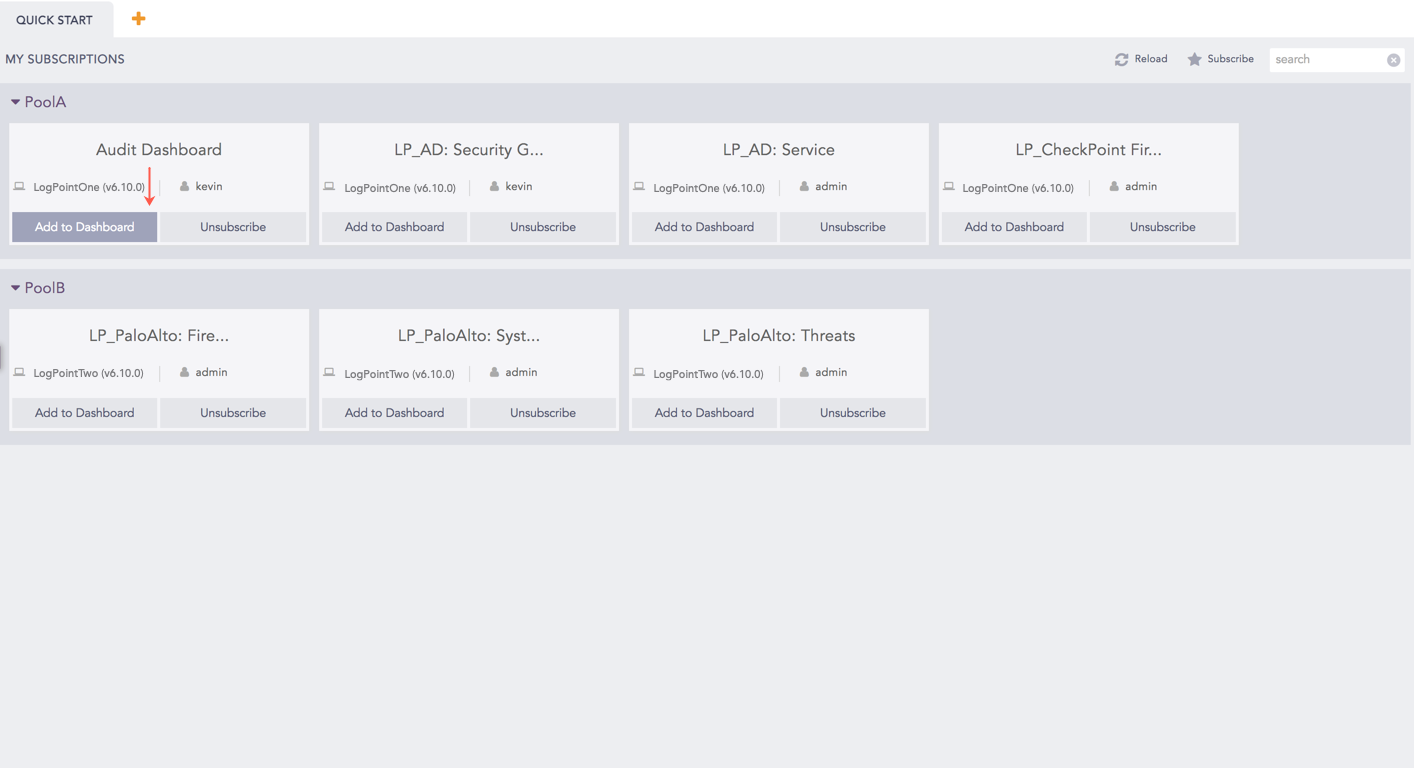
Click Save. The subscribed dashboards from the selected pools are populated under the Quick Start tab.
Click the Add To Dashboard button of the corresponding subscribed dashboard to display it in a new tab.
The subscribed dashboard tab can hold multiple widgets. Each widget within a dashboard displays data in graphical forms such as charts, lists, and tables. If needed, you can change the width, height, and positioning of the widget. The data in the widgets are updated in real time.
Note
If a pool is selected while subscribing dashboards, the new dashboards added in the Fabric-enabled LogPoints of that pool are subscribed automatically.
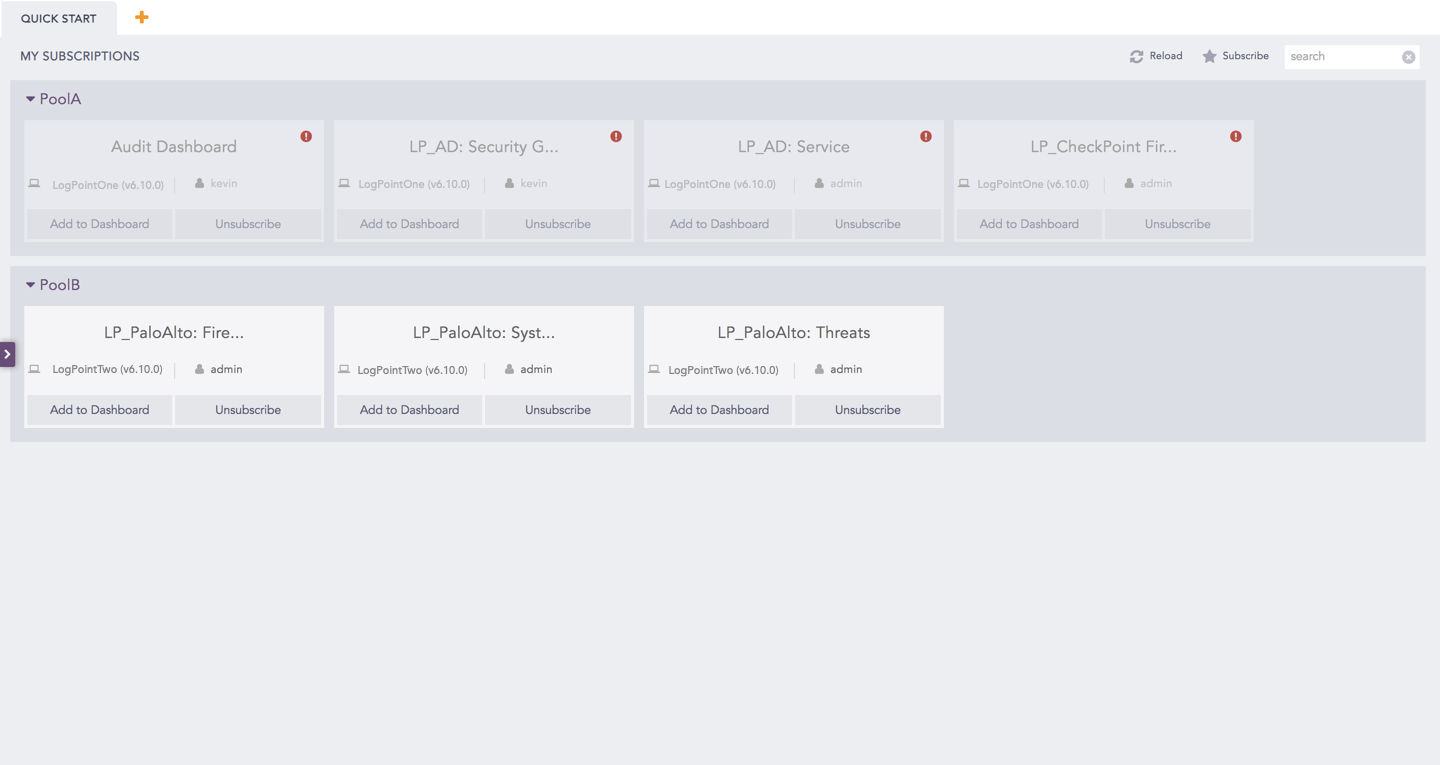
If any of the Fabric-enabled LogPoints is down or unreachable, their corresponding subscribed dashboards are grayed out as shown below:
When one of the Fabric-enabled LogPoints is down, its corresponding dashboard cannot be selected or unselected individually. However, when a pool is selected (or unselected), all the subscribed dashboards get selected (or unselected) irrespective of any Fabric-enabled LogPoints being down or unreachable.
Unsubscribing Dashboards
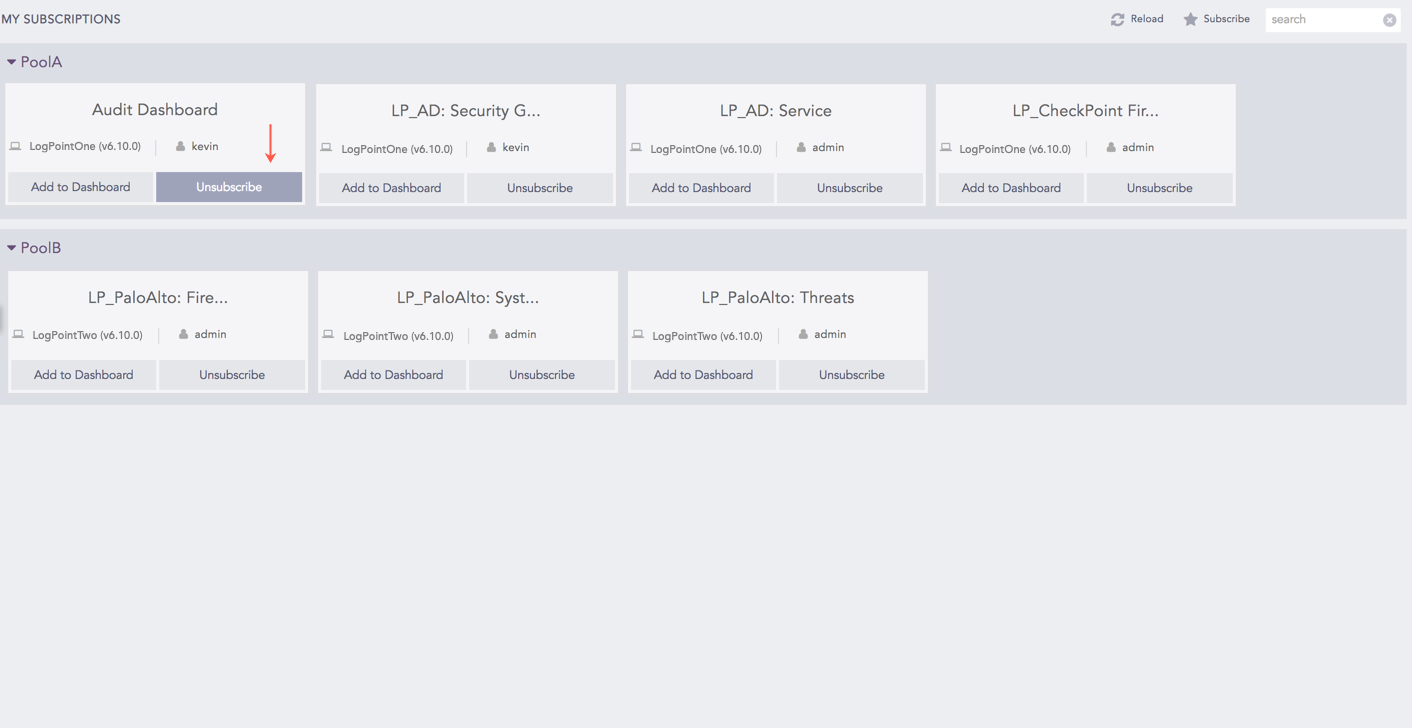
Go to Dashboard from the navigation menu.
Click the Unsubscribe button of the dashboard.
Click the Subscribe button to open the Subscribe Dashboard pop-up panel to unsubscribe dashboards in bulk. You can now deselect the concerned dashboards to unsubscribe them.

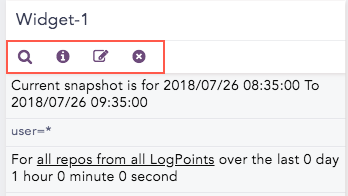
 ) icon to edit the widget.
 ) icon to remove the widget.