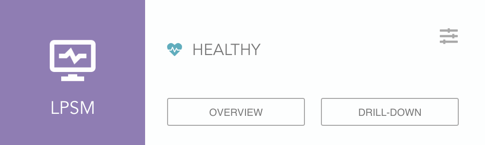
LPSM Widget
From the LPSM widget, you can:
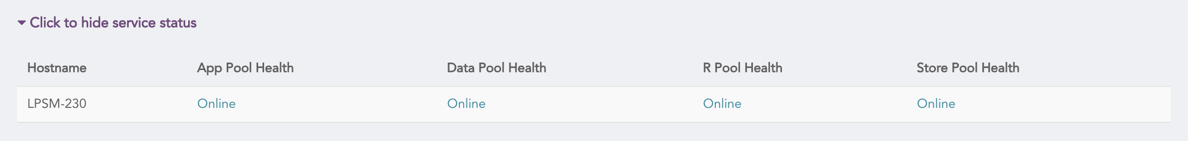
Monitor the overall health status for the LPSM.
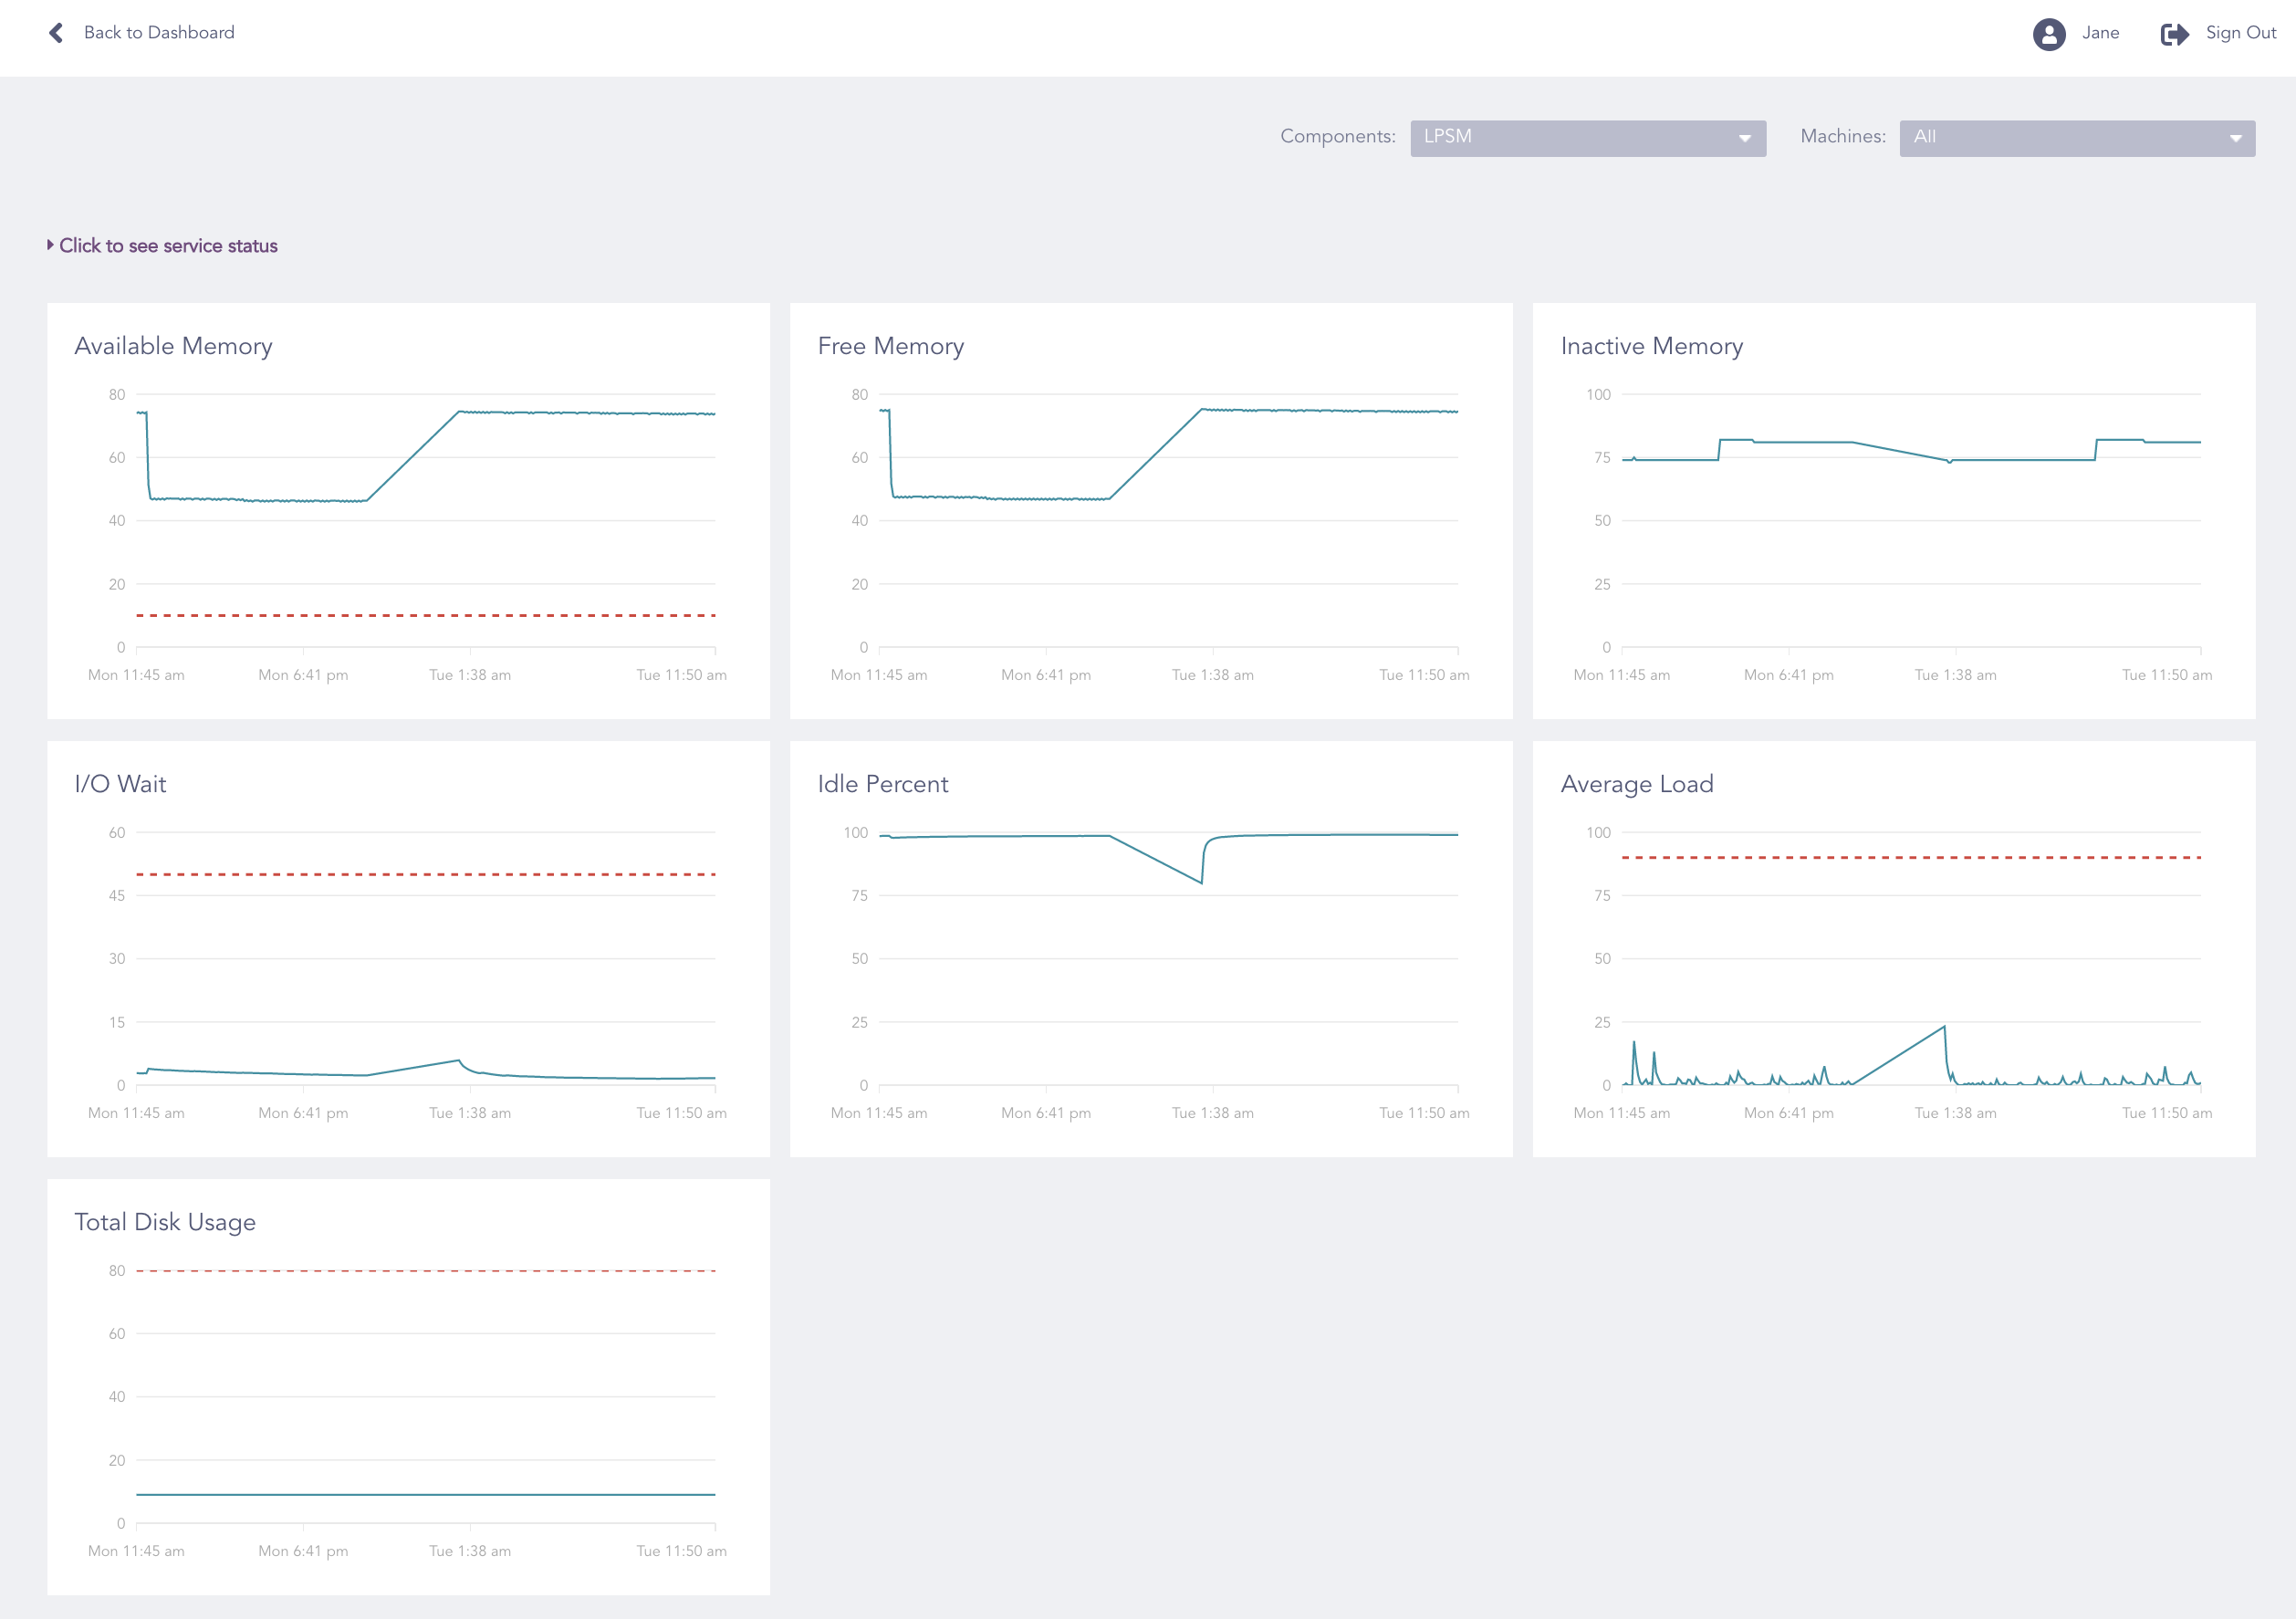
View the detailed health status for each parameter.
Configure the LPSM parameters to define their health status.
The parameters available in the LPSM widget are:
LPSM Parameter |
Description |
|---|---|
App Pool Health |
Shows whether the health of the partition that contains the application is online or not. |
Data Pool Health |
Shows whether the health of the partition that contains the application logs and Fabric Storage is online or not. |
R Pool Health |
Shows whether the health of the partition that contains the Operating System is online or not. |
Store Pool Health |
Shows whether the health of the partition that contains the plugins is online or not. |
Free Memory |
Shows the available memory (in megabytes) after allocating the memory to all the available processes. |
I/O Wait |
Shows the time (in milliseconds) for which the CPU is idle while waiting for an I/O operation to complete. |
Idle Percent |
Shows the CPU percentage that is unused for a particular time-frame. |
Inactive Memory |
Shows the total memory allocated to the processes that are no longer running. |
Average Load |
Shows the average value of the CPU load over the last five minutes. Only an entirely idle CPU has an average load of zero. |
Total Disk Usage |
Shows the total percentage of the disk used in the system. |
Warning
If the status of the App Pool Health, the Data Pool Health, or the R Pool Health parameters is not online, contact the LogPoint Support team.
Go to Dashboard.
Click Overview in the LPSM widget.
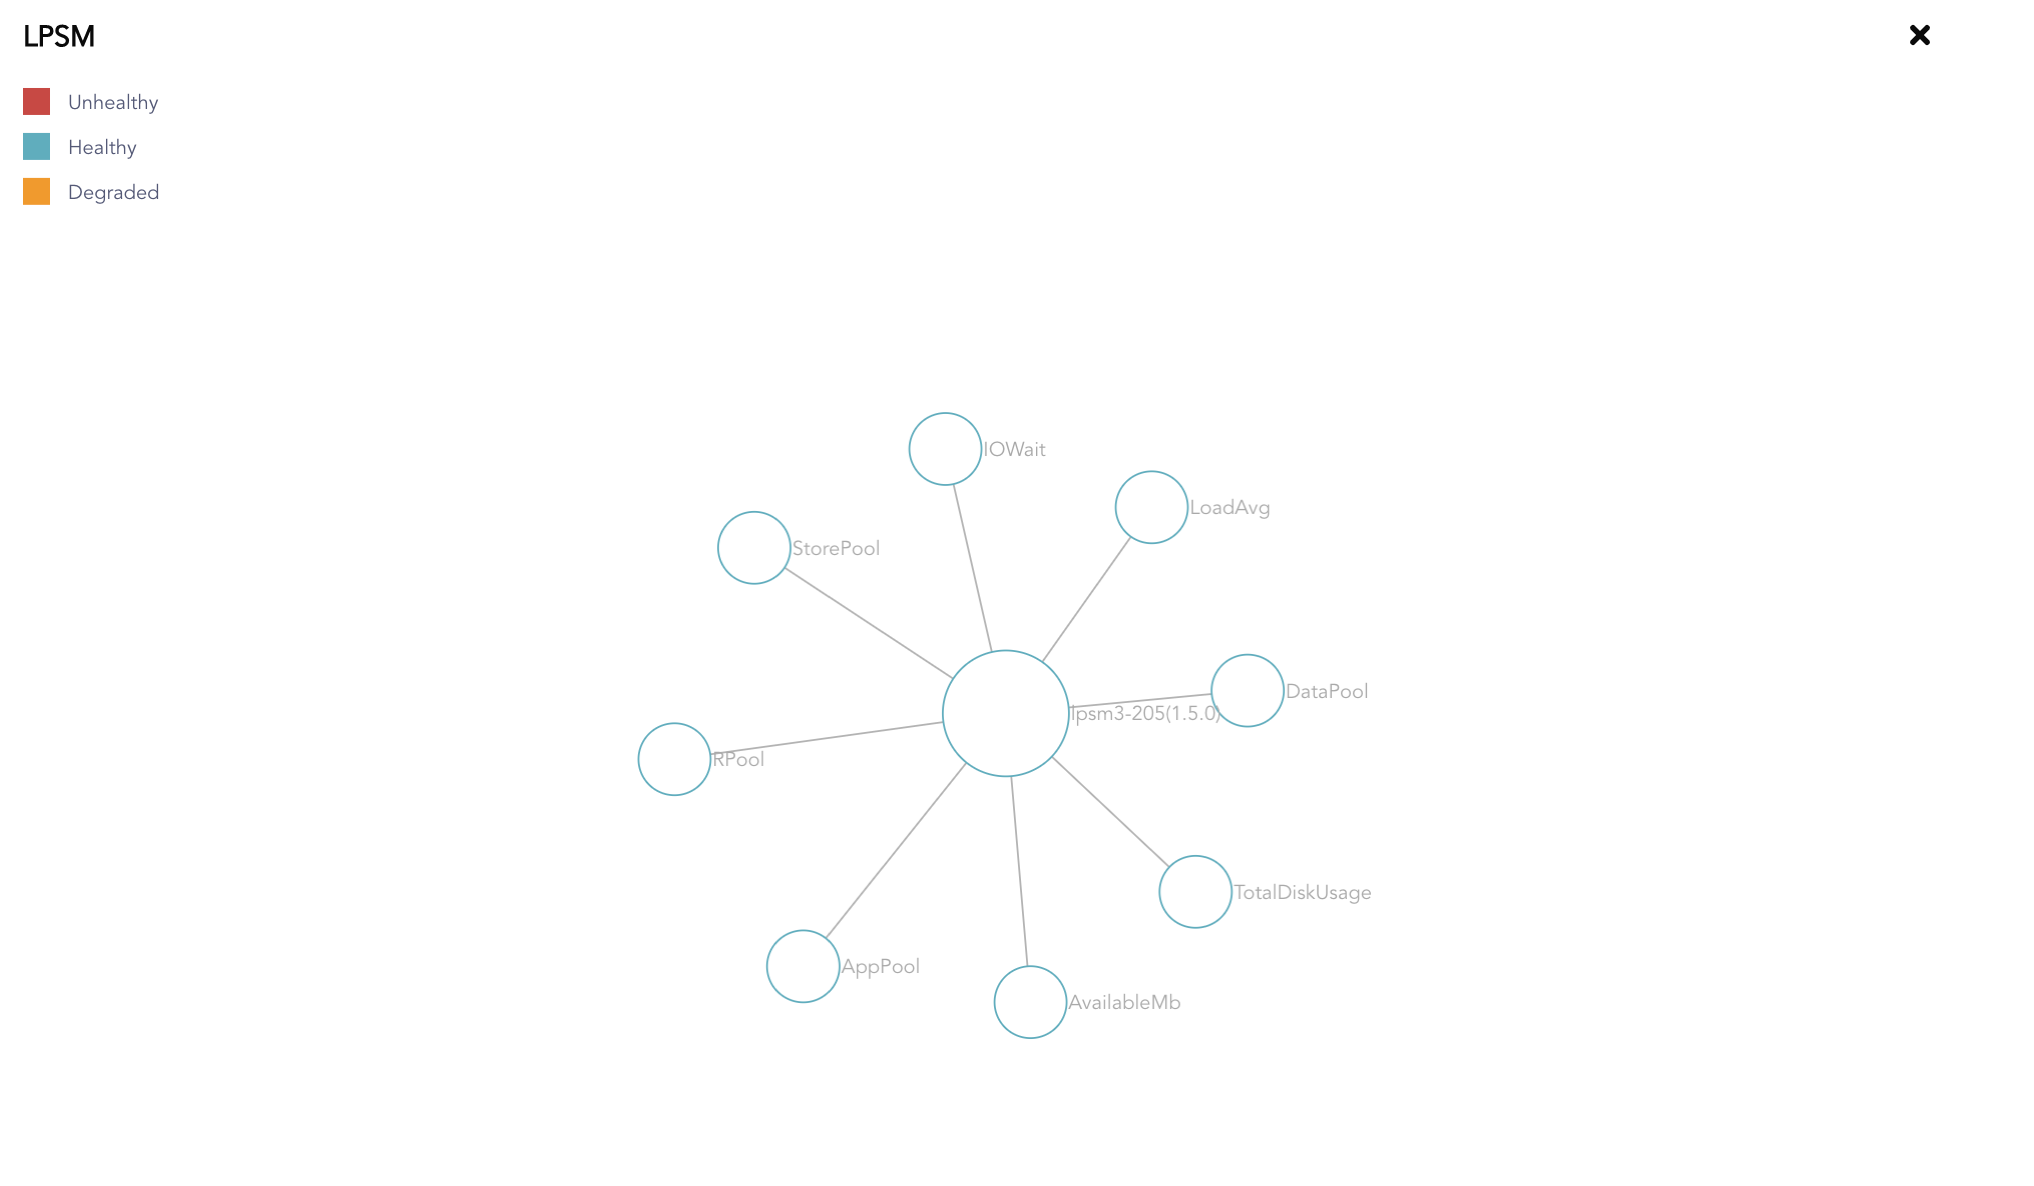
LPSM Overview
The Network Graph represents the LPSM and its eight parameters.
Go to Dashboard.
Click the Configure ( ) icon in the LPSM widget.
Configure LPSM Icon
Enter the Duration and the Threshold values, and change the direction of each parameter as required.
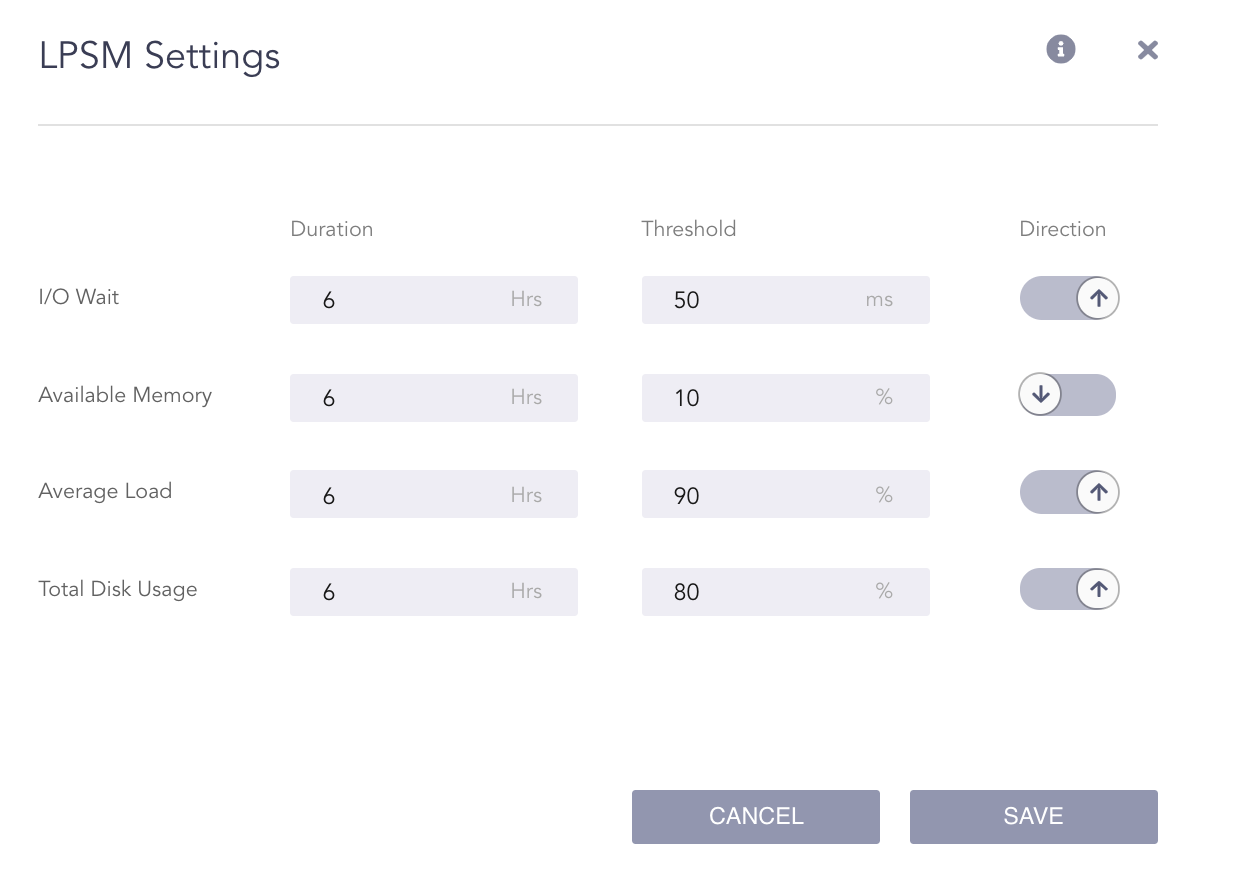
Configure LPSM Settings
In the screenshot above, the I/O Wait of the LPSM becomes unhealthy:
if it is more than 50 ms on average over the last 6 hours or
if it becomes more than 50 ms at any point of time over the last 6 hours.
Similarly, the Available Memory of the LPSM becomes unhealthy:
if it is less than 10% on average over the last 6 hours or
if it becomes less than 10% at any point of time over the last 6 hours.
Click Save.