Cmdr-admin users can monitor the performance of the Fabric Server and API Server applications and their components. using the system-monitor command.
You can execute system-monitor command in the Fabric Server to monitor the performance of the Fabric Server and their components.
Monitoring in Fabric Server
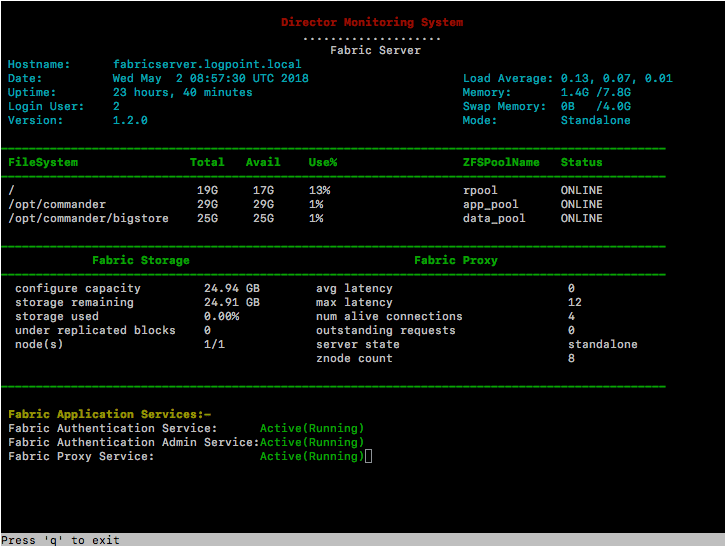
The System Monitoring section displays the current status of the different components of the system.
System Monitoring in Fabric Server
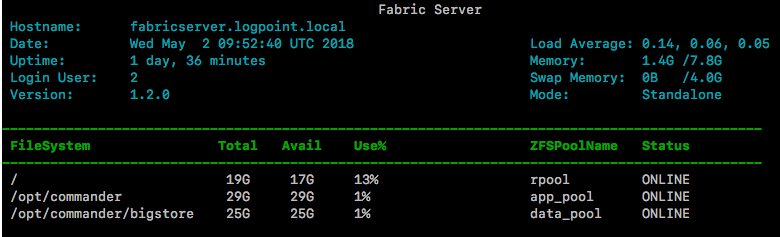
Hostname: Displays the hostname of the Fabric Server.
Date: Displays the current date and time of the system.
Uptime: Displays the current uptime of the system.
Login User: Displays the number of users logged into the Fabric Server.
Version: Displays the current version of the Fabric Server.
Load Average: Displays the CPU load average of the system.
Memory: Displays the currently used and total physical memory of the system.
Swap Memory: Displays the currently used and total swap memory of the system.
Mode: Displays the installation mode of the Fabric Server.
File System: Displays the total, available, and used percentage of the file system.
ZFSPool Name and Status: Displays the list of ZFS Pool(s) configured and their current status.
The Fabric Server Applications Monitoring section displays the current status of Fabric Server applications.
Fabric Server Applications Monitoring
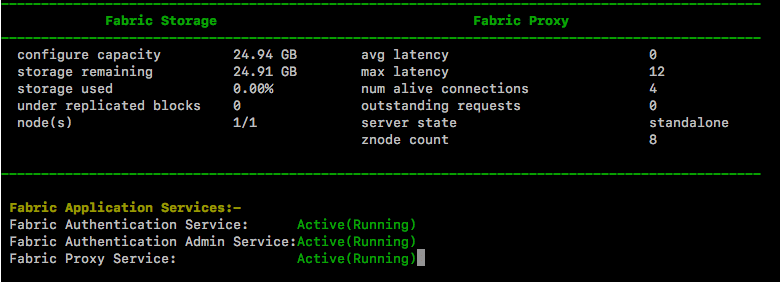
You can monitor the following components of Fabric Storage from the Fabric Server:
configure capacity: Displays the total capacity configured during the installation of the Fabric Storage.
storage remaining: Displays the remaining storage capacity of the Fabric Storage.
storage used: Displays the used storage capacity of the Fabric Storage in percentage.
under replicated blocks: Displays the number of under-replicated blocks in a cluster environment.
node(s): Displays the number of active and total storage nodes available in the Fabric Storage.
You can monitor the following components of Fabric Proxy from the Fabric Server:
avg latency: Displays the average idle time of the Fabric Proxy.
max latency: Displays the maximum idle time of the Fabric Proxy.
num live connections: Displays the number of active client connections in the Fabric Proxy.
outstanding requests: Displays the number of outstanding connection requests in the Fabric Proxy.
server state: Displays the state of the Fabric Proxy.
znode count: Displays the total number of nodes in the Fabric Proxy.
You can monitor the following components of Fabric Application Services from the Fabric Server:
Fabric Authentication Service: Displays the current status of the Fabric Authentication.
Fabric Authentication Admin Service: Displays the current status of the Fabric Authentication admin.
Fabric Proxy Service: Displays the current status of the Fabric Proxy.
You can execute system-monitor command in the API Server to monitor the performance of the API Server and their components.
Monitoring in API Server
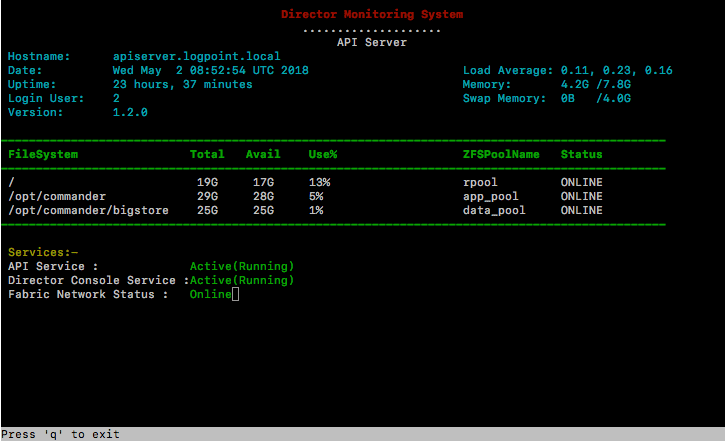
The System Monitoring section displays the current status of the different components of the system.
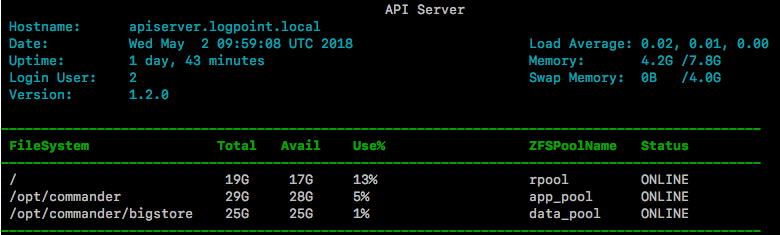
System Monitoring in API Server
Hostname: Displays the hostname of the API Server.
Date: Displays the current date and time of the system.
Uptime: Displays the current uptime of the system.
Login User: Displays the number of users logged into the API Server.
Version: Displays the current version of the API Server.
Load Average: Displays the CPU load average of the system.
Memory: Displays the currently used and total physical memory of the system.
Swap Memory: Displays the currently used and the total swap memory of the system.
FileSystem: Displays the total, available, and used percentage of the file system.
ZPool Name and Status: Displays the list of ZFS Pool(s) configured and their current status.
The API Server Applications Monitoring section displays the current status of API Server applications.
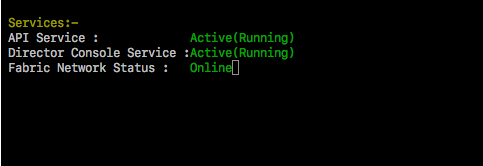
API Server Applications Monitoring
API Service: Displays the current status of the API Server.
Director Console Service: Displays the current status of the Director Console UI.
Fabric Network Status: Displays the current status of the Fabric Network.