The search result also has a tool bar that gives you an easy access to the various functions right after search.

Search Tools
This is the total number of results found for the search query. LogPoint searches results in an incremental basis, so this number keeps getting updated until all the results have been fetched.
In the Search Query bar, if you click the down arrow key, a pop-up panel appears. It contains texts to help you write valid search queries. An alternative way to access this feature is to click CMD + right click (on a Mac) and CTRL+ right click (on a Windows Machine). You can conduct a search query while simultaneously looking at the search help-text window.
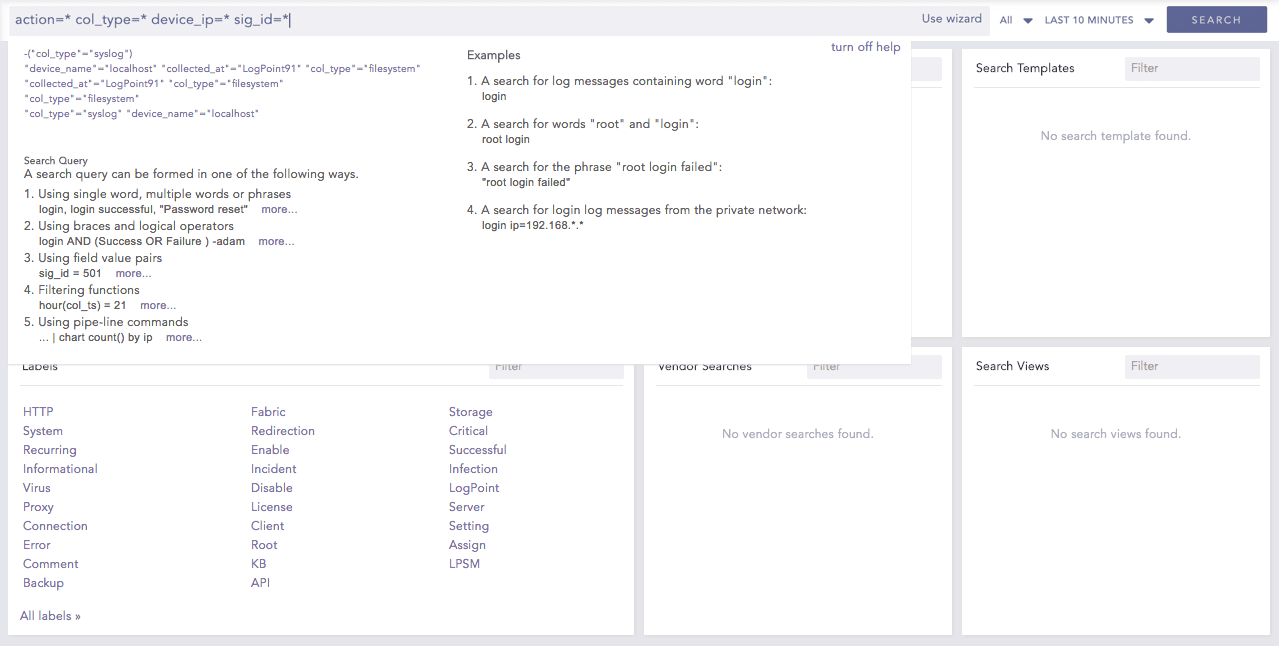
Search Help Text
Note
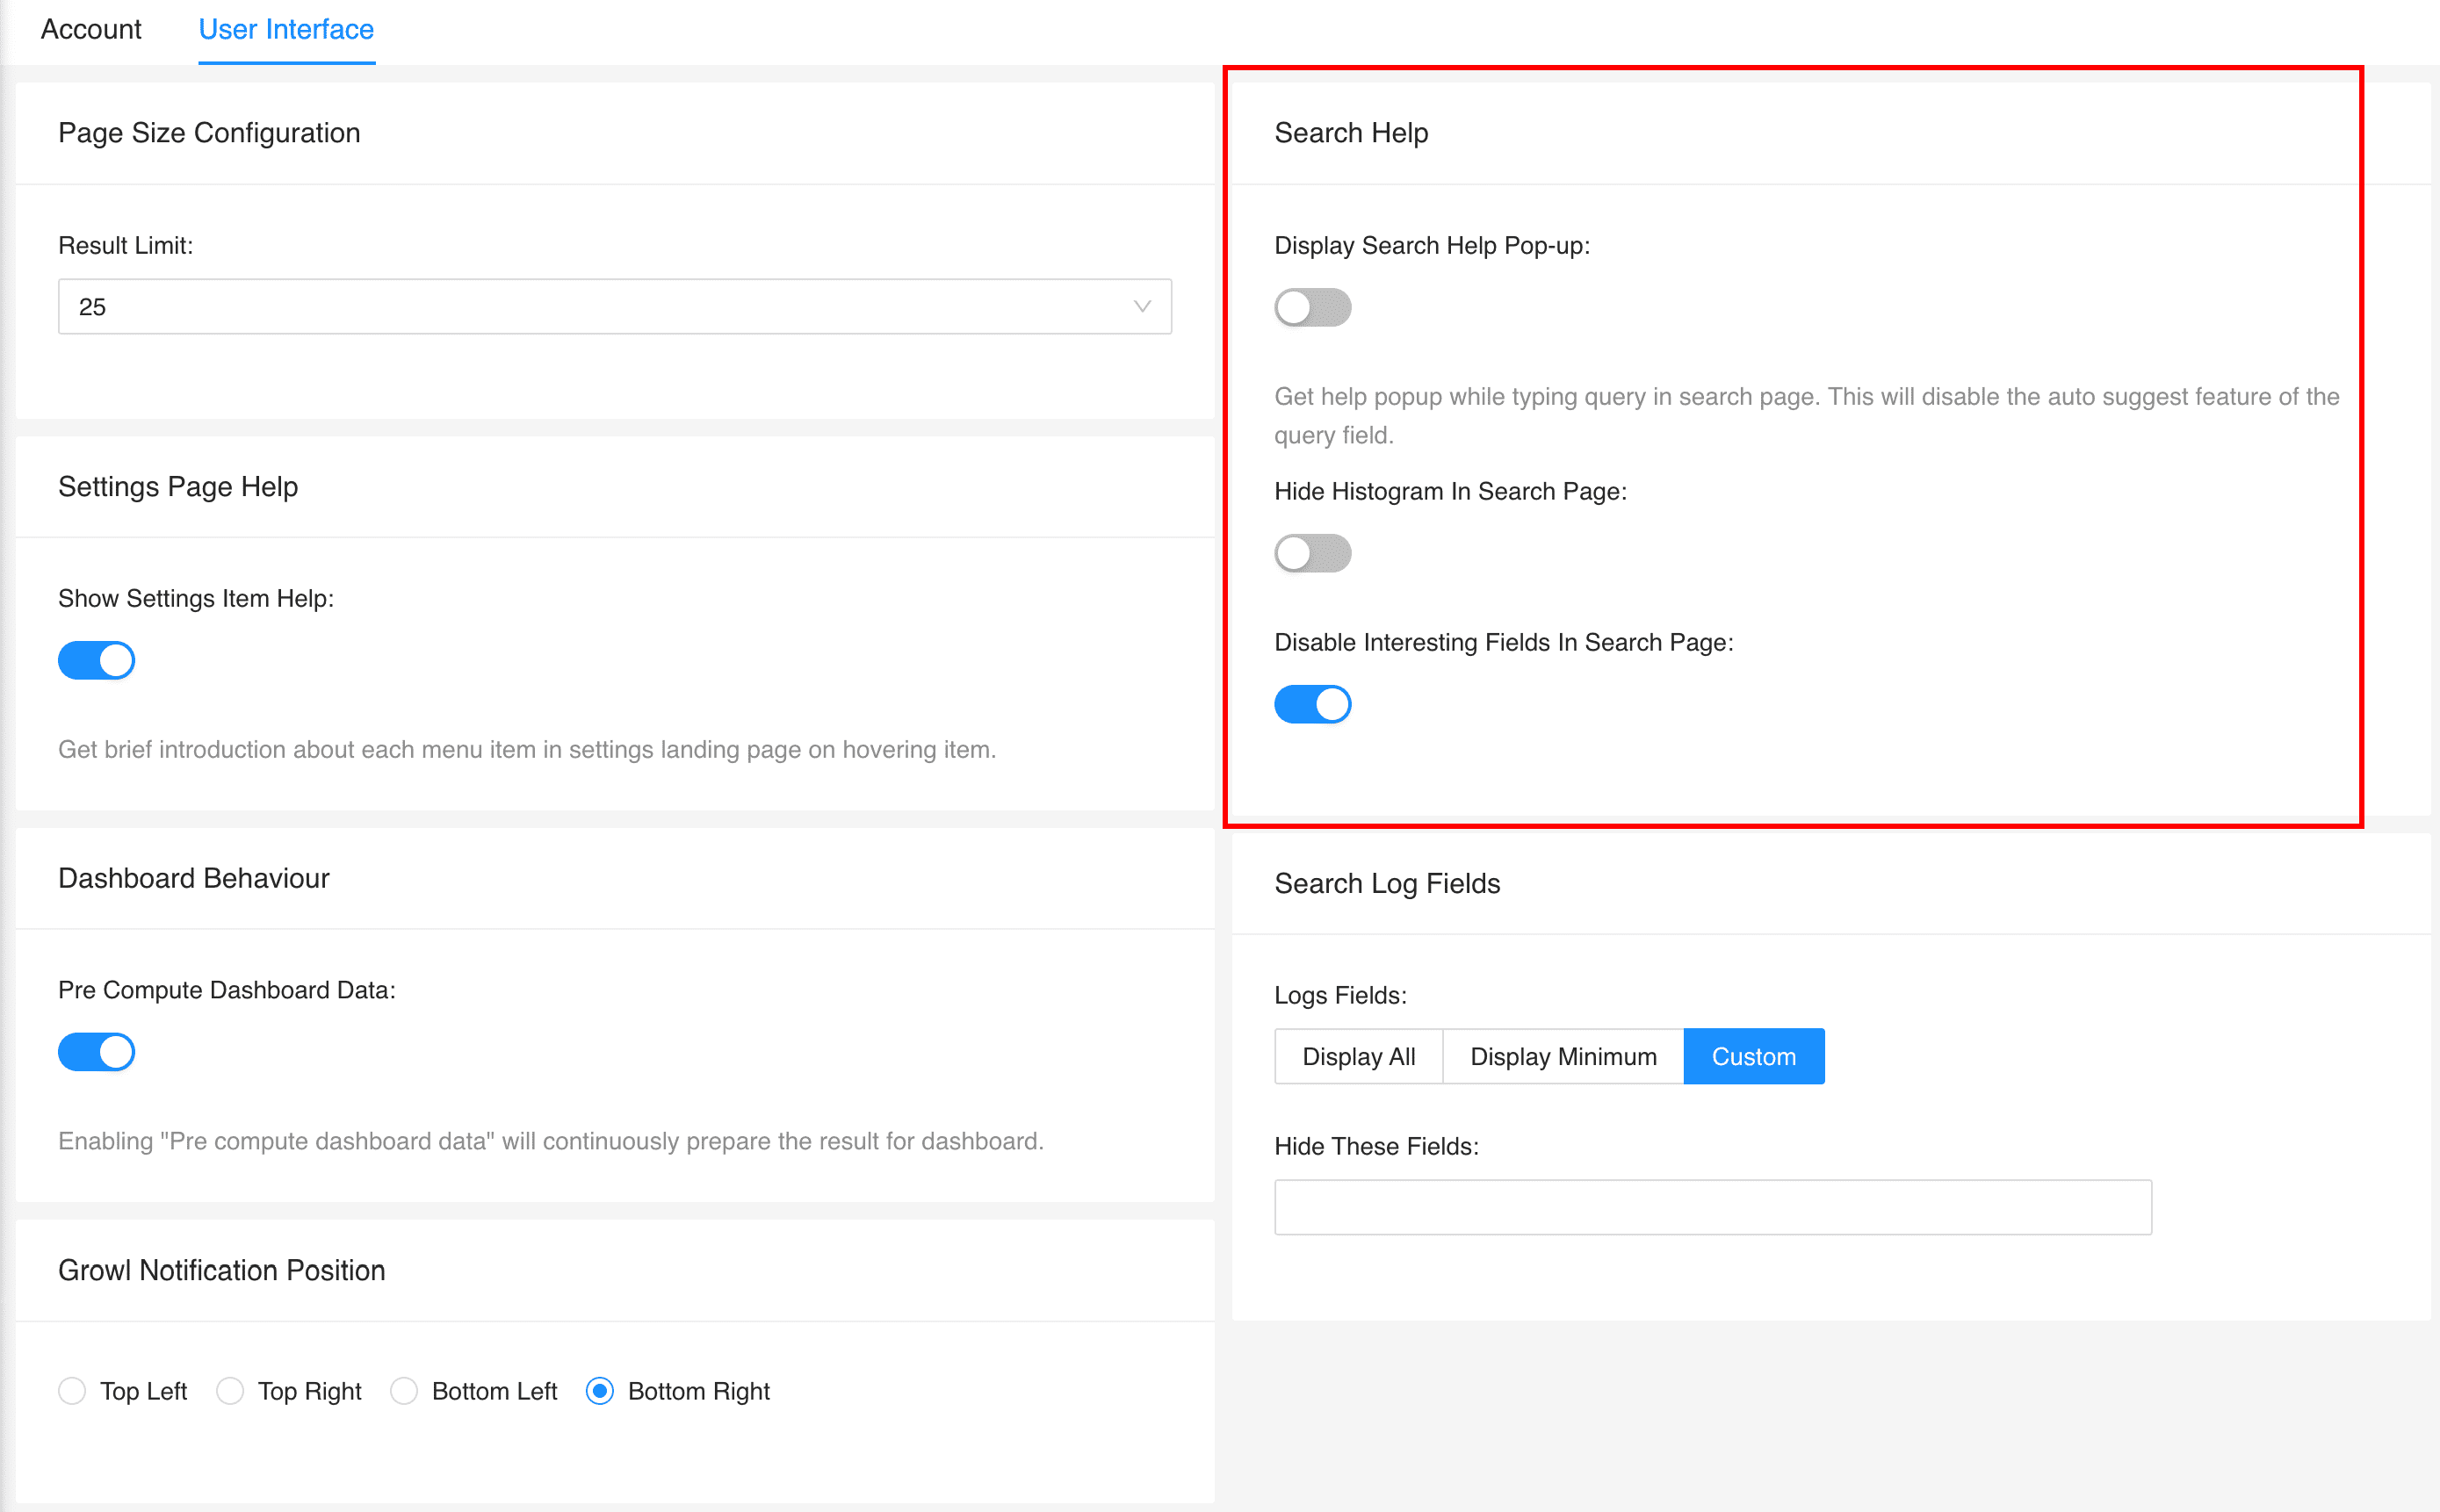
The search help text is not displayed if you have disabled the Display search help pop-up in My Preferences >> Search. For details, refer to My Preferences.
Search Help Text
The Add Search To option lets you work on or view the results of any search query by forwarding them to various places.
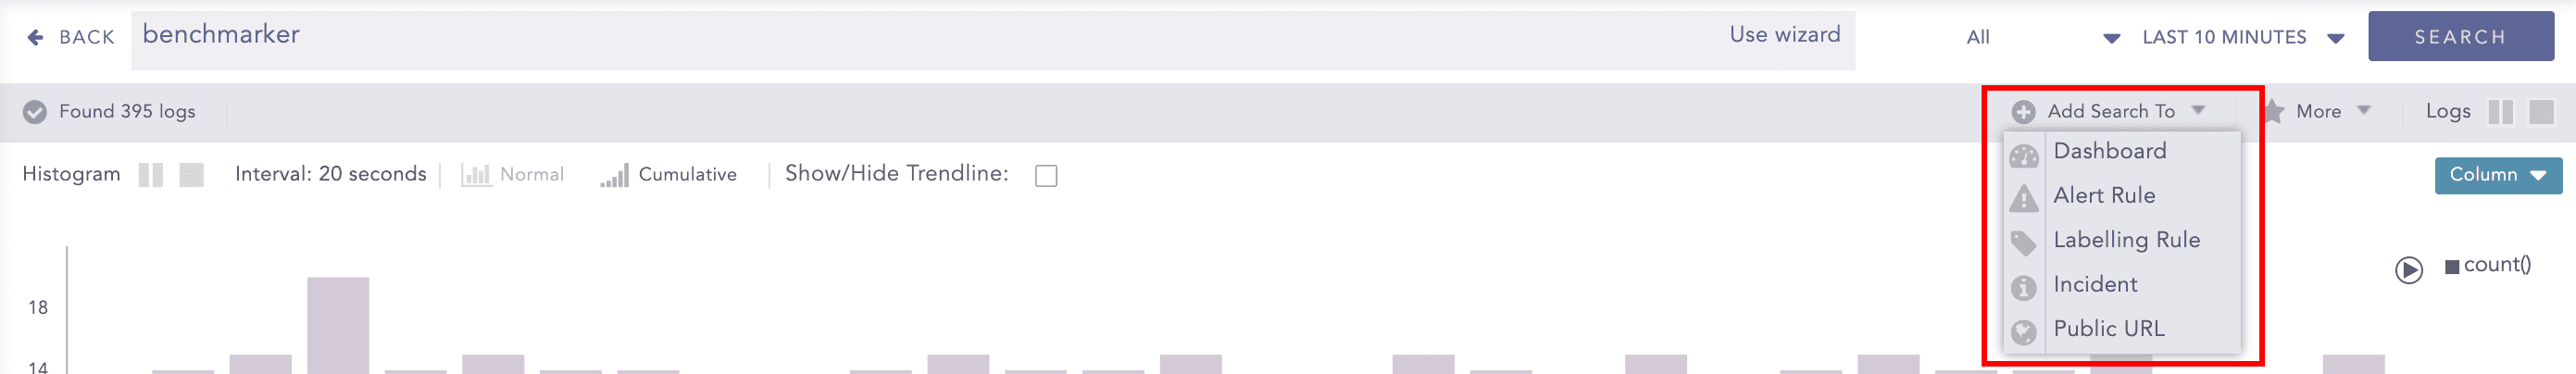
Add Search To
These places are described below:
The Add Search To Dashboard option lets you create a dashboard widget from a recent search query.
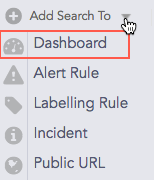
Click Dashboard to open the Create Widget panel.
Enter the details for the widget and click Next.
Select a Dashboard.
Click Finish.
Note
The display widgets such as bar graphs, donut charts, and tables automatically appear according to the nature of the result of the search query you enter.
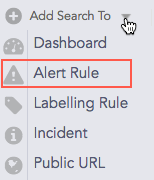
Click Alert Rule to open the Create Alert panel.
Provide the Name, the Description, the Repos, and the Time Range and click Next.
Select the Condition, the Risk, and the Risk Calculation Function and click Next.
Choose a medium for the alert notification.
Click Finish.
Refer to the Alerts section for details on creating and managing alert rules.
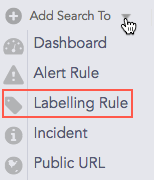
Click Labelling Rule to open the Search Label panel.
Select a Package and enter a List of Labels.
Click Submit.
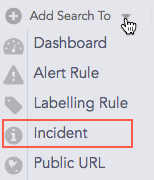
Click Incident to open the Create Search Incident panel.
Provide the Incident Name, the Description, and the Risk level.
Provide the necessary Ownership information.
Click Submit.
Refer to the Incidents section for details on creating, managing, and filtering incidents.
The Add Search to Public URL option lets you add and share Dashboard widgets publicly.
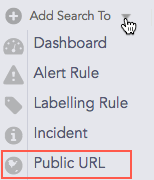
Click Public URL to open the Register to Public URL panel.
Specify a Name, an Identifier, and a Package to add your search to a public URL.
Click Ok.
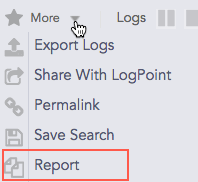
The More option lists all the functions that can be carried out for the result of a query.
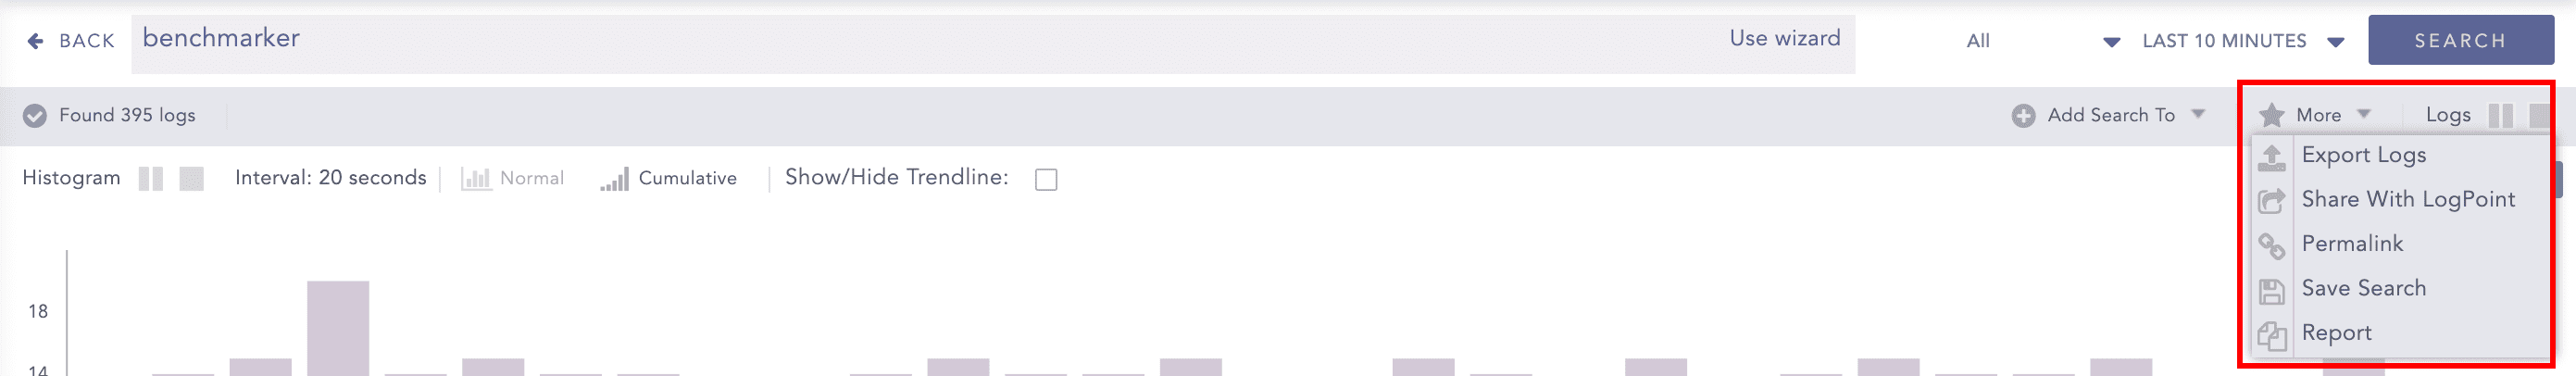
More
Export Logs lets you export the search results to the specified target on a remote machine. To export the logs of simple search queries, follow these steps:
Go to Search from the navigation bar.
Enter a Search Query in the query bar and click Search.
Click Export Logs.
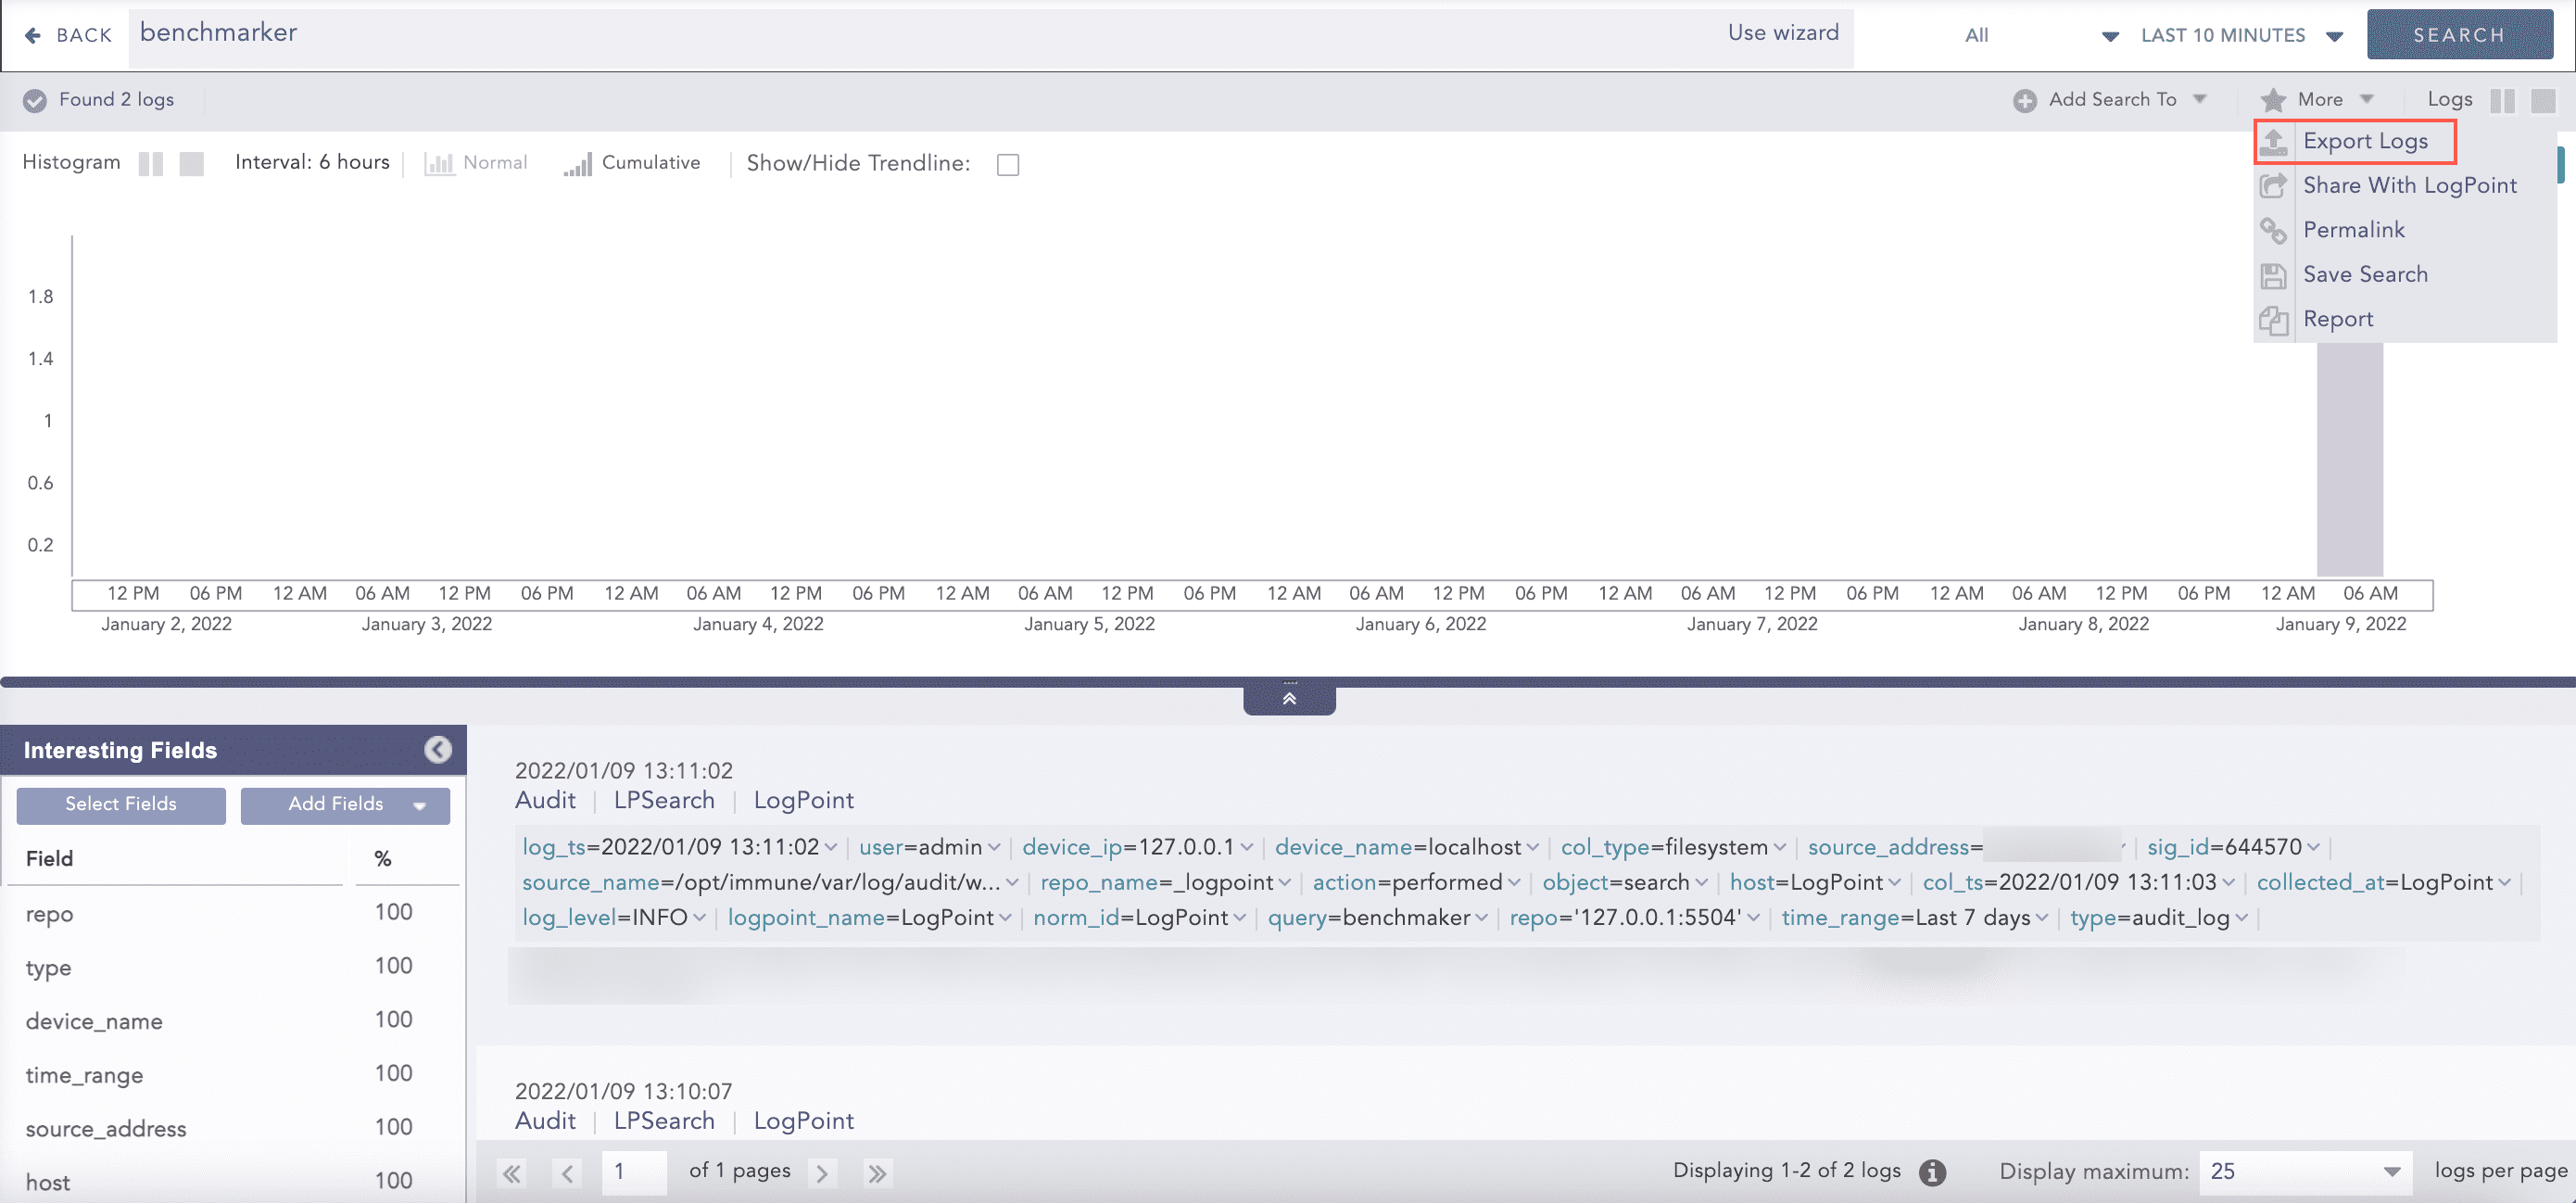
Export Logs
Specify the Job Name, the Timeout in seconds, the Target and the Max File Size.
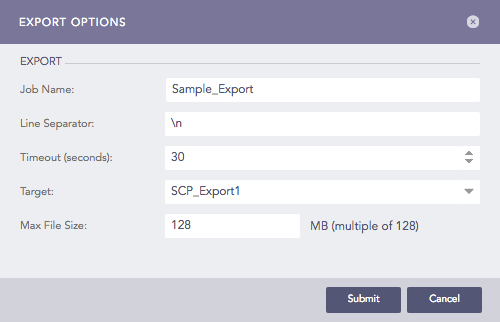
Export Options
Click Submit.
Note
The Export Logs feature can only be used for simple queries. For aggregated queries, use the Export as CSV and Export as Excel options.
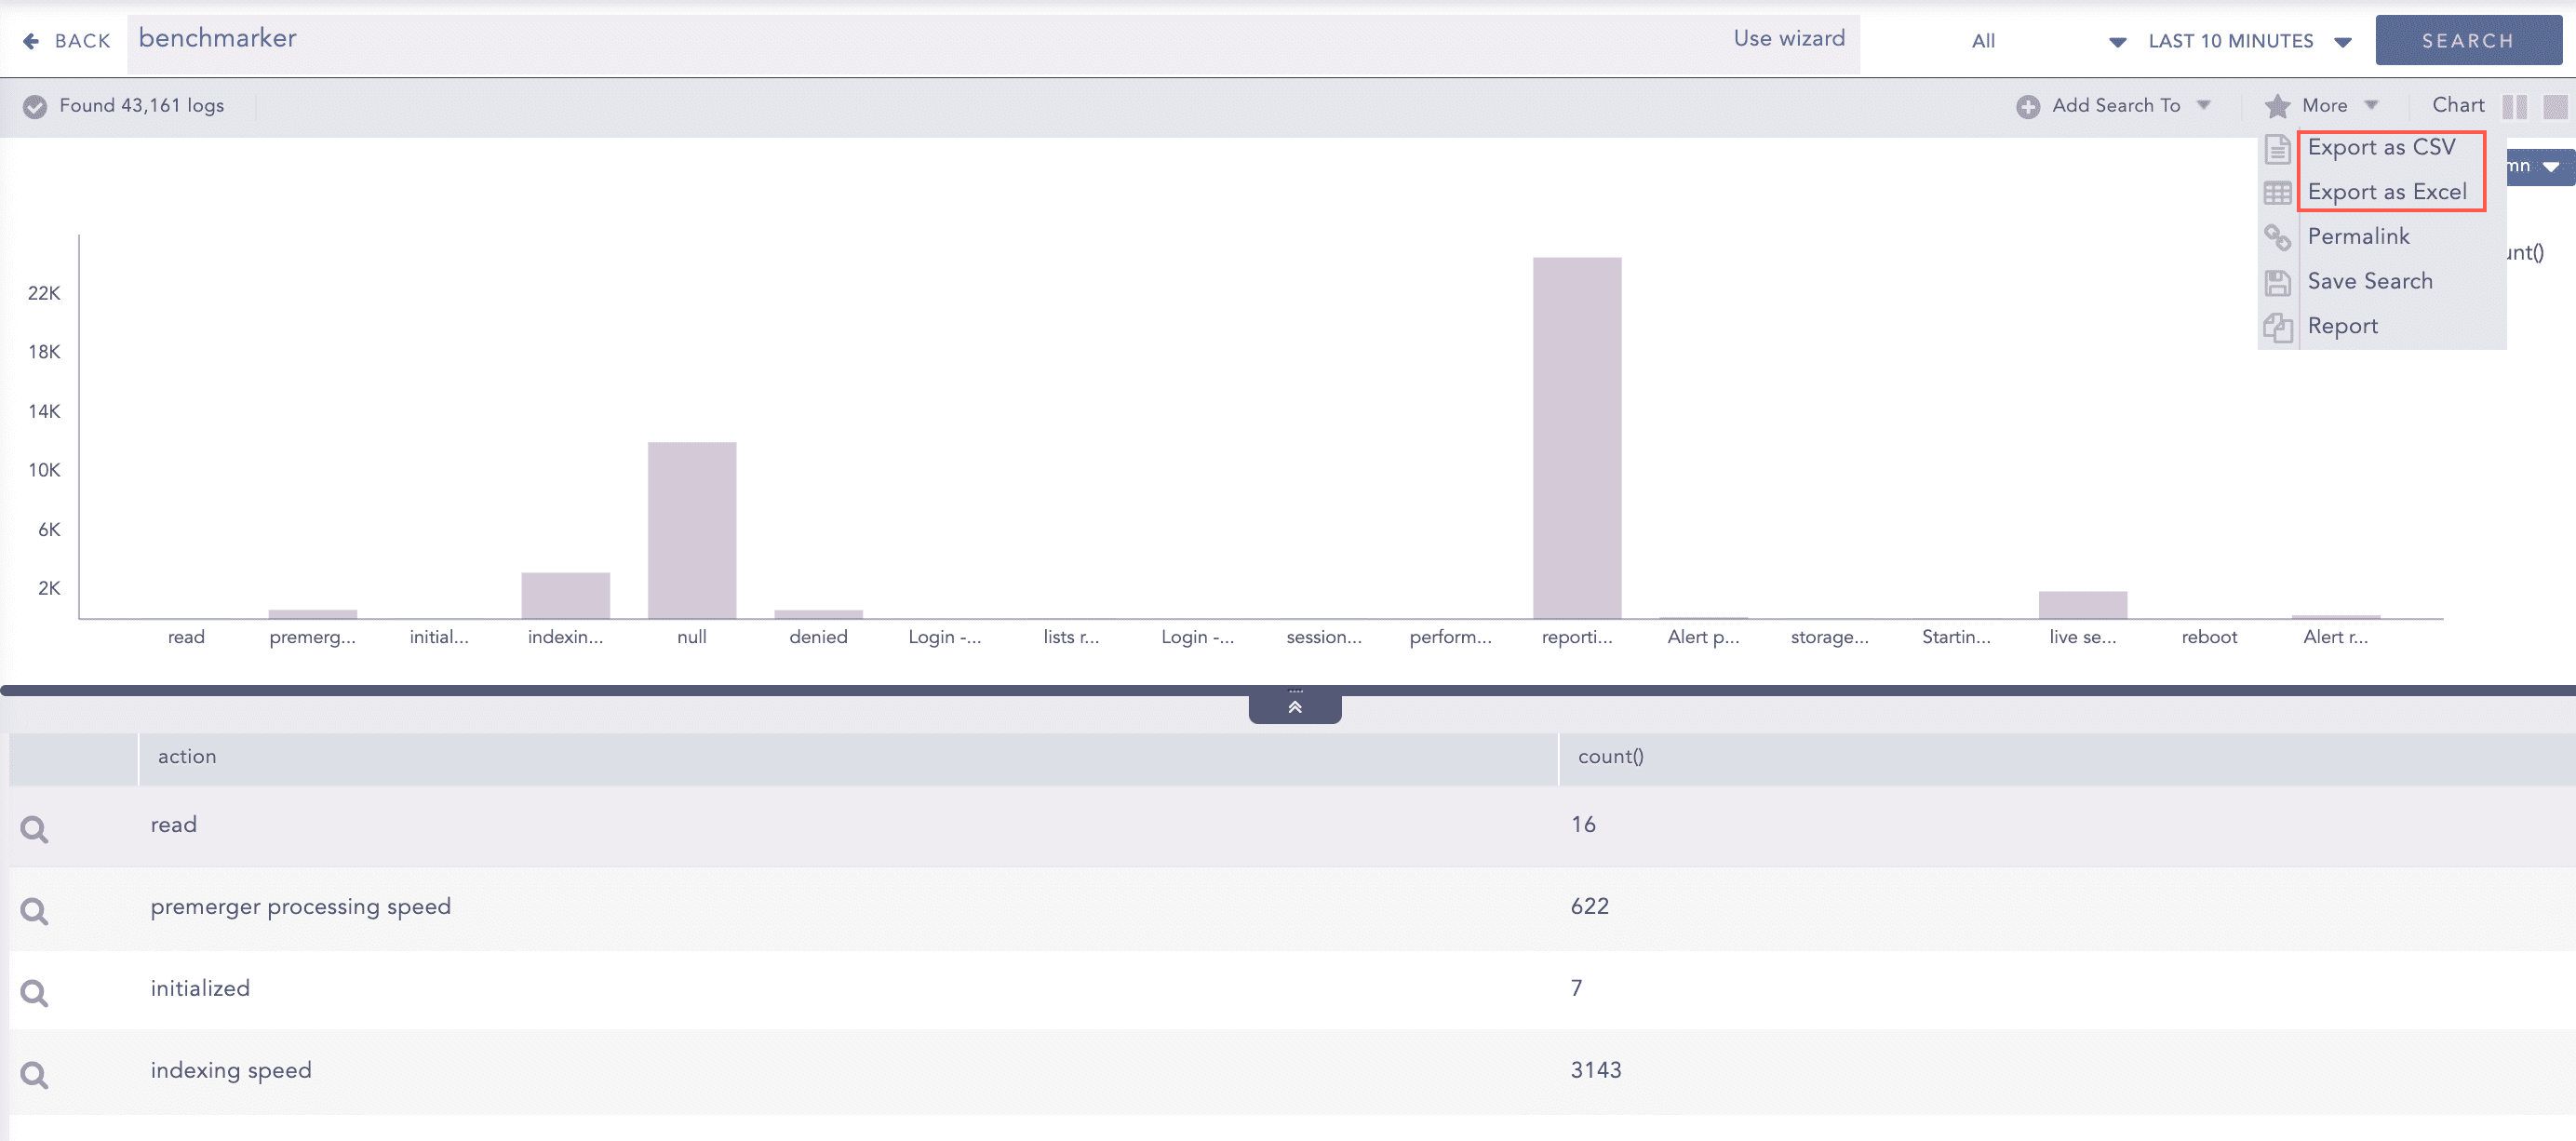
Export Options for Aggregated Queries
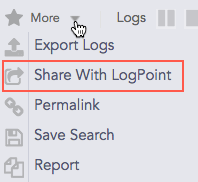
Share with LogPoint lets you share the logs on the current page with LogPoint. The logs from the current search are uploaded into the community site once you click this option.
Note
This option is available only for simple search queries.
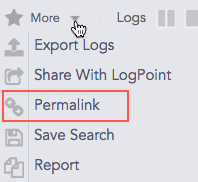
Permalink gives you a complete URL required to generate the current search. You can share this link to other users in the system to make exact and similar search.
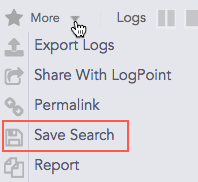
Save Search lets you save your current search. You can view the Saved Searches on the Search page under the My Saved Searches section.
You can click this option to generate the report of the current search result. For details, refer to Creating a Report from a Search Query.