You can refine your search query by clicking on the highlighted key-value pairs or raw log message search results. Clicking on any value in the result adds a filter to the original search query. You can add any number of filters in order to drill down in detail. To undo or remove any filters, click them.
For example, to view successful login events for the user rst@LogPoint.com from the IP: 192.168.2.20, click successful login in the action field and click the user rst@LogPoint.com. Finally, click IP: 192.168.2.20. The selected value is added to the query and is displayed in the query bar.
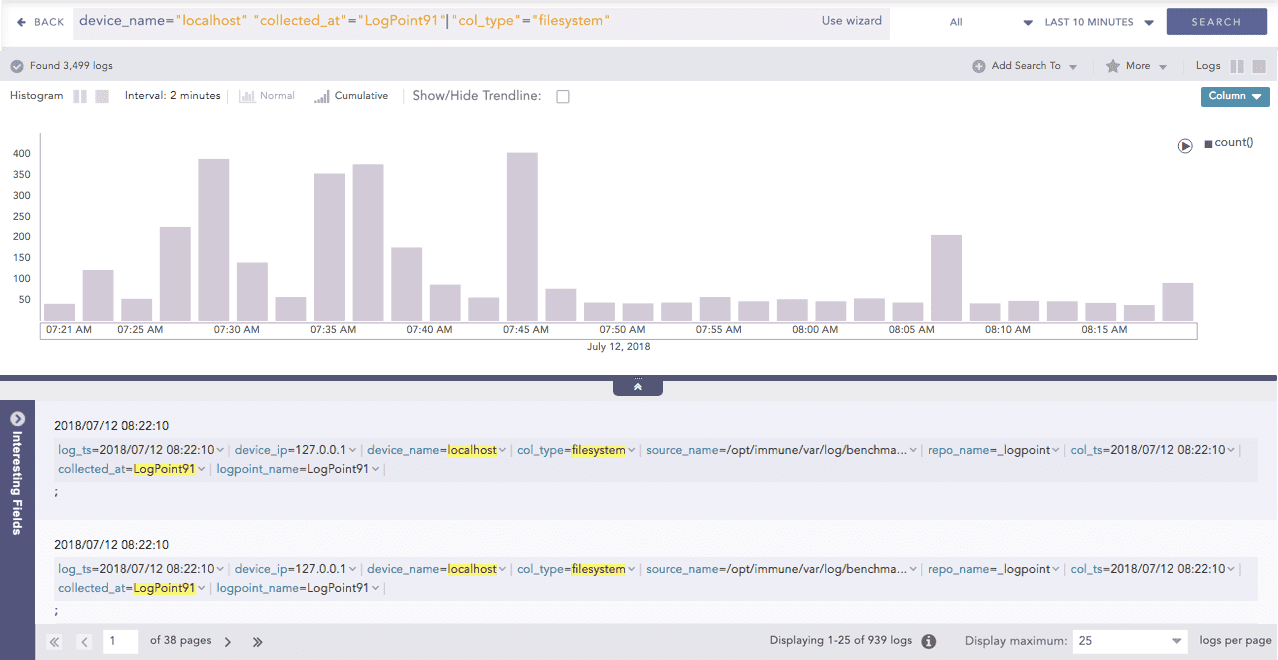
Drilldown Example
The example above is a detailed file system search on both Logpoint, and the localhost. The filters “device_name”=”localhost”, “collected_at”=”Logpoint”, and “col_type”=”filesystem” automatically appear in the search query.
You can also carry out a detailed, negative search in the same way. To perform a negative search, hold down the Shift key and select key-value pairs or raw log messages at the same time.
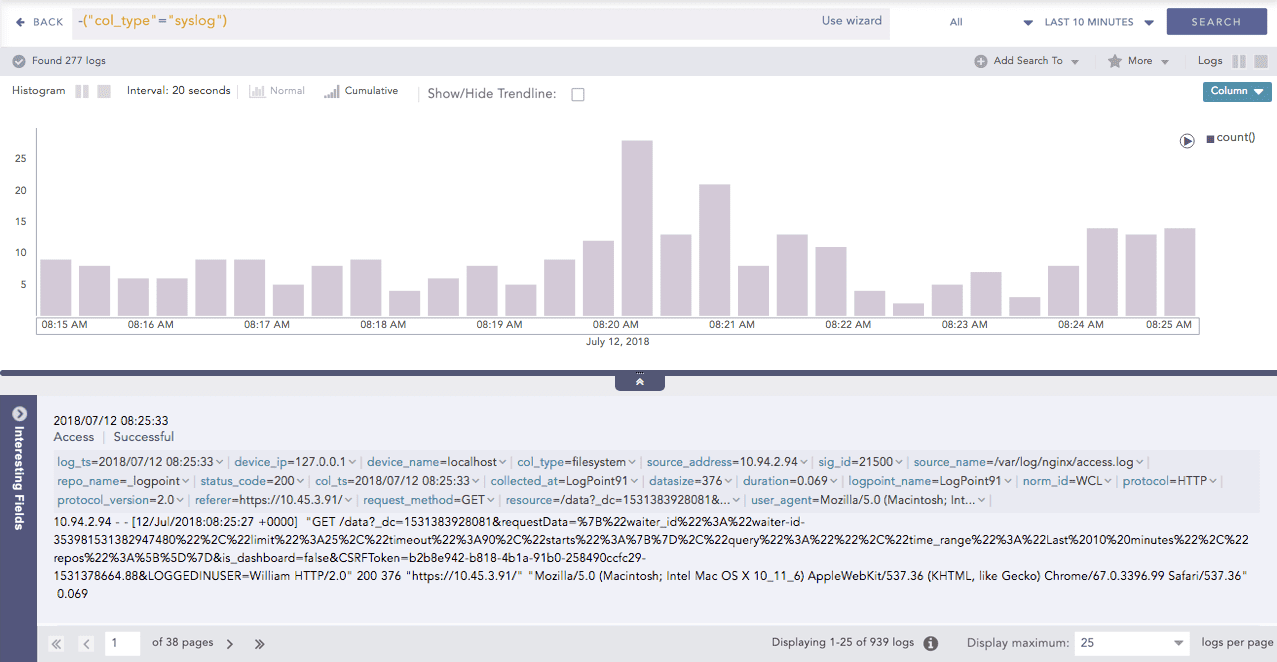
Negative Drilldown Example
The screenshot above is for the negative drill-down conducted on the filesystem, i.e., the filter component filesystem is selected from the result’s content while pressing the Shift key. Note that the query -(“col_type”=”filesystem”) automatically appears in the search query. You can see that the result does not include the component filesystem.
You can also drill down on the result graphs, logs, and the normalized key-value pairs.
When you execute a search query, you can apply actions to the key-value pairs. Click the drop-down menu on the key-value pairs to view what you can do.
You can view the Top 10 Fields for the selected fields and values. To view the results for the particular search field, click for this search, else, click for the whole database.
You can view the Time Trend for the selected fields. To view the results for the particular search field, click for this search, else, click for the whole database.
You can view the Time Trend for the full result-set. To view the results for the particular result-set, click for this search, else, click for the whole database.
You can perform a negative drilldown of the specific field-values by clicking the Exclude fields link. For example, if you click Exclude from the drop-down menu of the result set, Value=read2, all the results containing the field-value “read2” are removed.
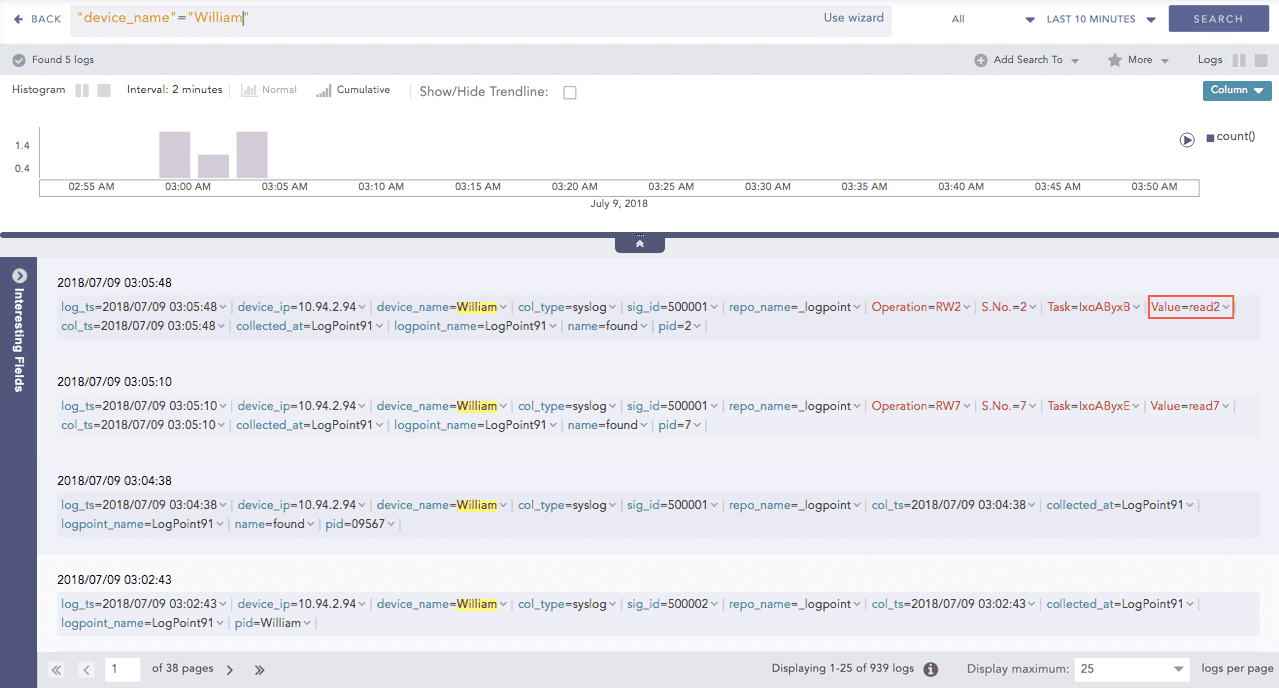
Before Excluding
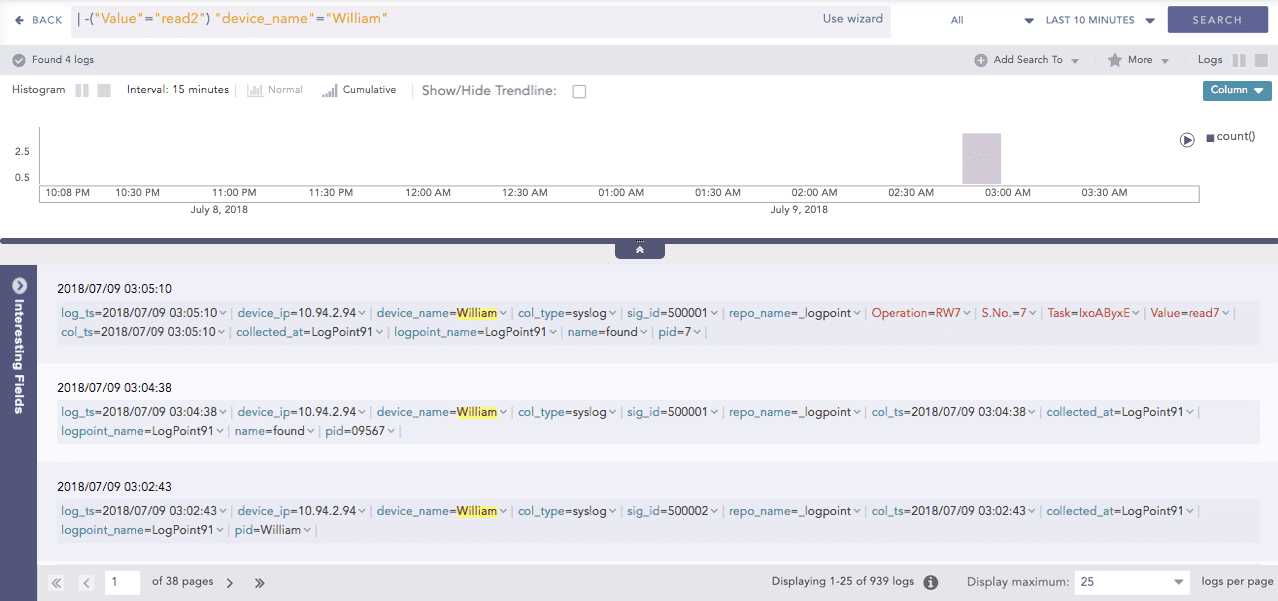
After Excluding
The example above describes the Exclude operation on the value read2.
Note
The query -(“Value”=”read2”) is automatically appended in the search query after clicking Exclude.
You can drill-down any value in the search results directly into a search template. Clicking the Explore in Search Template option redirects you to the search template with the selected value filled in the corresponding field.
The Explore in Search Template option appears only for the search templates that contain the selected field in their respective Fields section.
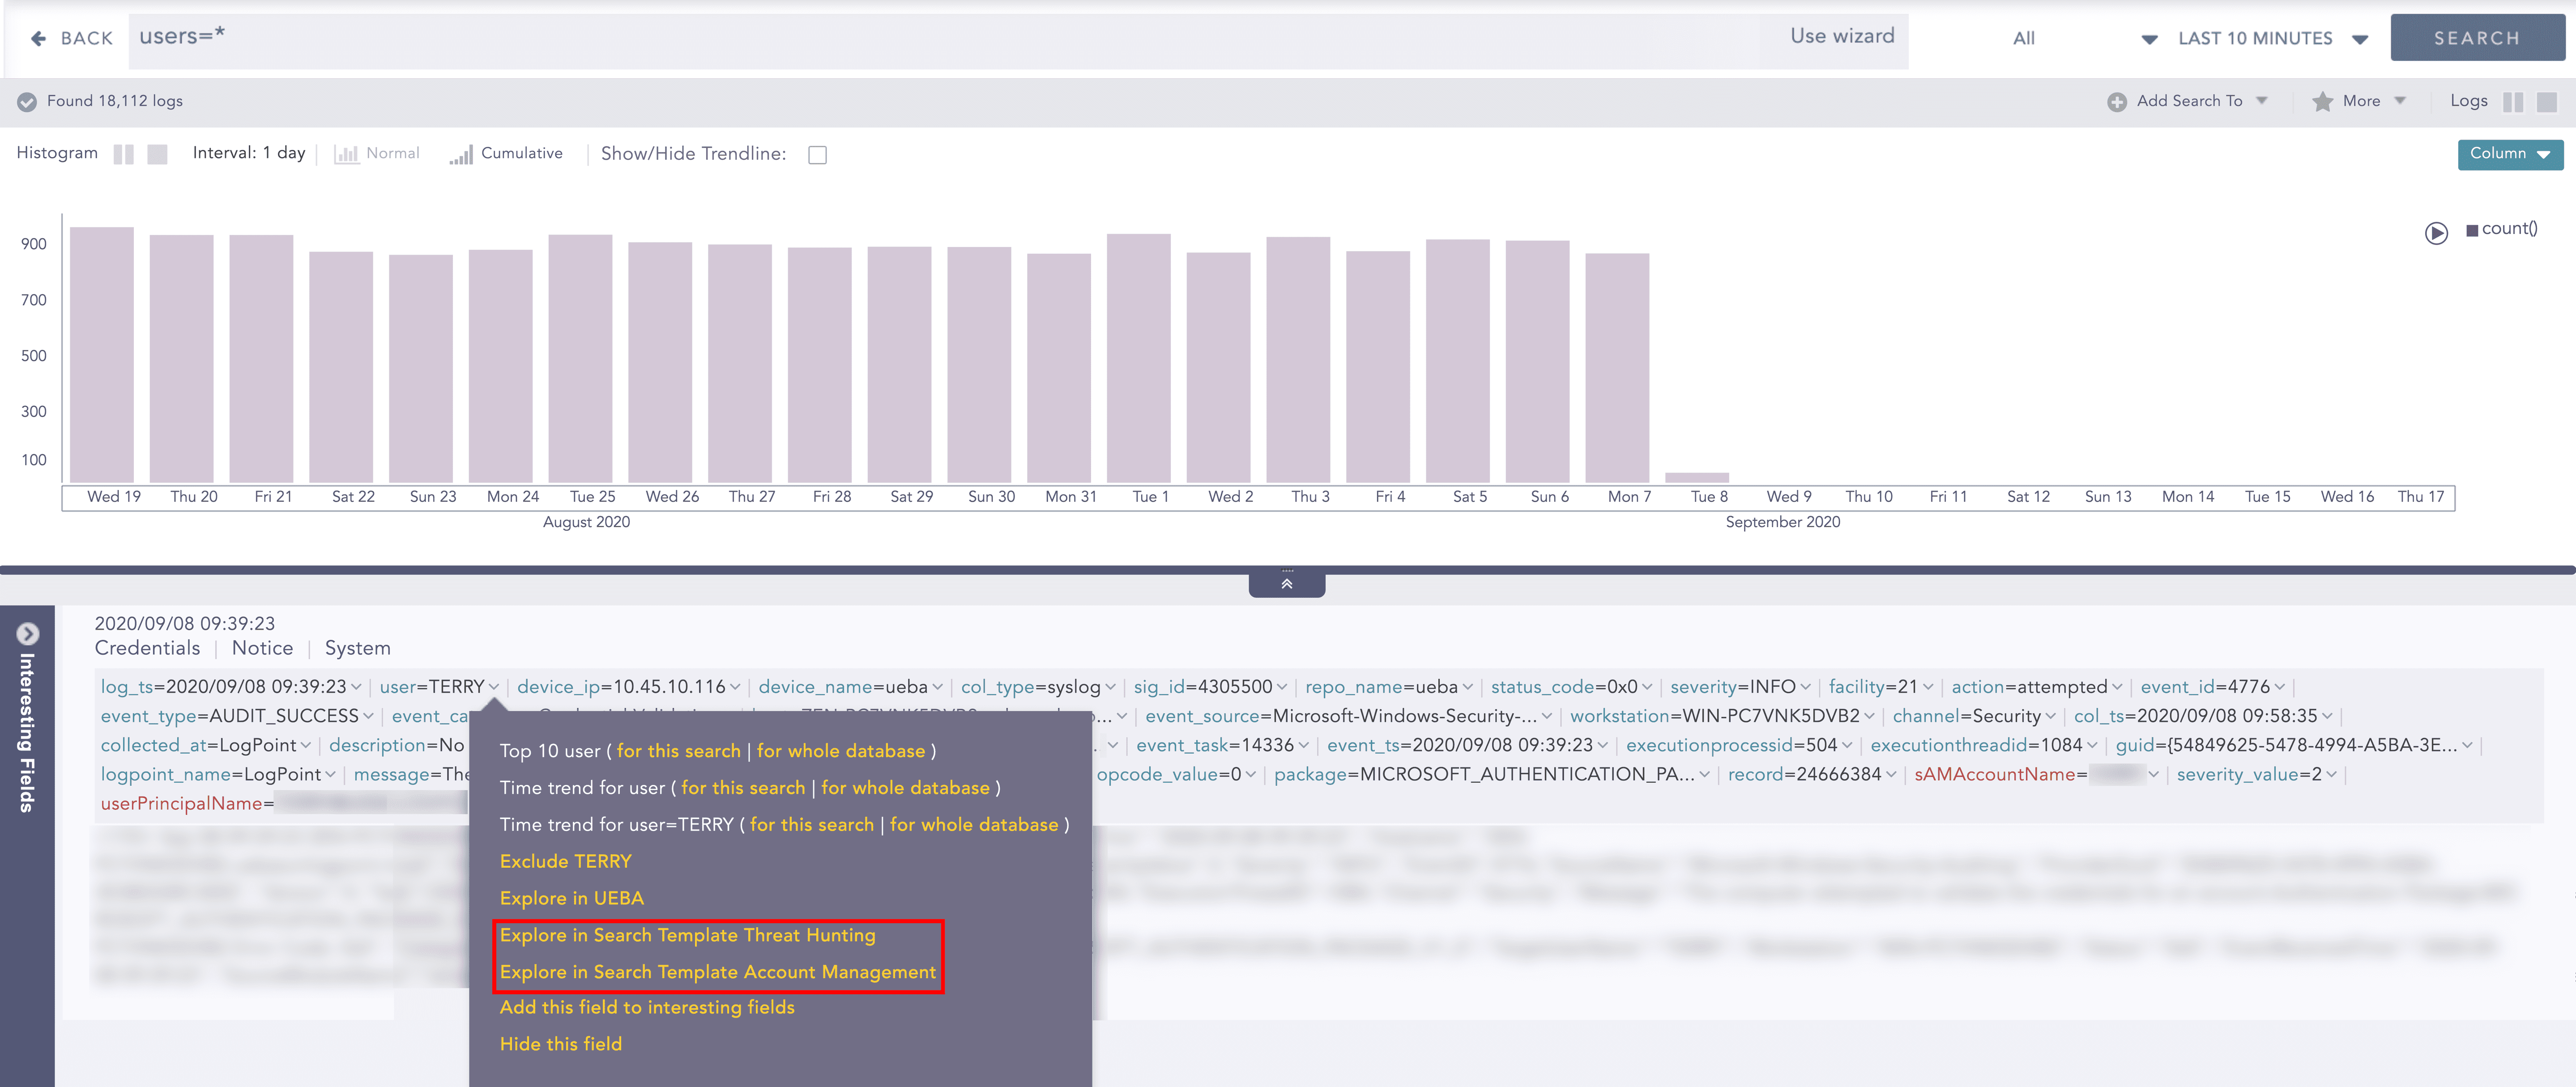
Explore in Search Template
This option is applicable for the key-value pairs which are included under the Data Privacy Module. Clicking this option opens the Data Privacy Request panel from which you can make a request to view the decrypted values of the encrypted fields. After a request is accepted by a granting user, you can search for the specific field.
To view the decrypted key-value pairs, follow the steps given below:
Go to Settings >> Configurations from the navigation bar and click Data Privacy Module.
Click the Search icon for the granted field under the My Request tab.
Logpoint redirects you to the Data Privacy Search from where you can view the decrypted values.
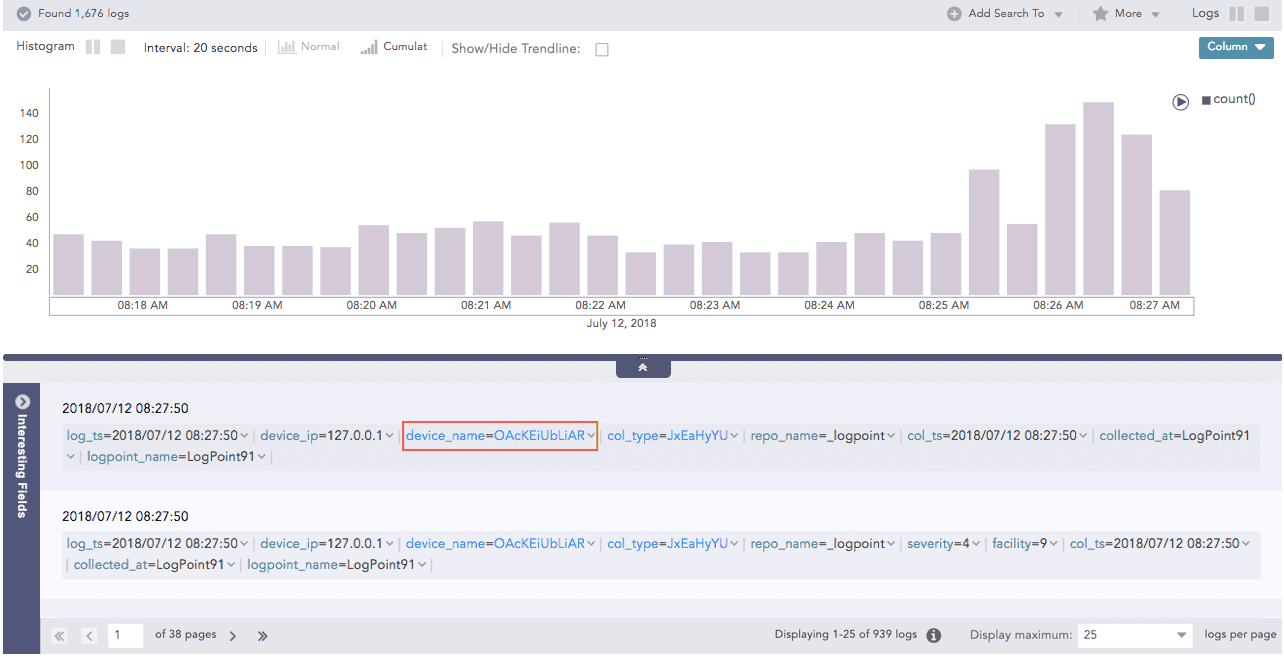
Before requesting
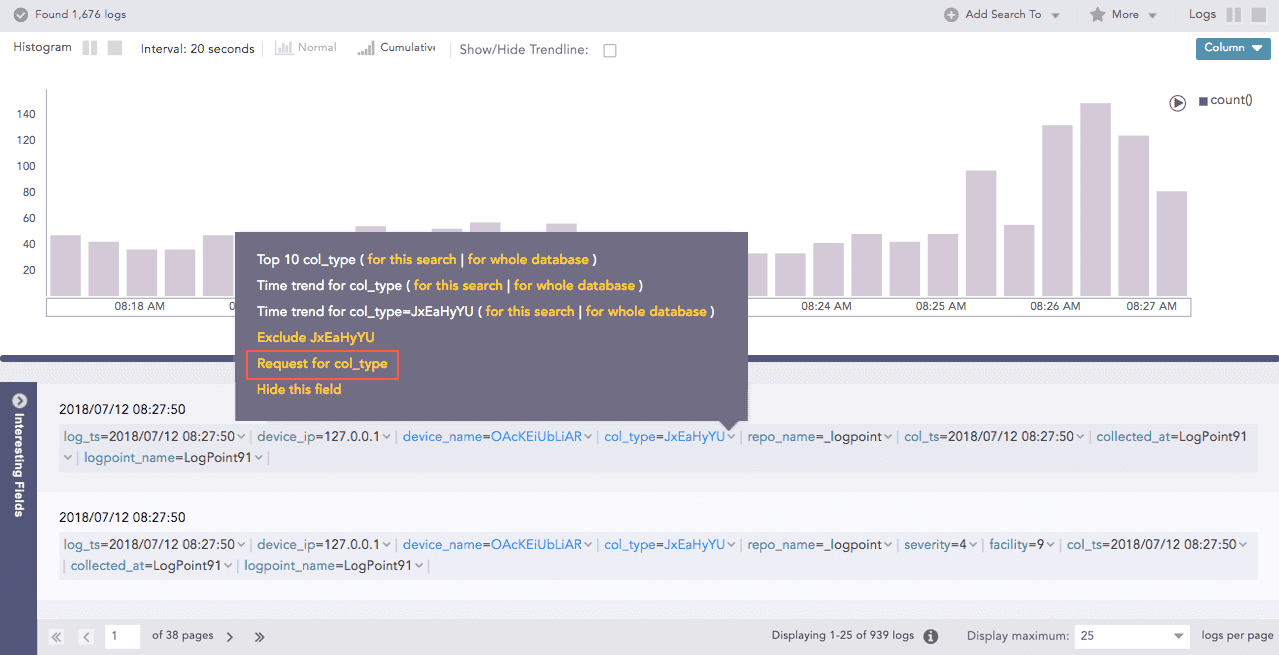
Request Drilldown
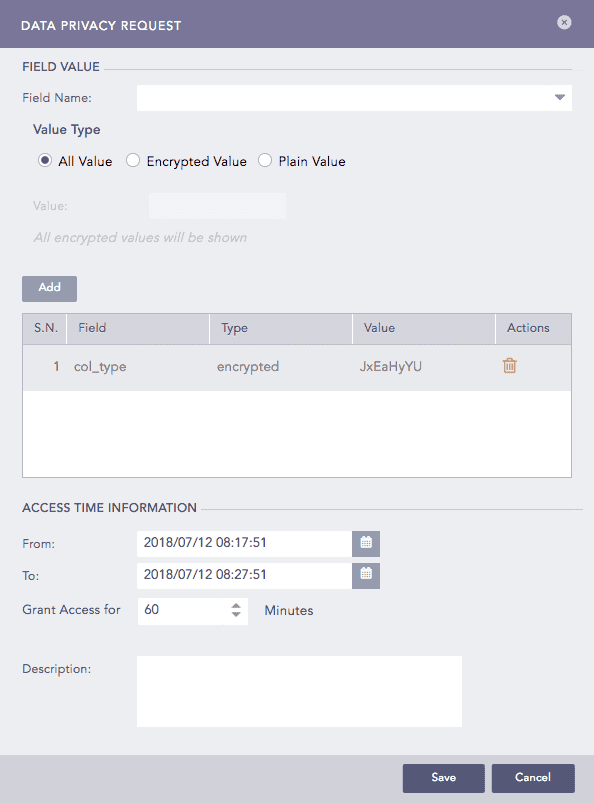
Data Privacy Module Field Request Panel
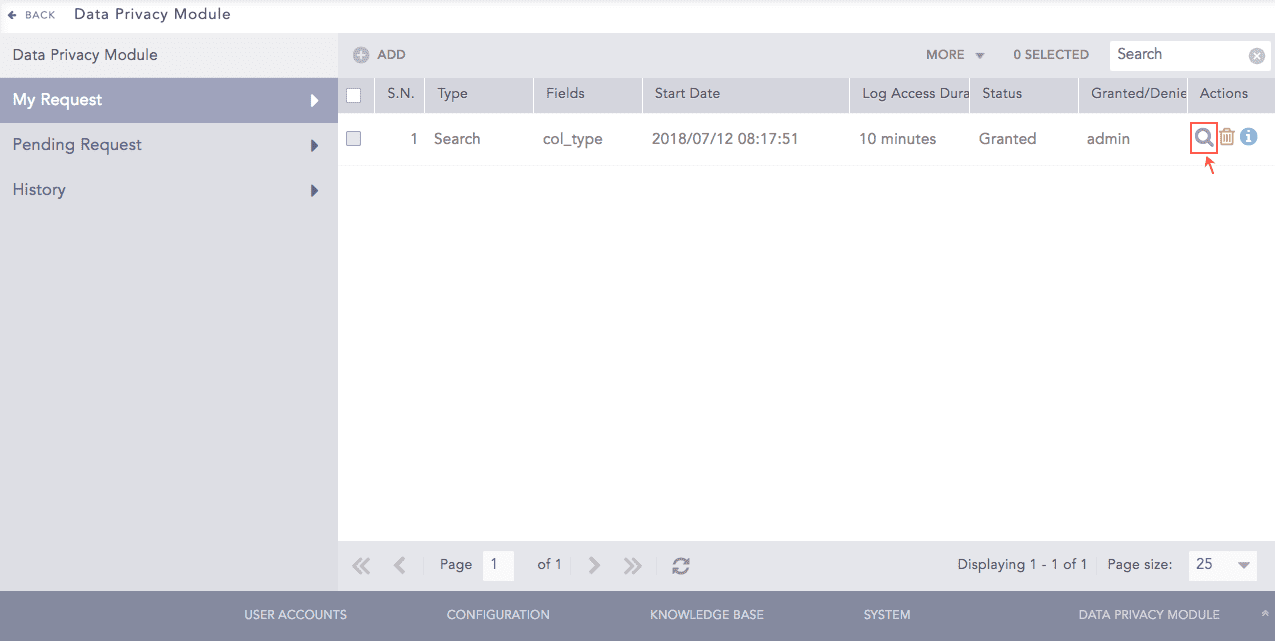
Granted Request
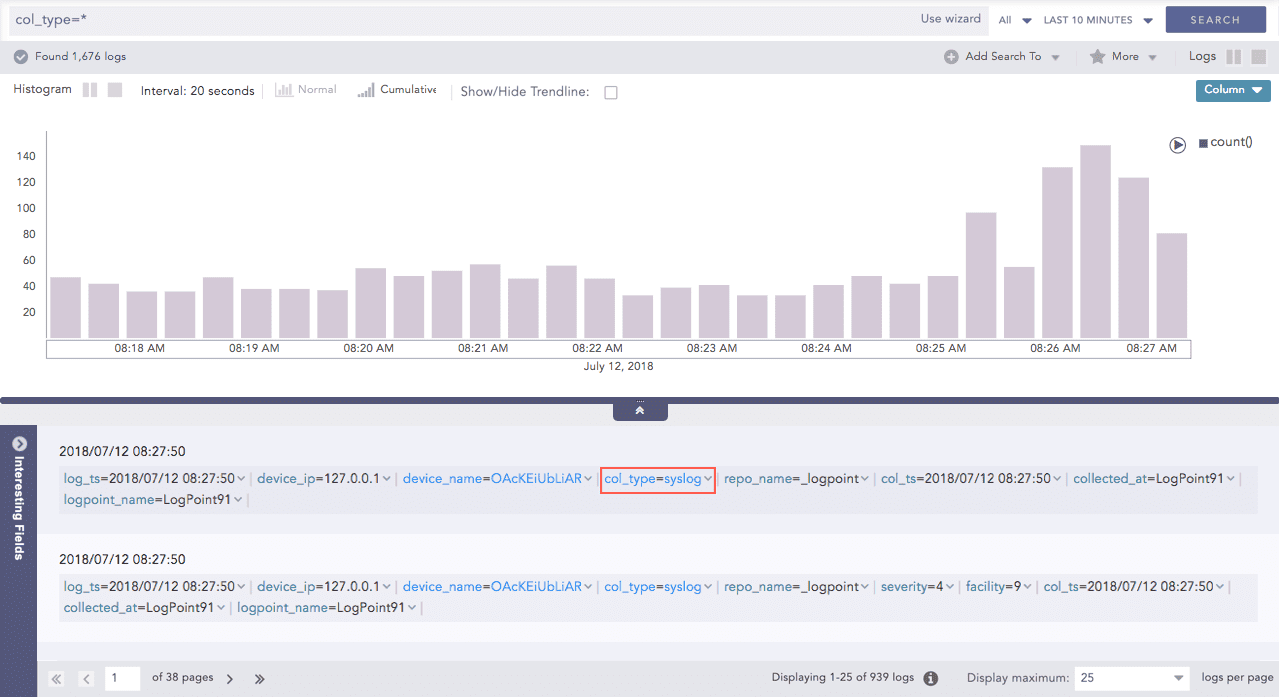
Data Privacy Search Page
You can select Add this field to interesting fields from the drop-down menu on the key-value pairs to add the required field in the Interesting Fields window. The fields added from here can be seen in the Add Fields panel of the Interesting Fields window.
You can select Hide this field from the drop-down menu on the key-value pairs to hide the required field value(s). You can also hide the fields by going through the My Preferences >> Search >> Search Log Fields and entering the field name(s) in Hide these Fields text box. Refer to My Preferences for more details.
Select a value from the drop-down menu to view the specified number of logs per page. The default value is 25.