Overview shows the same data for a specific and non-adjustable period from one place. It includes multiple dashboards for different personas, including a SOC manager, SOC analyst and SIEM engineer. It brings together widgets from various sources, aggregates their data and lets you manage how you want to view it. You need Logpoint admin permission to view Overview.
To view Overview:
Click Dashboard from the navigation bar.
By default, All Dashboards opens. Click Overview on the right of All Dashboards.
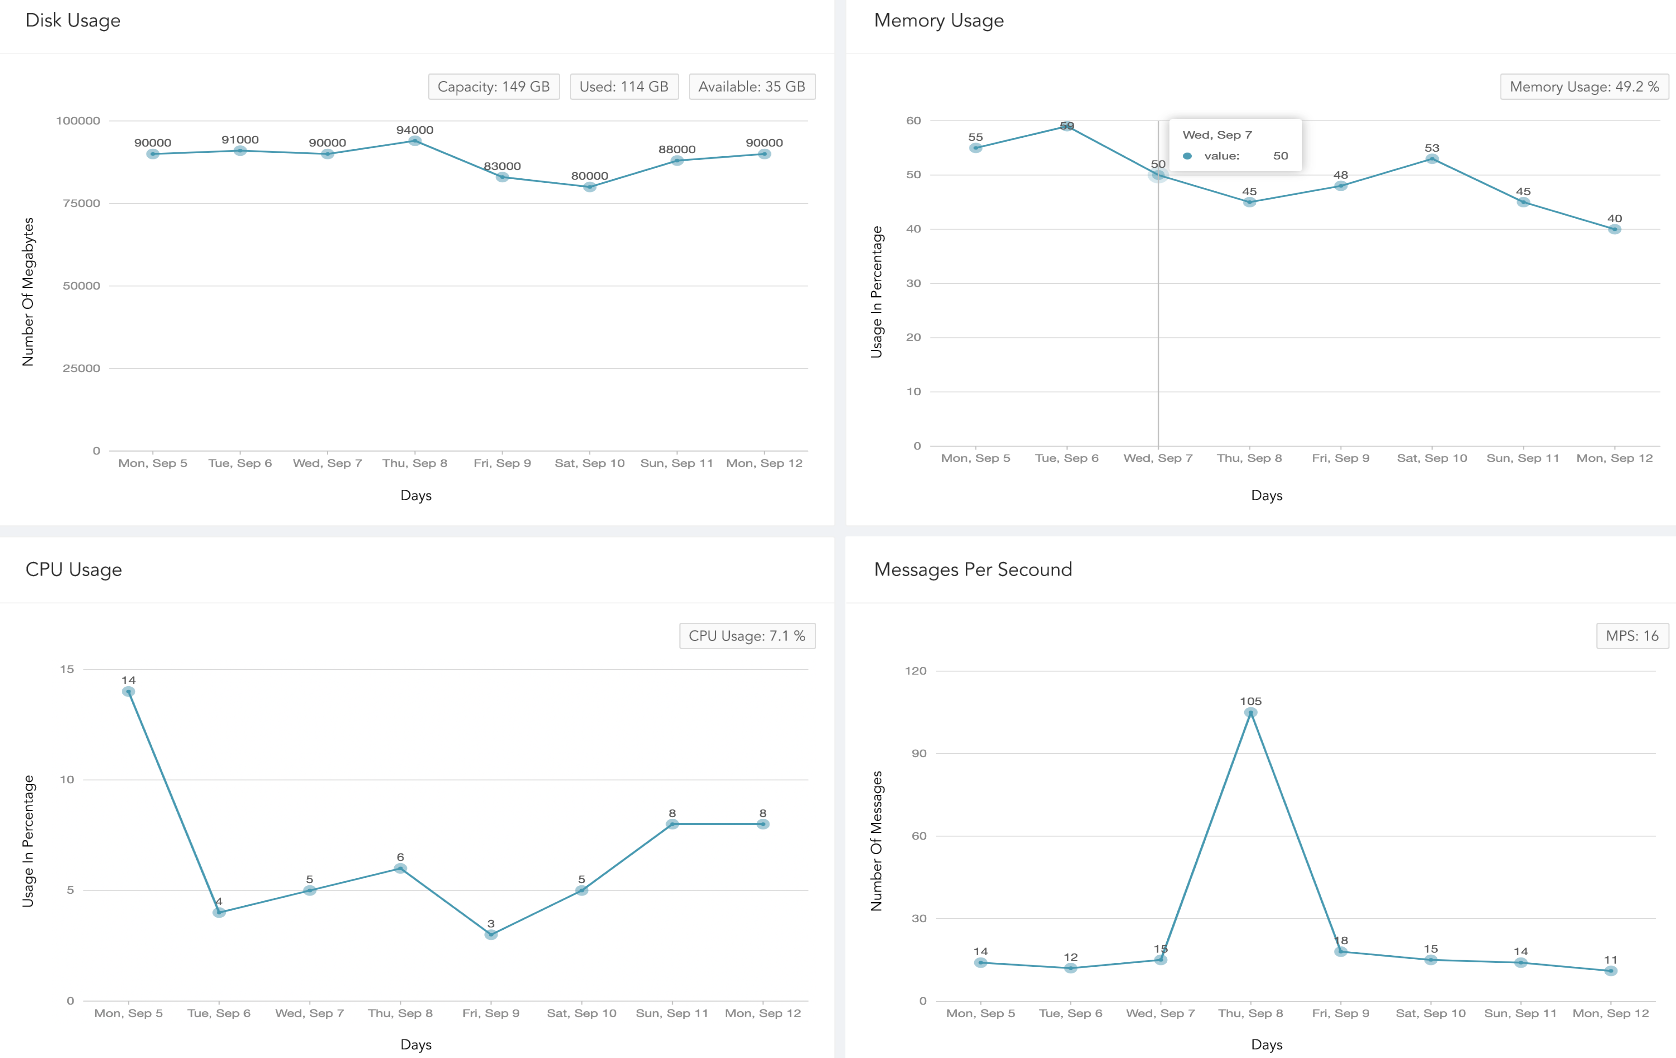
The System Health dashboard monitors system components such as disk usage, memory usage, CPU usage, and messages per second events, providing administrators with a high-level system health overview. These system events can help you identify unusual patterns or activities, understand whether the system is running efficiently, and detect potential threats, malware, or malicious events early so you can take corrective actions.
The dashboard’s widgets are:
Widget Name |
Description |
|---|---|
Disk Usage |
The total number of gigabytes Logpoint is using to run programs and carry out tasks daily in the specified period. Disk usage relates to hard disk performance. |
Memory Usage |
The trend of memory (RAM) capacity Logpoint uses while running processes or tasks in the specified period. This helps admin users understand system capacity and make sure there is enough memory. |
CPU Usage |
The total percentage of processing power in use so an admin user can check system performance, health and speed. |
Messages Per Second |
Logpoint’s scalability and capacity to handle a large volume of messages within a second. It can help admin users identify peak message rates and assess capacity. |

System Health Dashboards
The SOC Operation dashboard is an overview of real-time cybersecurity incidents based on key measures, workflows, and behavioral patterns. The incident status/severity, cases status/severity and case response event data Logpoint provides is from daily activity during a specified period. You can use this dashboard to check SOC effectiveness and ensure all security operations including detections, analyses, and responses are running effectively.
The dashboard’s widgets are:
Widget Name |
Description |
|---|---|
Incidents By Status |
Unresolved and resolved incident trend’s accumulated data collected each day over a specified period so SOC managers can use to find the number of changed incident states. |
Incidents By Severity |
The total number of accumulated incidents with severity (critical, high and medium) not closed daily in a specified period so a SOC manager can view risk trends associated with incidents and adjust the incident threshold. |
Cases By Severity |
The total number of accumulated cases with severity (critical, high and medium) not closed daily in a specified period so SOC managers can see how case severity has changed and help them prioritize case work. |
Cases By Status |
The accumulated data on open and in progress cases trends for each day in a specified period. SOC managers can view the proportion of cases whose status changed and evaluate the current risk level. |
Automated Response vs Manual Response |
The accumulated data of cases closed by playbooks (automated response) and cases closed by SOC analysts (manual response) monthly in the specified period to assess the case resolution reliability of the playbook so SOC managers can track the efficiency of automation. |

Incidents

Cases

Automated Response Vs Manual Respose
We are glad this guide helped.
Please don't include any personal information in your comment
Contact Support