The Clustered Column chart is a type of Column Chart which allows you to display multiple quantitative variables.
Unlike a standard Column Chart, where only one variable is used to mark x-axis, a Clustered Column chart uses multiple variables on the x-axis with a different color for each variable.
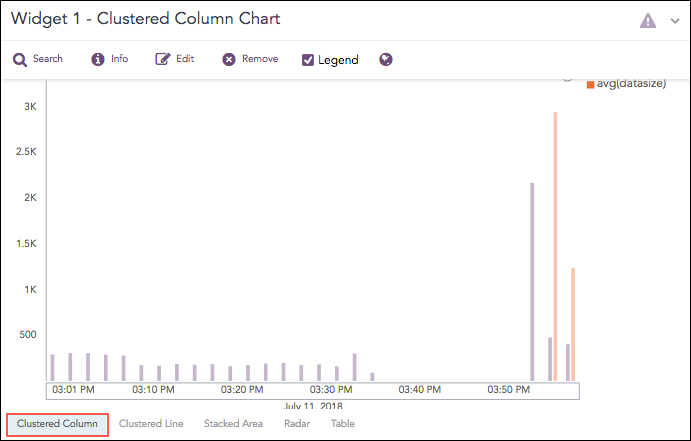
Clustered Column Chart
The following query gives the output shown above.
| timechart count(), avg(datasize)
The Clustered Column chart supports four aggregation response types for representation of search results in the visualization. They are:
Response Type |
General Syntax |
|---|---|
| chart count(), avg(datasize)
|
|
| chart aggregation_parameter1, aggregation_parameter2 by grouping_parameter1, grouping_parameter2, ...,grouping_parametern
|
|
| timechart aggregation_parameter1, aggregation_parameter2, .... aggregation_parametern
|
|
| timechart aggregation_parameter1, aggregation_parameter2, ...., aggregation_parametern by grouping_parameter1, grouping_parameter2, ...., grouping_parametern
|
For the Multiple Aggregation without Grouping response type, the x-axis represents the different aggregation parameter, and y-axis contains the scale that denotes the value of the aggregation parameter.
Example:
| chart max(sent_datasize), max(received_datasize)
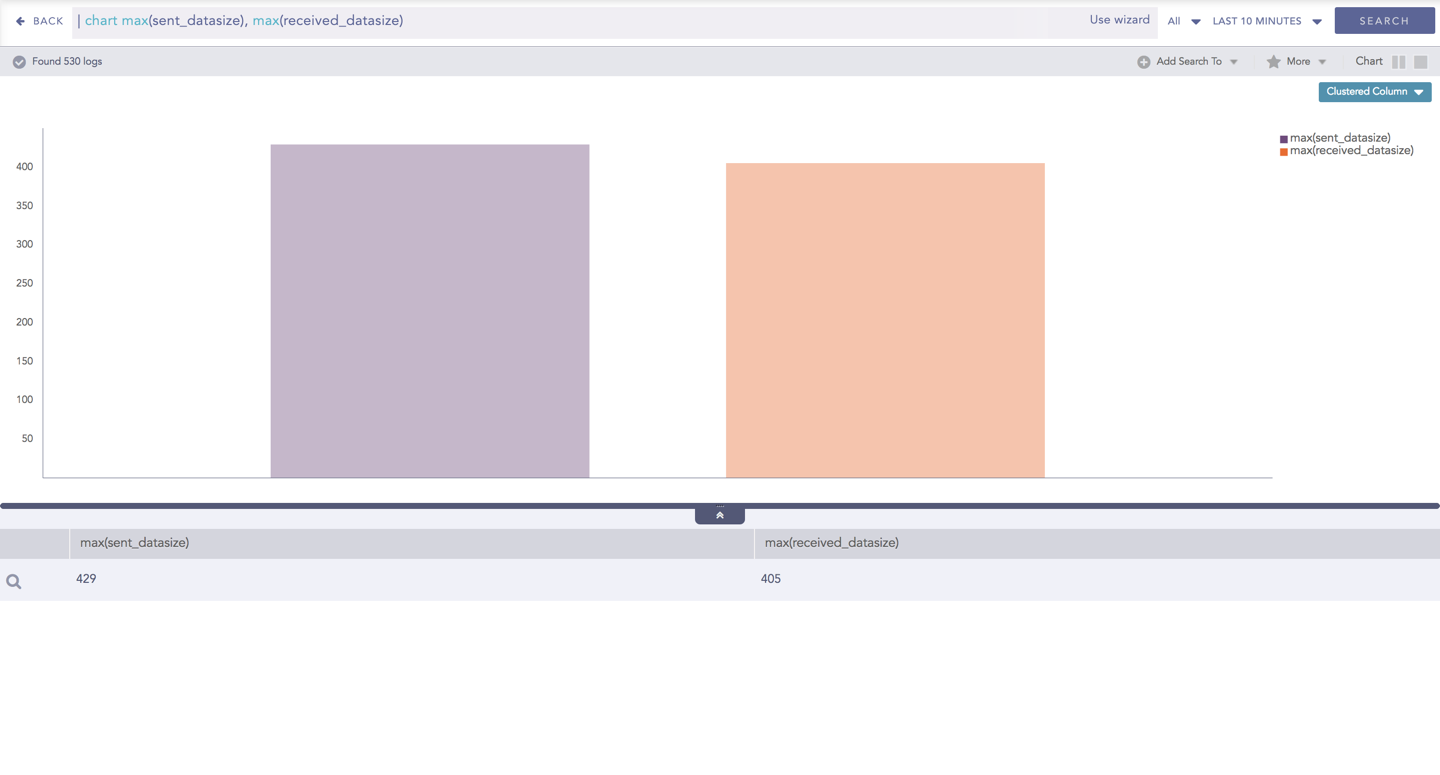
Clustered Column chart for Multiple Aggregation without Grouping
You can refer to Multiple Aggregation without Grouping for more details.
For the Multiple Aggregation with Grouping response type, the x-axis contains the values of grouping parameter(s) with a vertical bar for each aggregation parameter. The height of the bar determines the value of the aggregation parameter for the specific value of a grouping parameter. The y-axis contains the scale that denotes the value of the aggregation parameter.
Example:
action=Allow or action=Deny | chart count(action=allow) as AllowedConnection, count(action=
deny) as DeniedConnection by source_address order by count(action=allow), count(action=
deny) desc limit 10
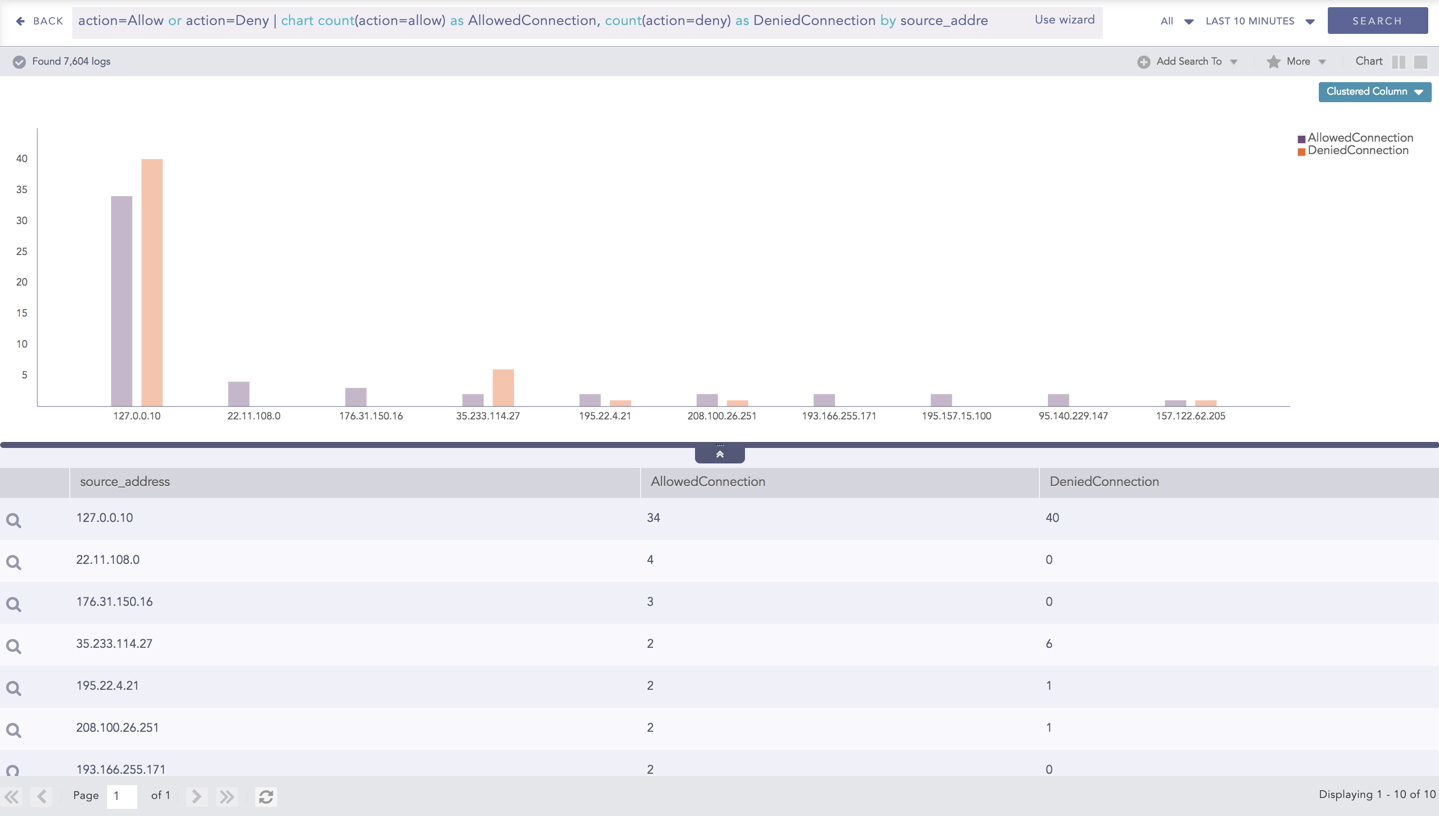
Clustered Column chart for Multiple Aggregation with Grouping
You can refer to Multiple Aggregation with Grouping for more details.
For the Timechart Multiple Aggregation without Grouping response type, the x-axis represents the different time buckets within the specified time range, and the y-axis contains the scale that denotes the value of the aggregation parameter. The bars indicate the different values of the aggregation parameter at different timestamps. The vertical length of a bar signifies its value of the aggregation parameter at that particular timestamp.
Example:
norm_id=WinDNSDHCP | timechart count(lease_address=drop) as Dropped, count(lease_address=start) as Started,
count(lease_address=end) as ENDED
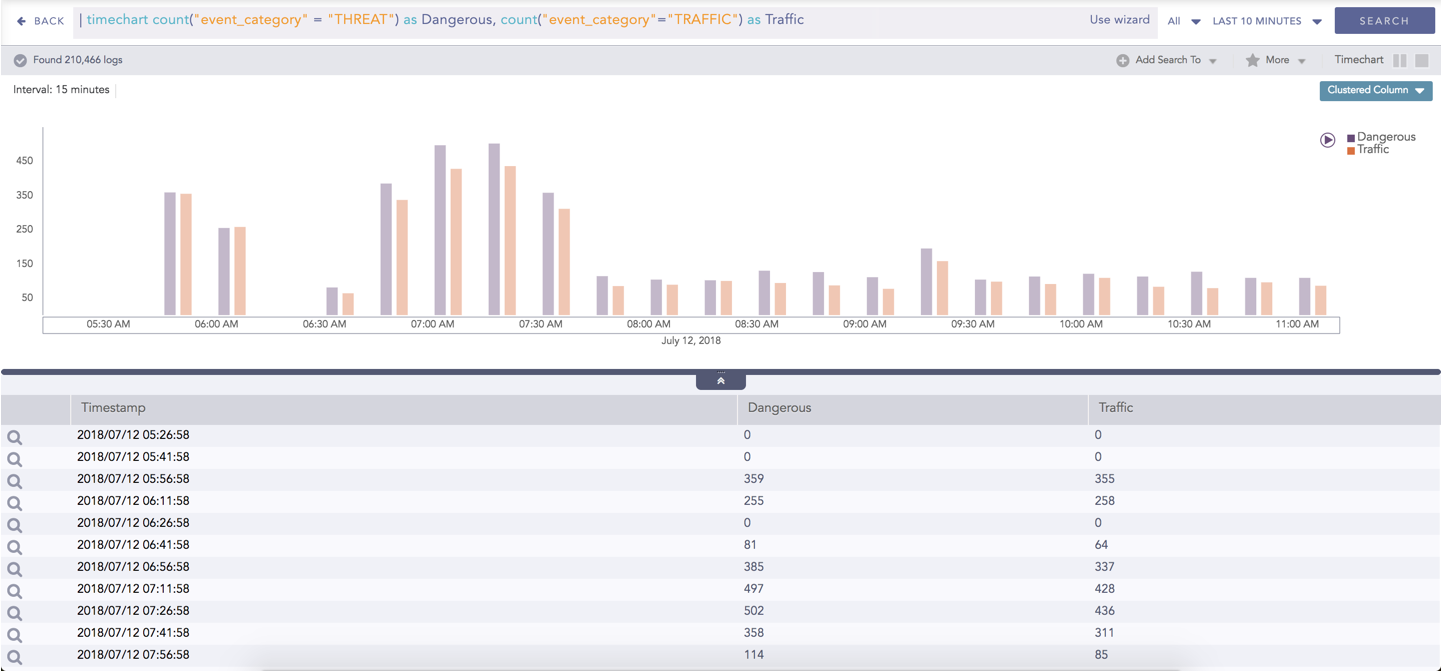
Clustered Column chart - Timechart Multiple Aggregation without Grouping
You can refer to Timechart Multiple Aggregation without Grouping for more details.
For the Timechart Multiple Aggregation with Grouping response type, the x-axis represents the different time buckets within the specified time range, and the y-axis contains the scale that denotes the value of the aggregation parameter. The bars indicate the different values of the aggregation parameter at different timestamps. The vertical length of a bar signifies its value of the aggregation parameter at that particular timestamp.
Example:
norm_id=WinDNSDHCP | timechart count(lease_address=drop) as Dropped, count(lease_address=start) as Started,
count(lease_address=end) as ENDED
Clustered Column chart - Timechart Multiple Aggregation with Grouping
You can refer to Timechart Multiple Aggregation with Grouping for more details.