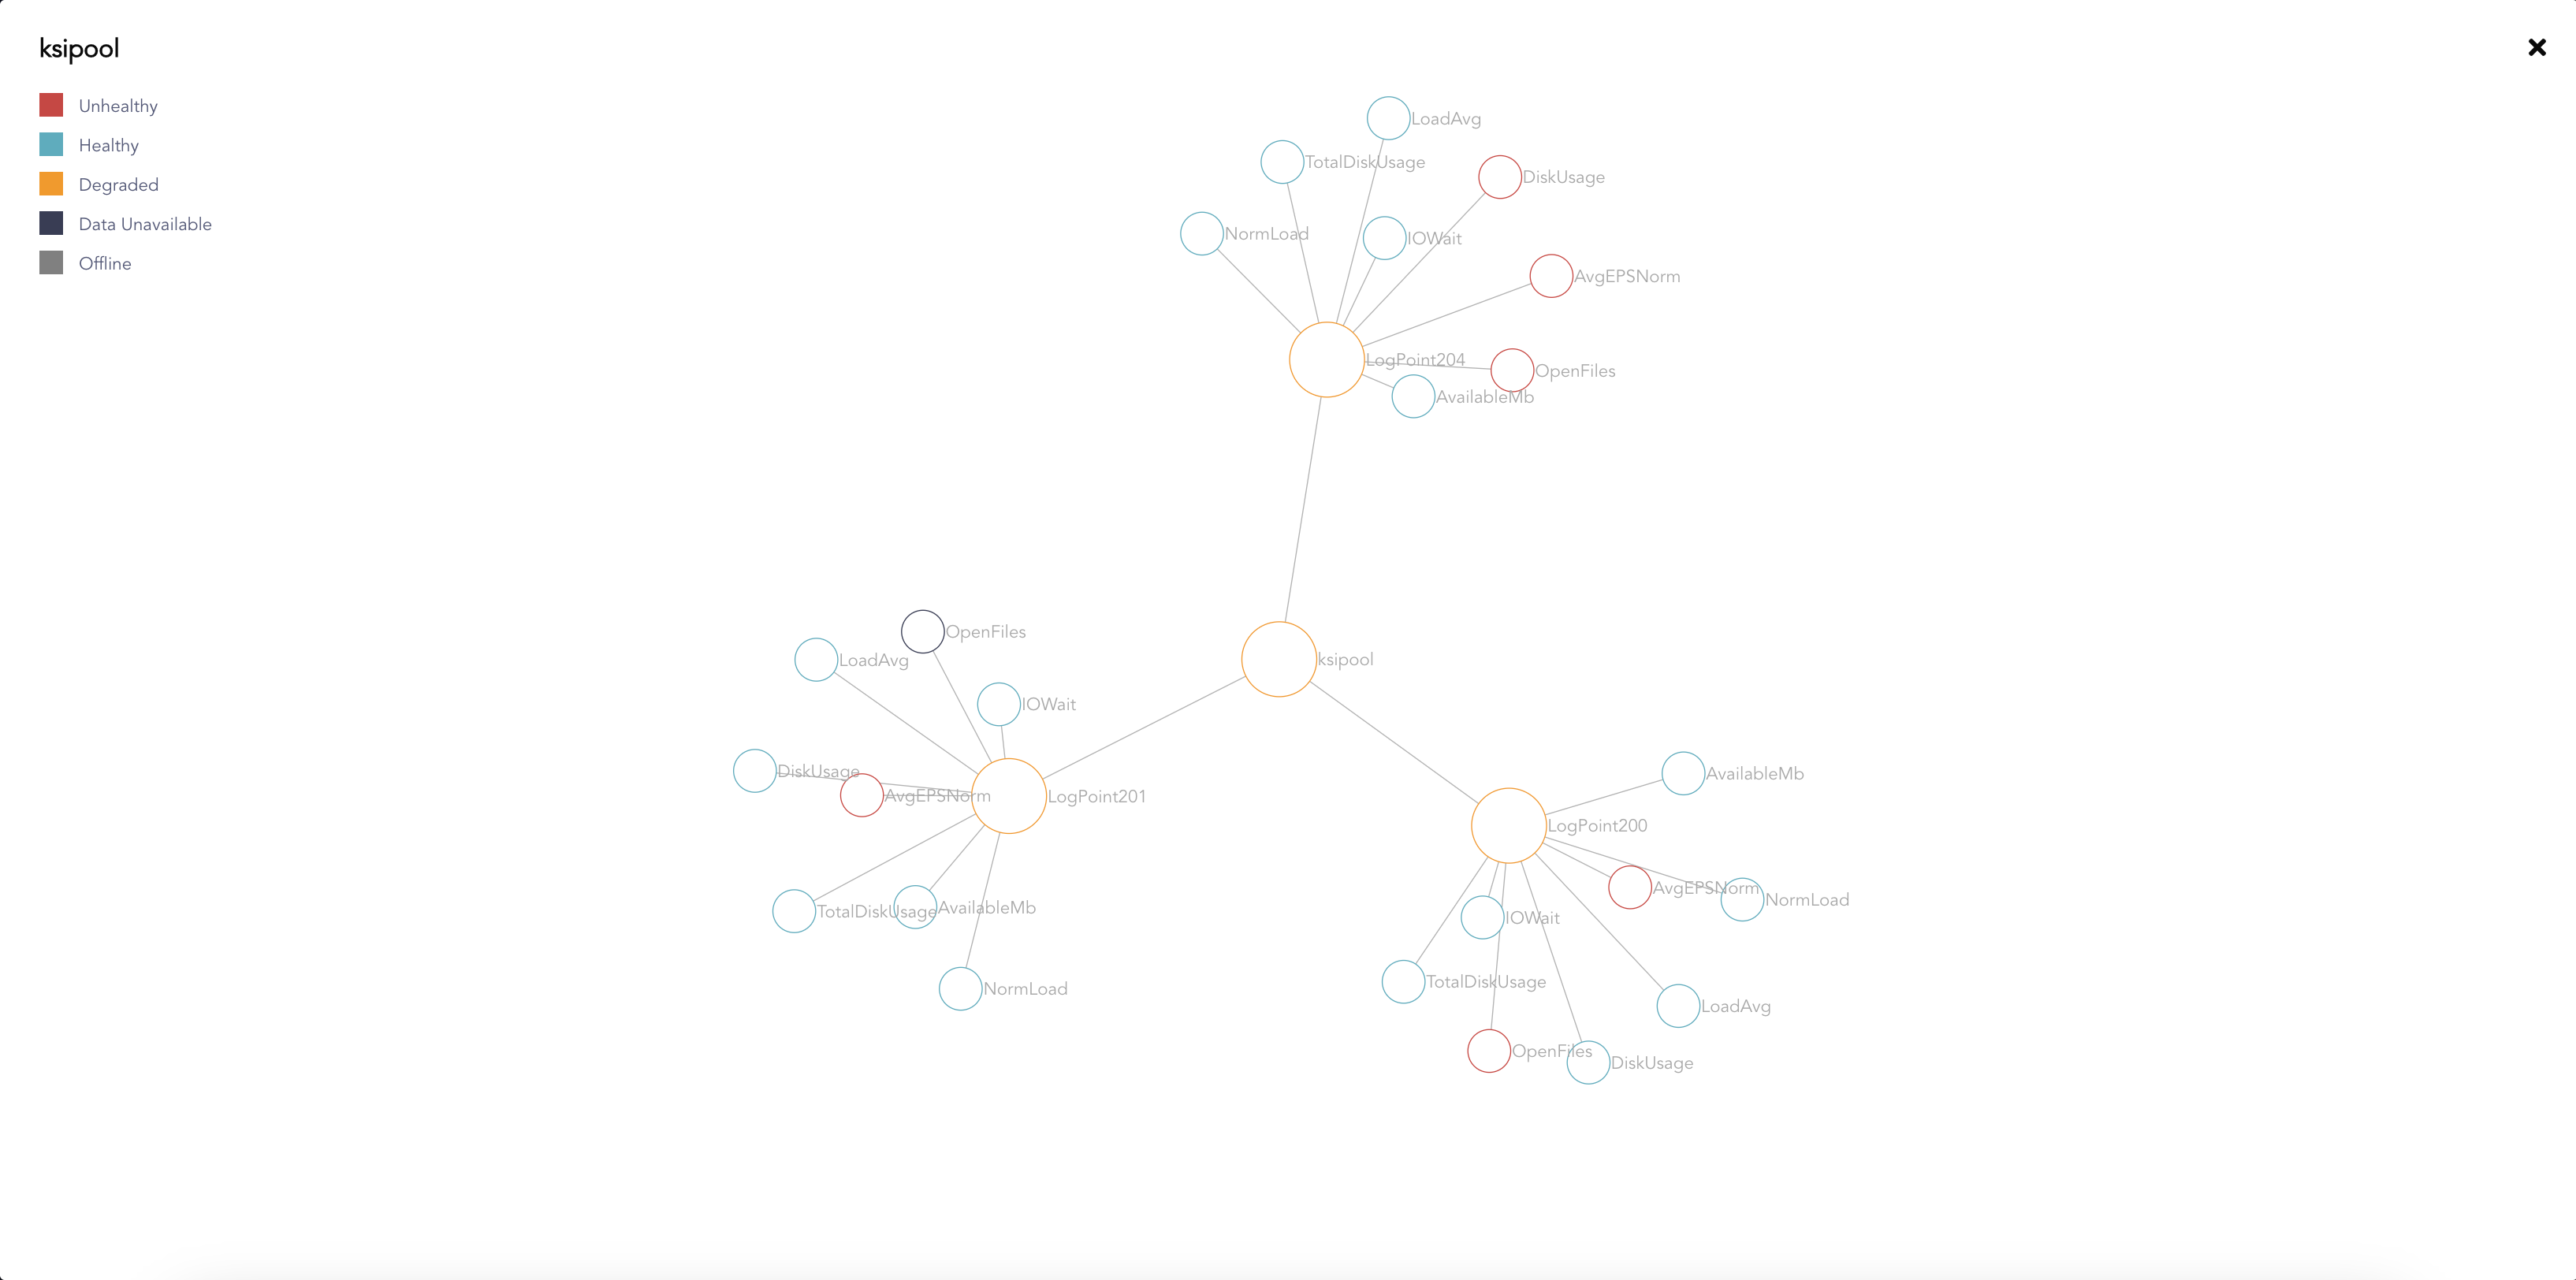
In the Pools section, you can view the health status for all the pools in Director Console.

Pool Widget
The parameters available in the Pools are:
Pools Parameter |
Description |
|---|---|
Failed Tasks |
Shows the total count of the failed tasks executed in the Director Console on different pools and LogPoint instances in the last seven days. |
Completed Tasks |
Shows the total count of the completed tasks executed in the Director Console on different pools and LogPoint instances in the last seven days. |
Pending Tasks |
Shows the total count of the pending tasks executed in the Director Console on different pools and LogPoint instances in the last seven days. |
Idle Percent |
Shows the CPU percentage of a LogPoint that is unused in any process for a particular instance of time. |
Available Memory |
Shows the available memory that the system can use, which includes free memory and cached memory. |
Free Memory |
Shows the available memory after allocating the memory to all the available processes. |
Inactive Memory |
Shows the total memory allocated to the processes that are no longer running. |
I/O Wait |
Shows the time (in milliseconds) for which the CPU is idle while waiting for an I/O operation to complete. |
Average Load |
Shows the average value of the CPU load over the last five minutes. Only an entirely idle CPU has an average load of zero. |
Normalizer Load |
Shows the percentage of load on the CPU due to normalizer services. It lets you track the tasks performed by the normalizer and its impact on the CPU. |
Server Roles |
Shows the count of the server roles used in the pools or the LogPoint instances. The server roles in the LogPoint are LogPoint Collector and Distributed LogPoint. |
Device Count |
Shows the total number of device IPs available in the LogPoint at a particular instance of time. |
Average Doable EPS per Normalizer |
Shows the total number of events and processes that a normalizer can handle per second. |
Stopped Services |
Shows the list of services if they are not working. |
Normalization EPS |
Shows the total number of events processed by the normalization layer per second. |
Store Handler EPS |
Shows the total number of events processed by the storage layer per second. |
Total Disk Usage |
Shows the total percentage of the disk used in the system. |
Open Files |
Shows the total number of open files. |
Disk Usage |
Shows the free disk space for each partition of all Logpoint instances in the pool. |
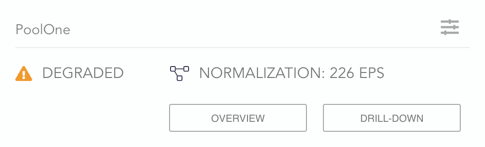
Go to Dashboard.
Click Overview in the required Pool widget.
Pool Overview
The Network Graph represents the pools, their LogPoint instances, and its parameters.
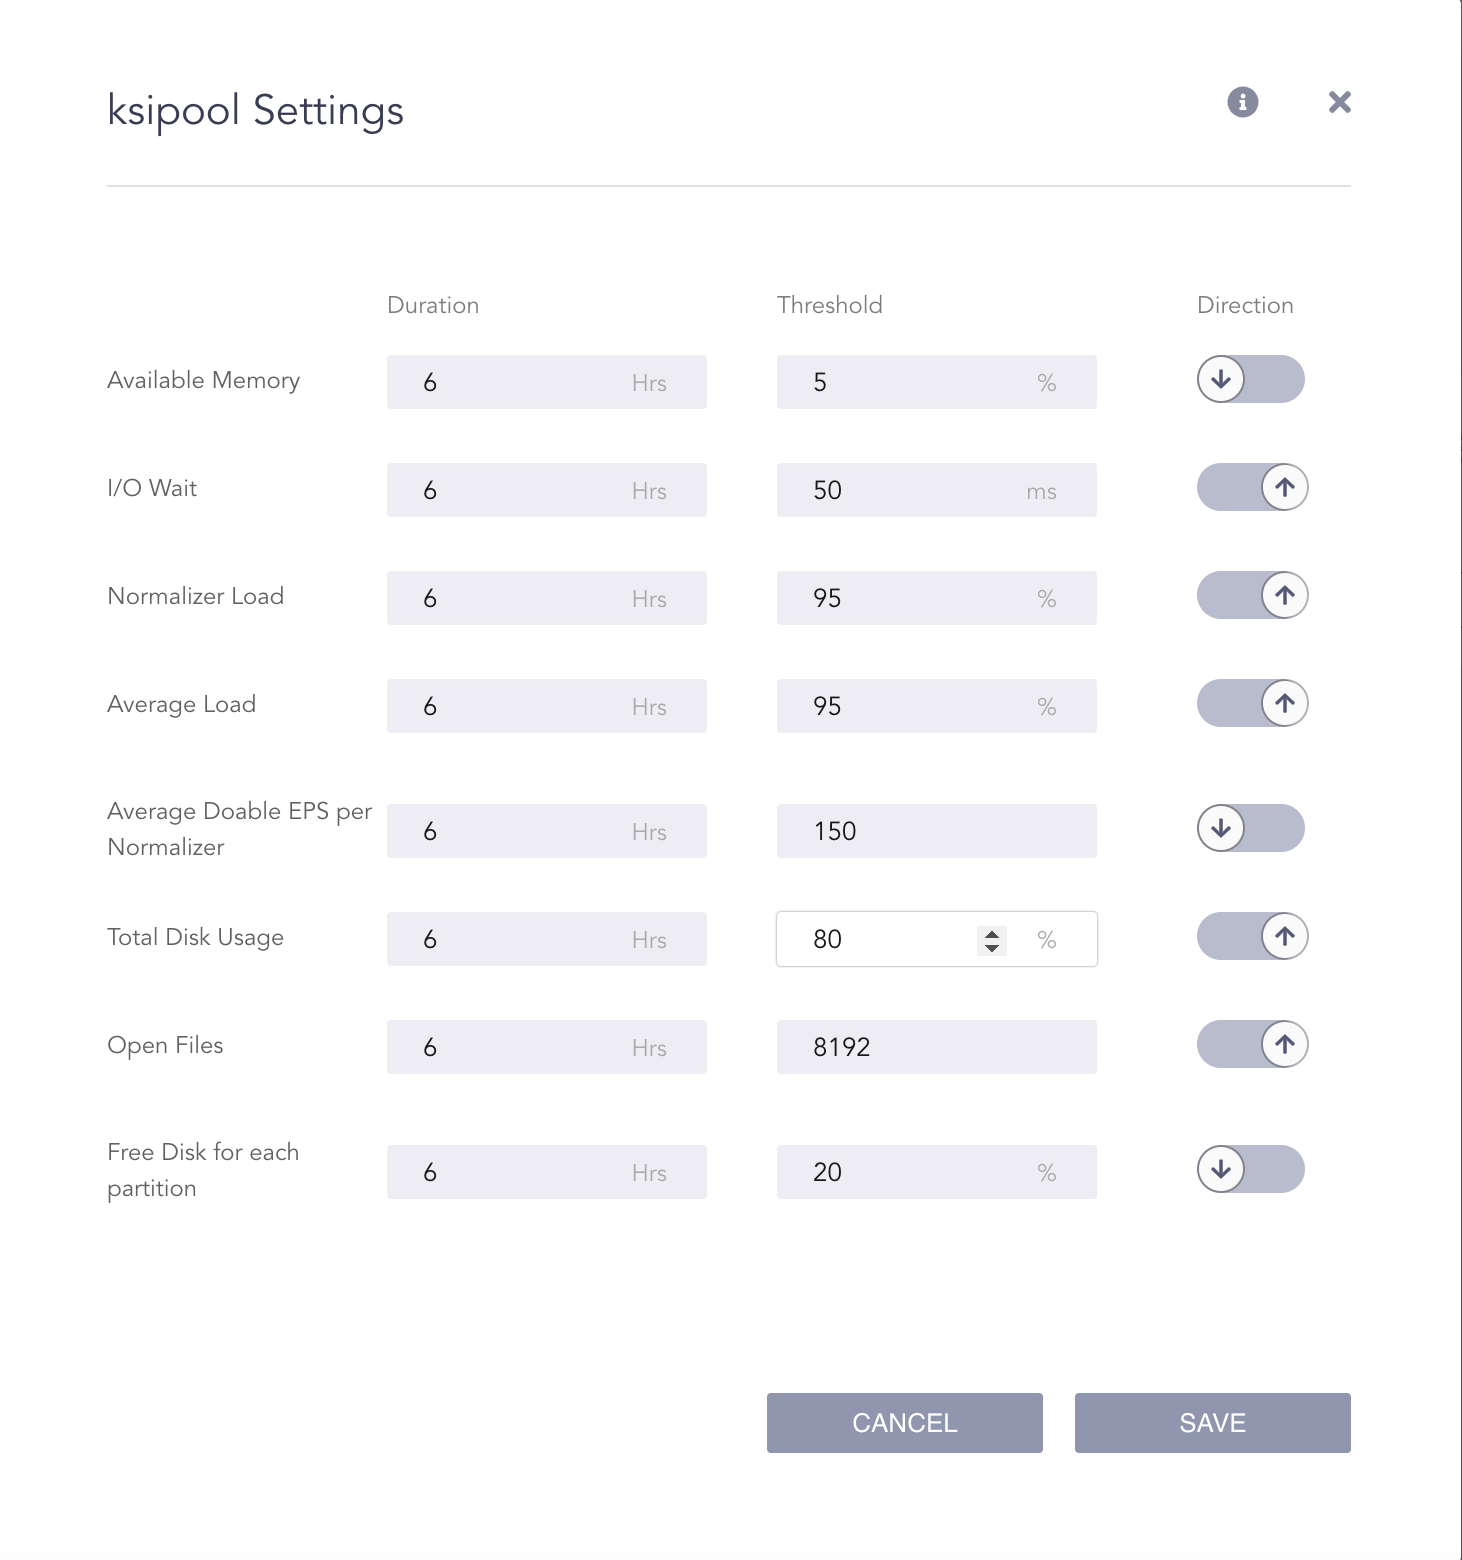
Go to Dashboard.
Click the Configure ( ) icon in the required Pool widget.
Configure Pool Icon
Enter the Duration and the Threshold values, and change the direction of each parameter as required.
Configure Pool Settings
In the screenshot above, the I/O Wait of the Pool becomes unhealthy:
if it is more than 50 ms on average over the last 6 hours or
if it becomes more than 50 ms at any point of time over the last 6 hours.
Similarly, the Available Memory of the pool becomes unhealthy:
if it is less than 5% on average over the last 6 hours or
if it becomes less than 5% at any point of time over the last 6 hours.
Click Save.
Drill-down allows you to track the system and memory status of all the pools and their LogPoint instances.
The LogPoint instances update their data to the Fabric Proxy every five minutes by default. The data is then populated in Director Console and displayed in the form of line graphs and pie charts.
The Drill-down page also includes the tasks status of Director Console. It displays the total count of failed, completed, and pending tasks.
To monitor the visualization of an individual query in a pool:
Go to Dashboard.
Click Drill-down in the required Pool widget.
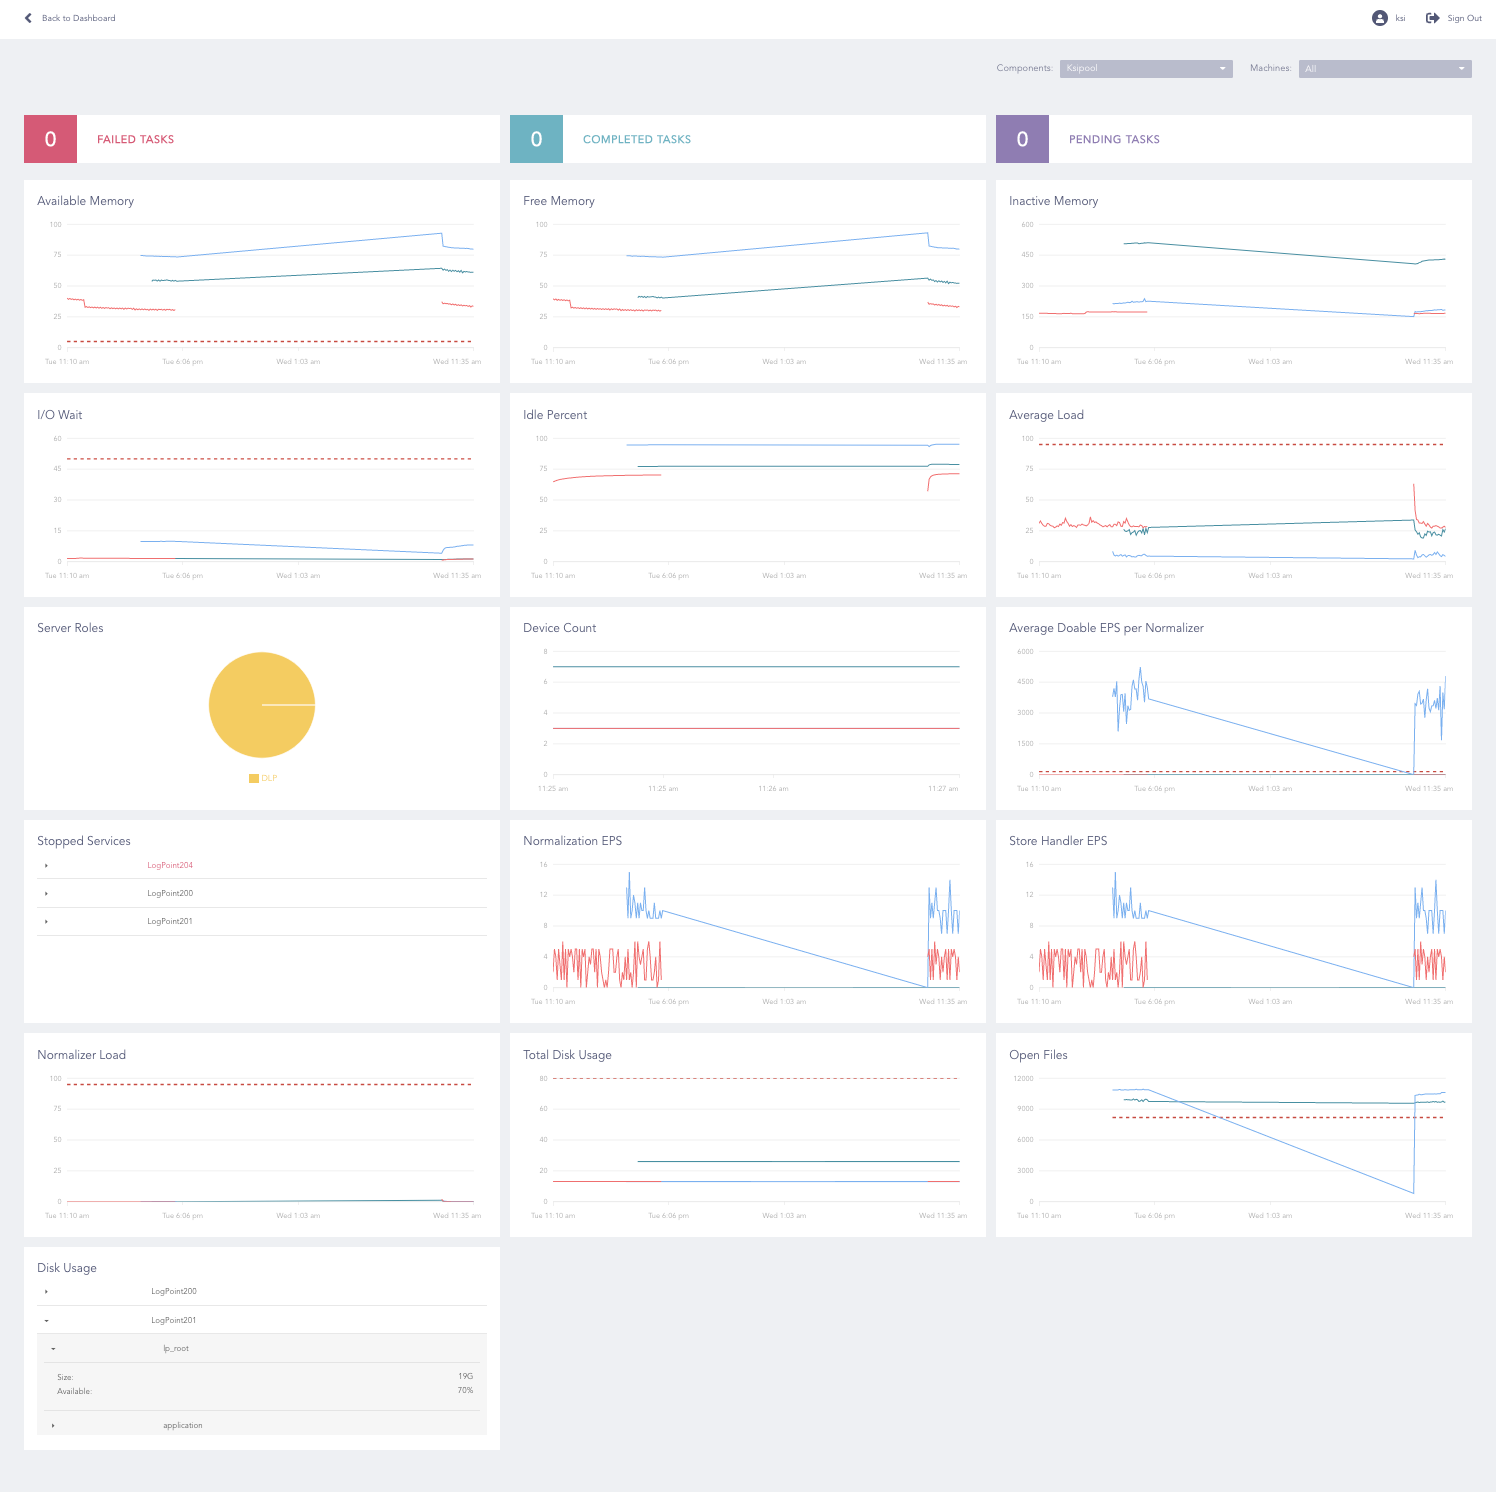
Pool Drill-down Page
Note
The Failed Tasks, Completed Tasks, and Pending Tasks widgets include the data from the last seven days. The other widgets display the information available in the Fabric Proxy.
The values of x and y coordinates change dynamically.
When you select multiple LogPoint instances, each line in the line graph represents a LogPoint.
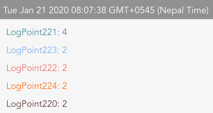
If you hover on a particular point on a chart, a tooltip appears displaying the timestamp values in the chart.
Dashboard Tooltip