Page Contents
- Palo Alto Network Firewall Analytics
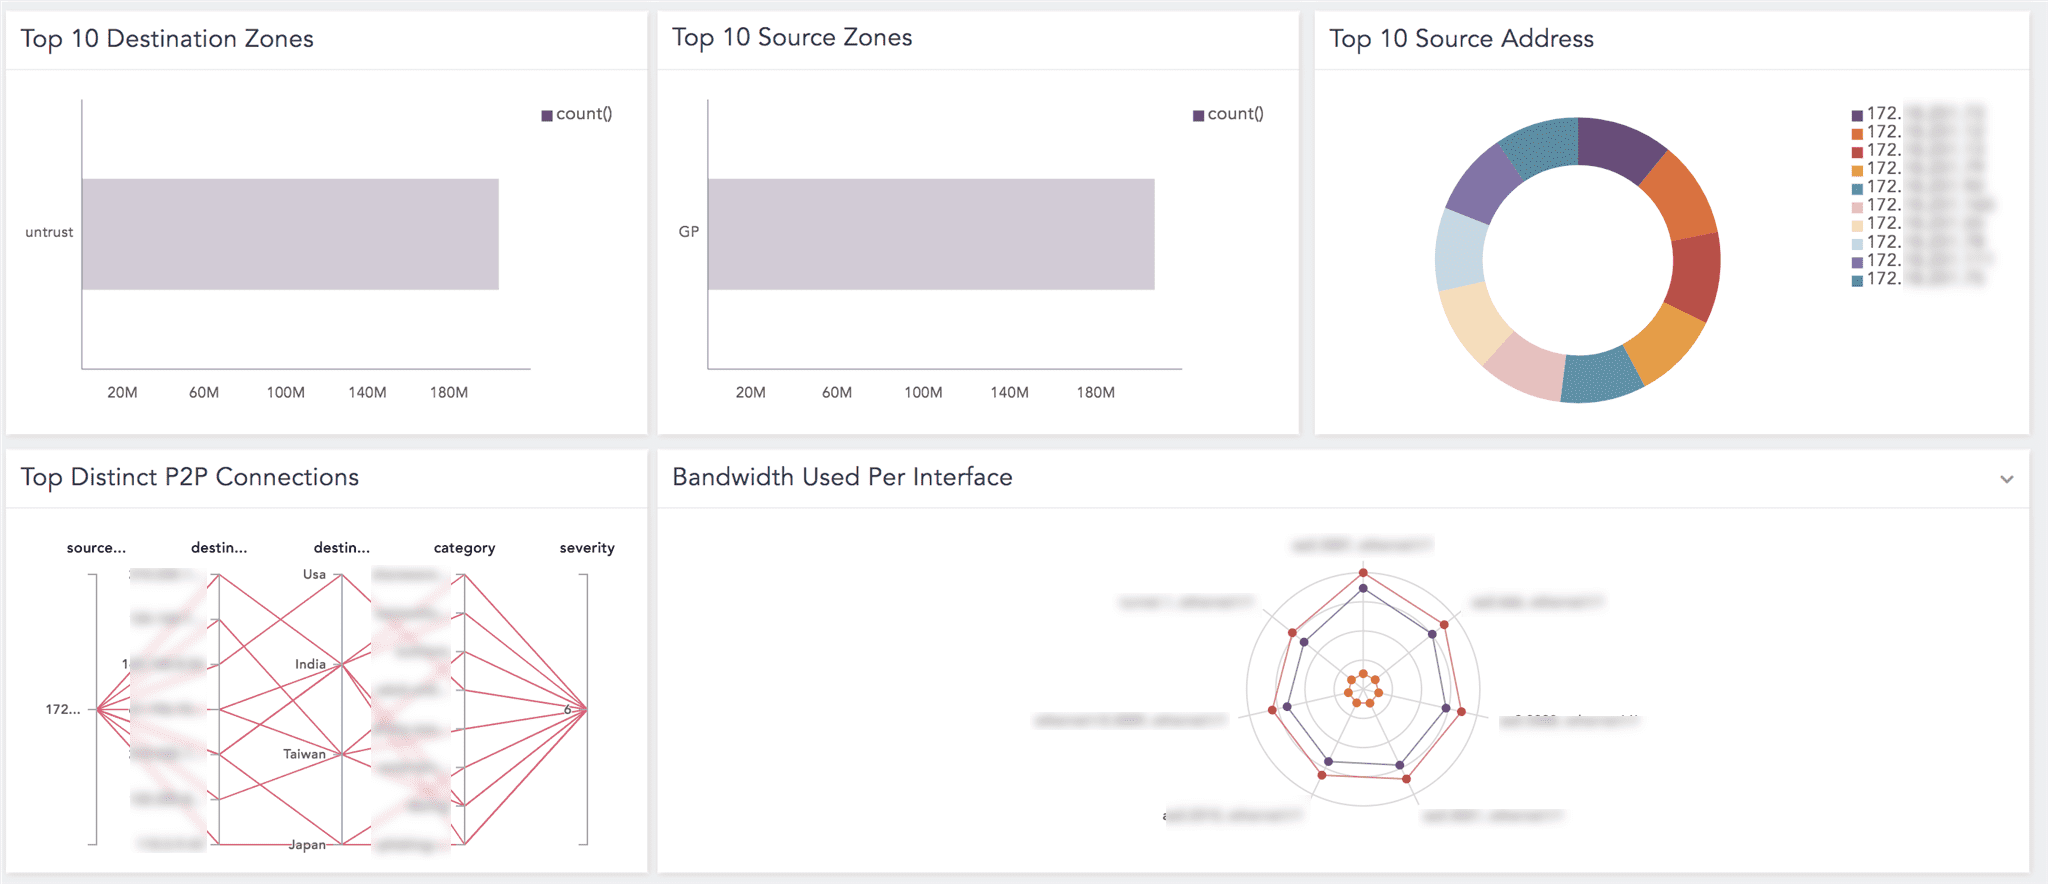
- Palo Alto Network Firewall Dashboards
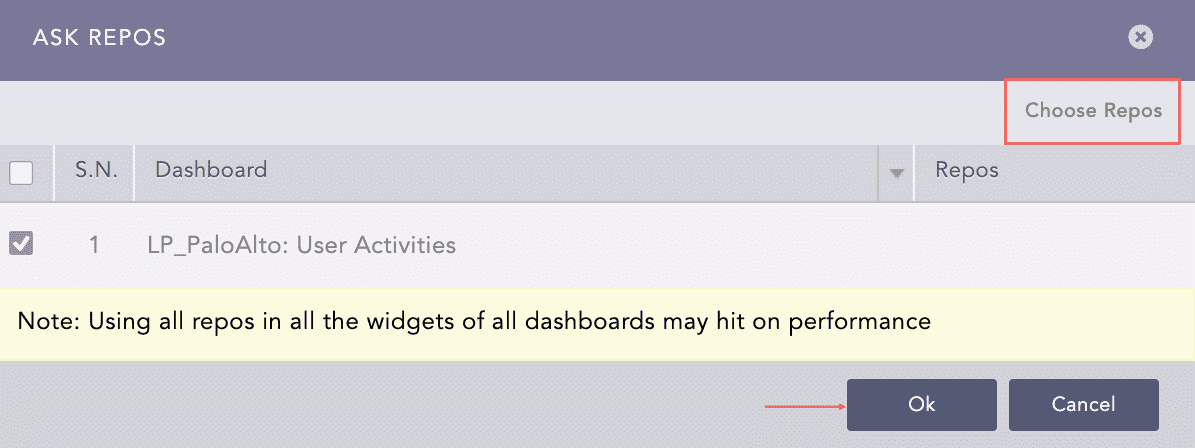
- Adding the Palo Alto Network Firewall Dashboards
- Adding the Palo Alto Network Firewall Label
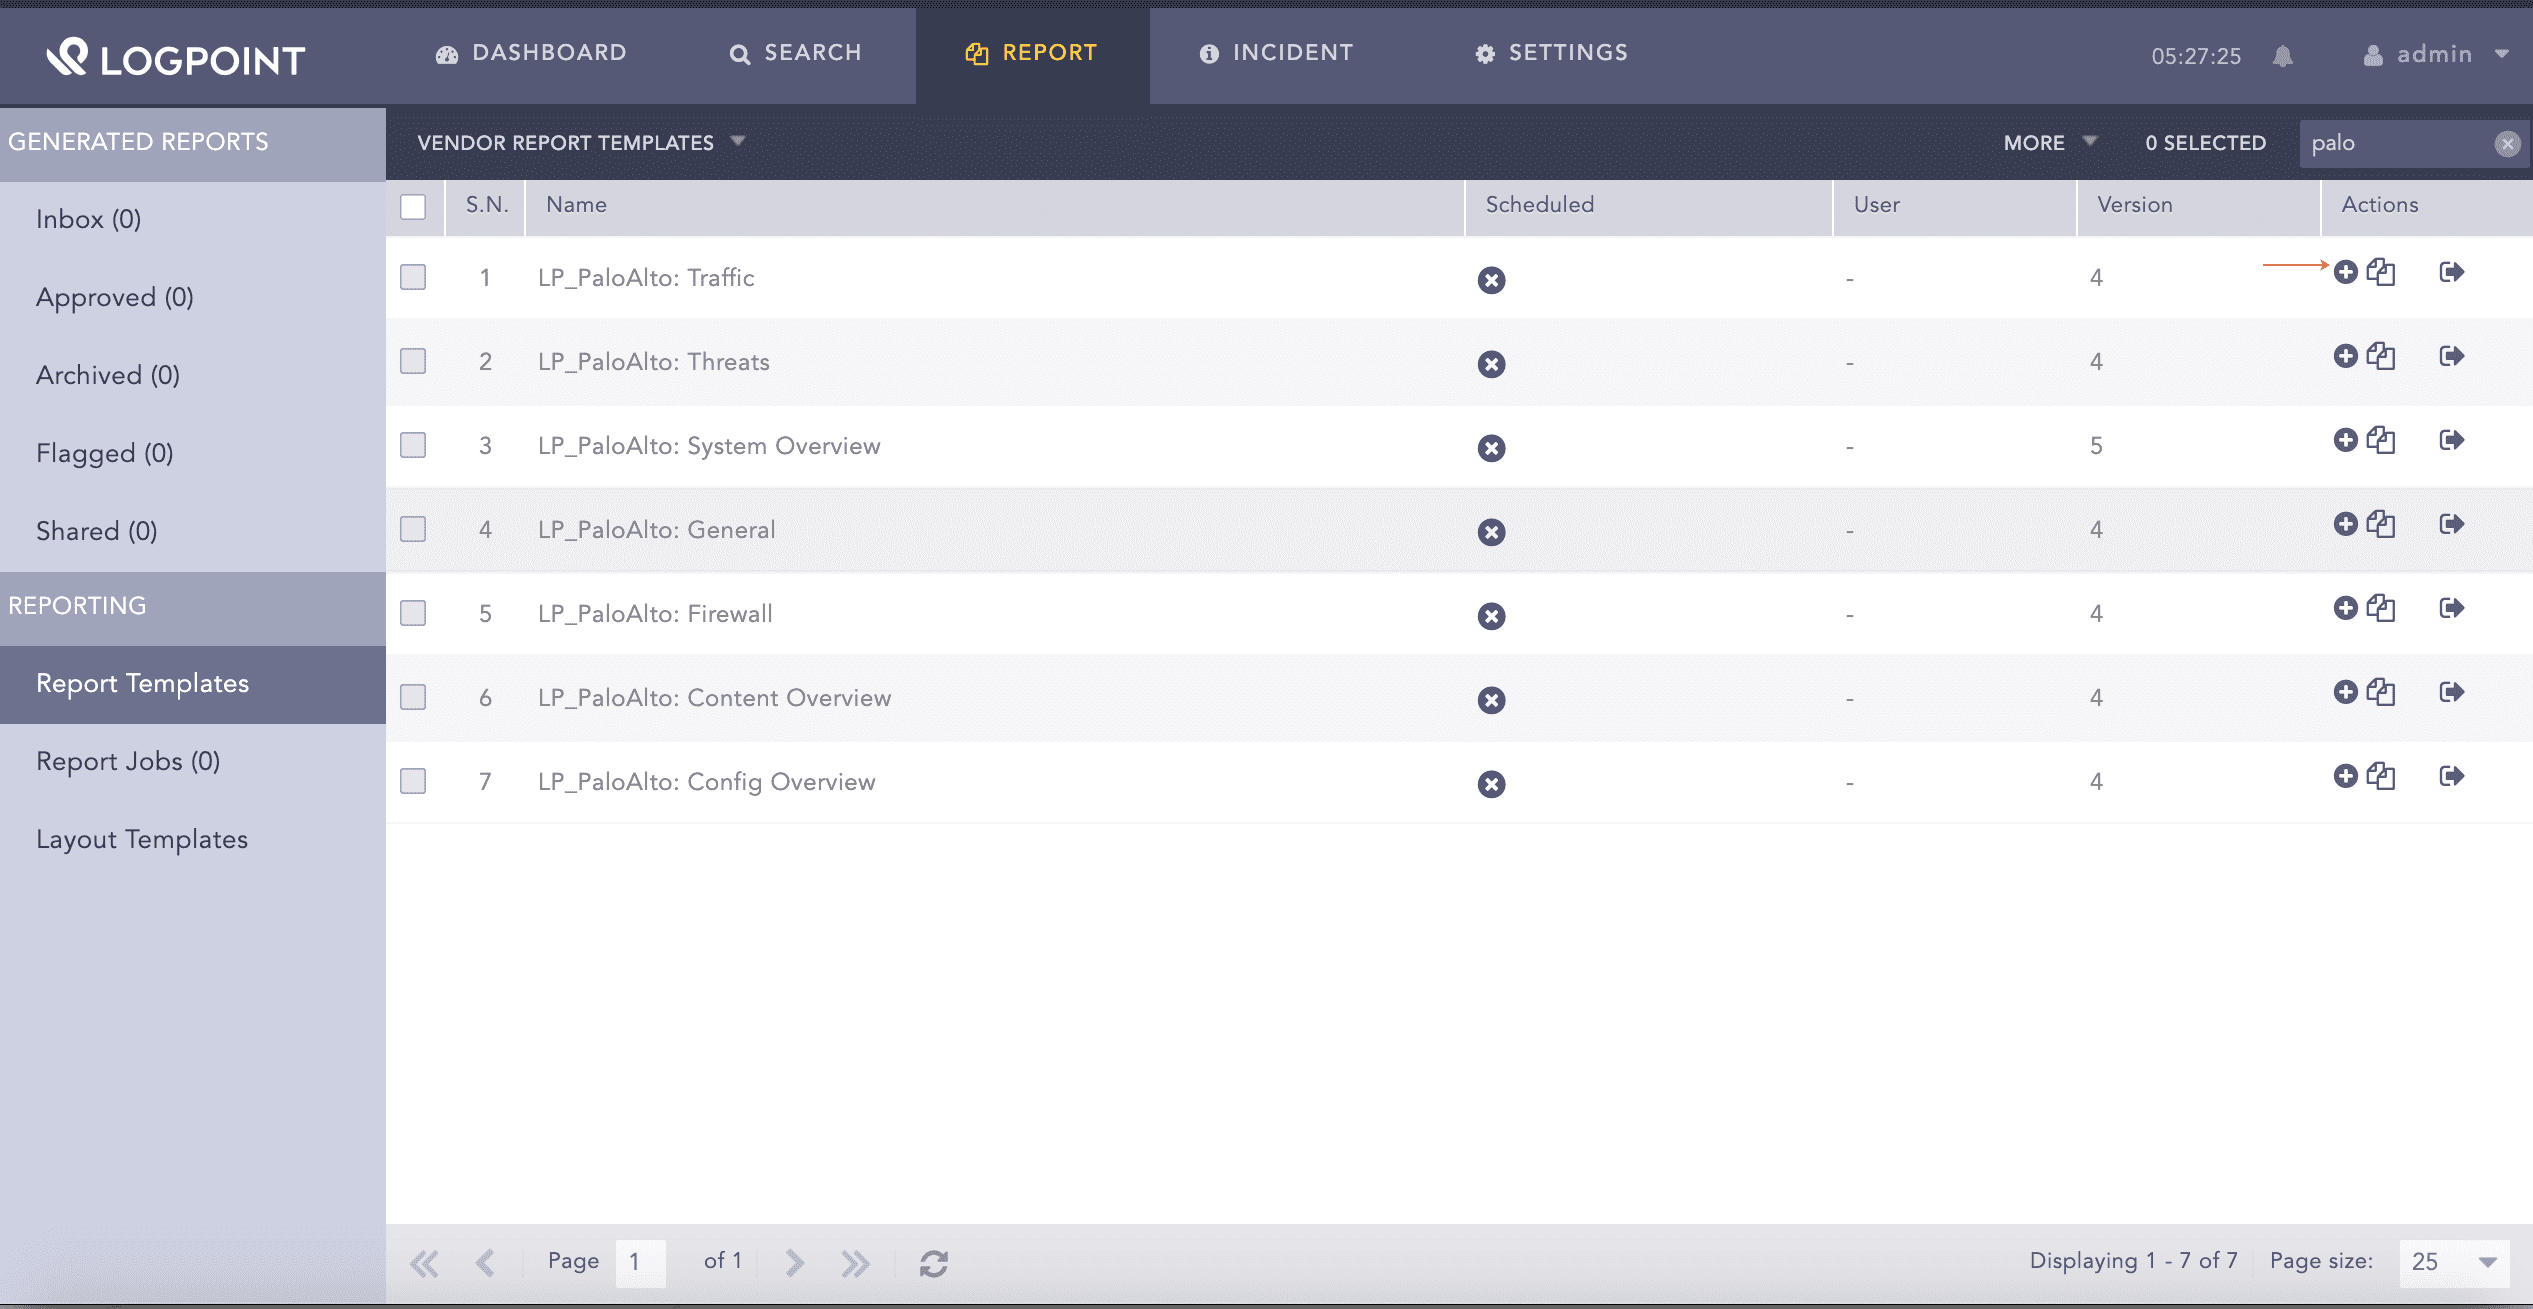
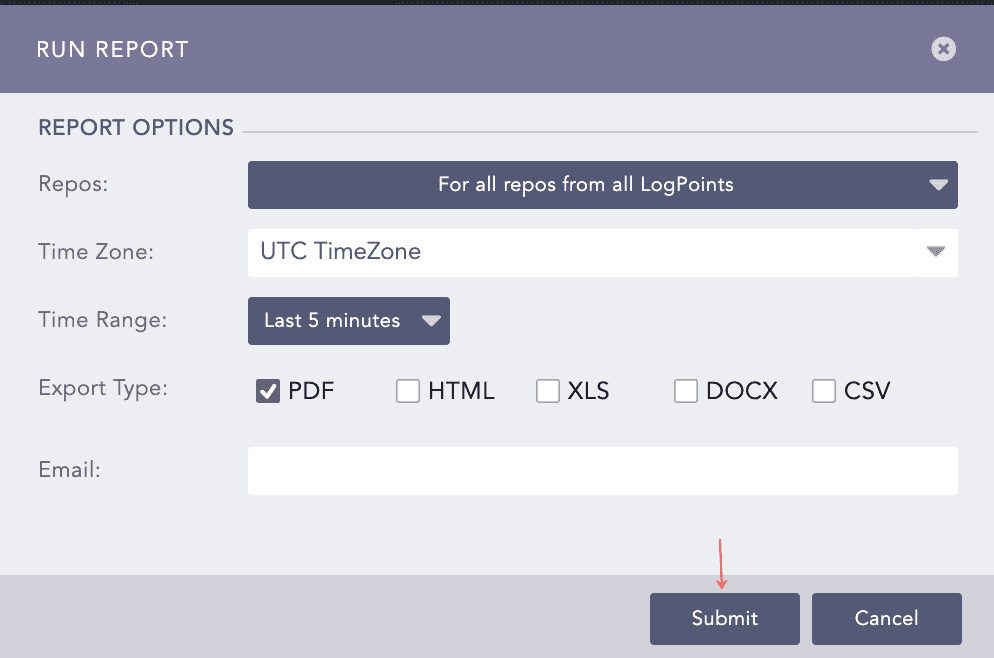
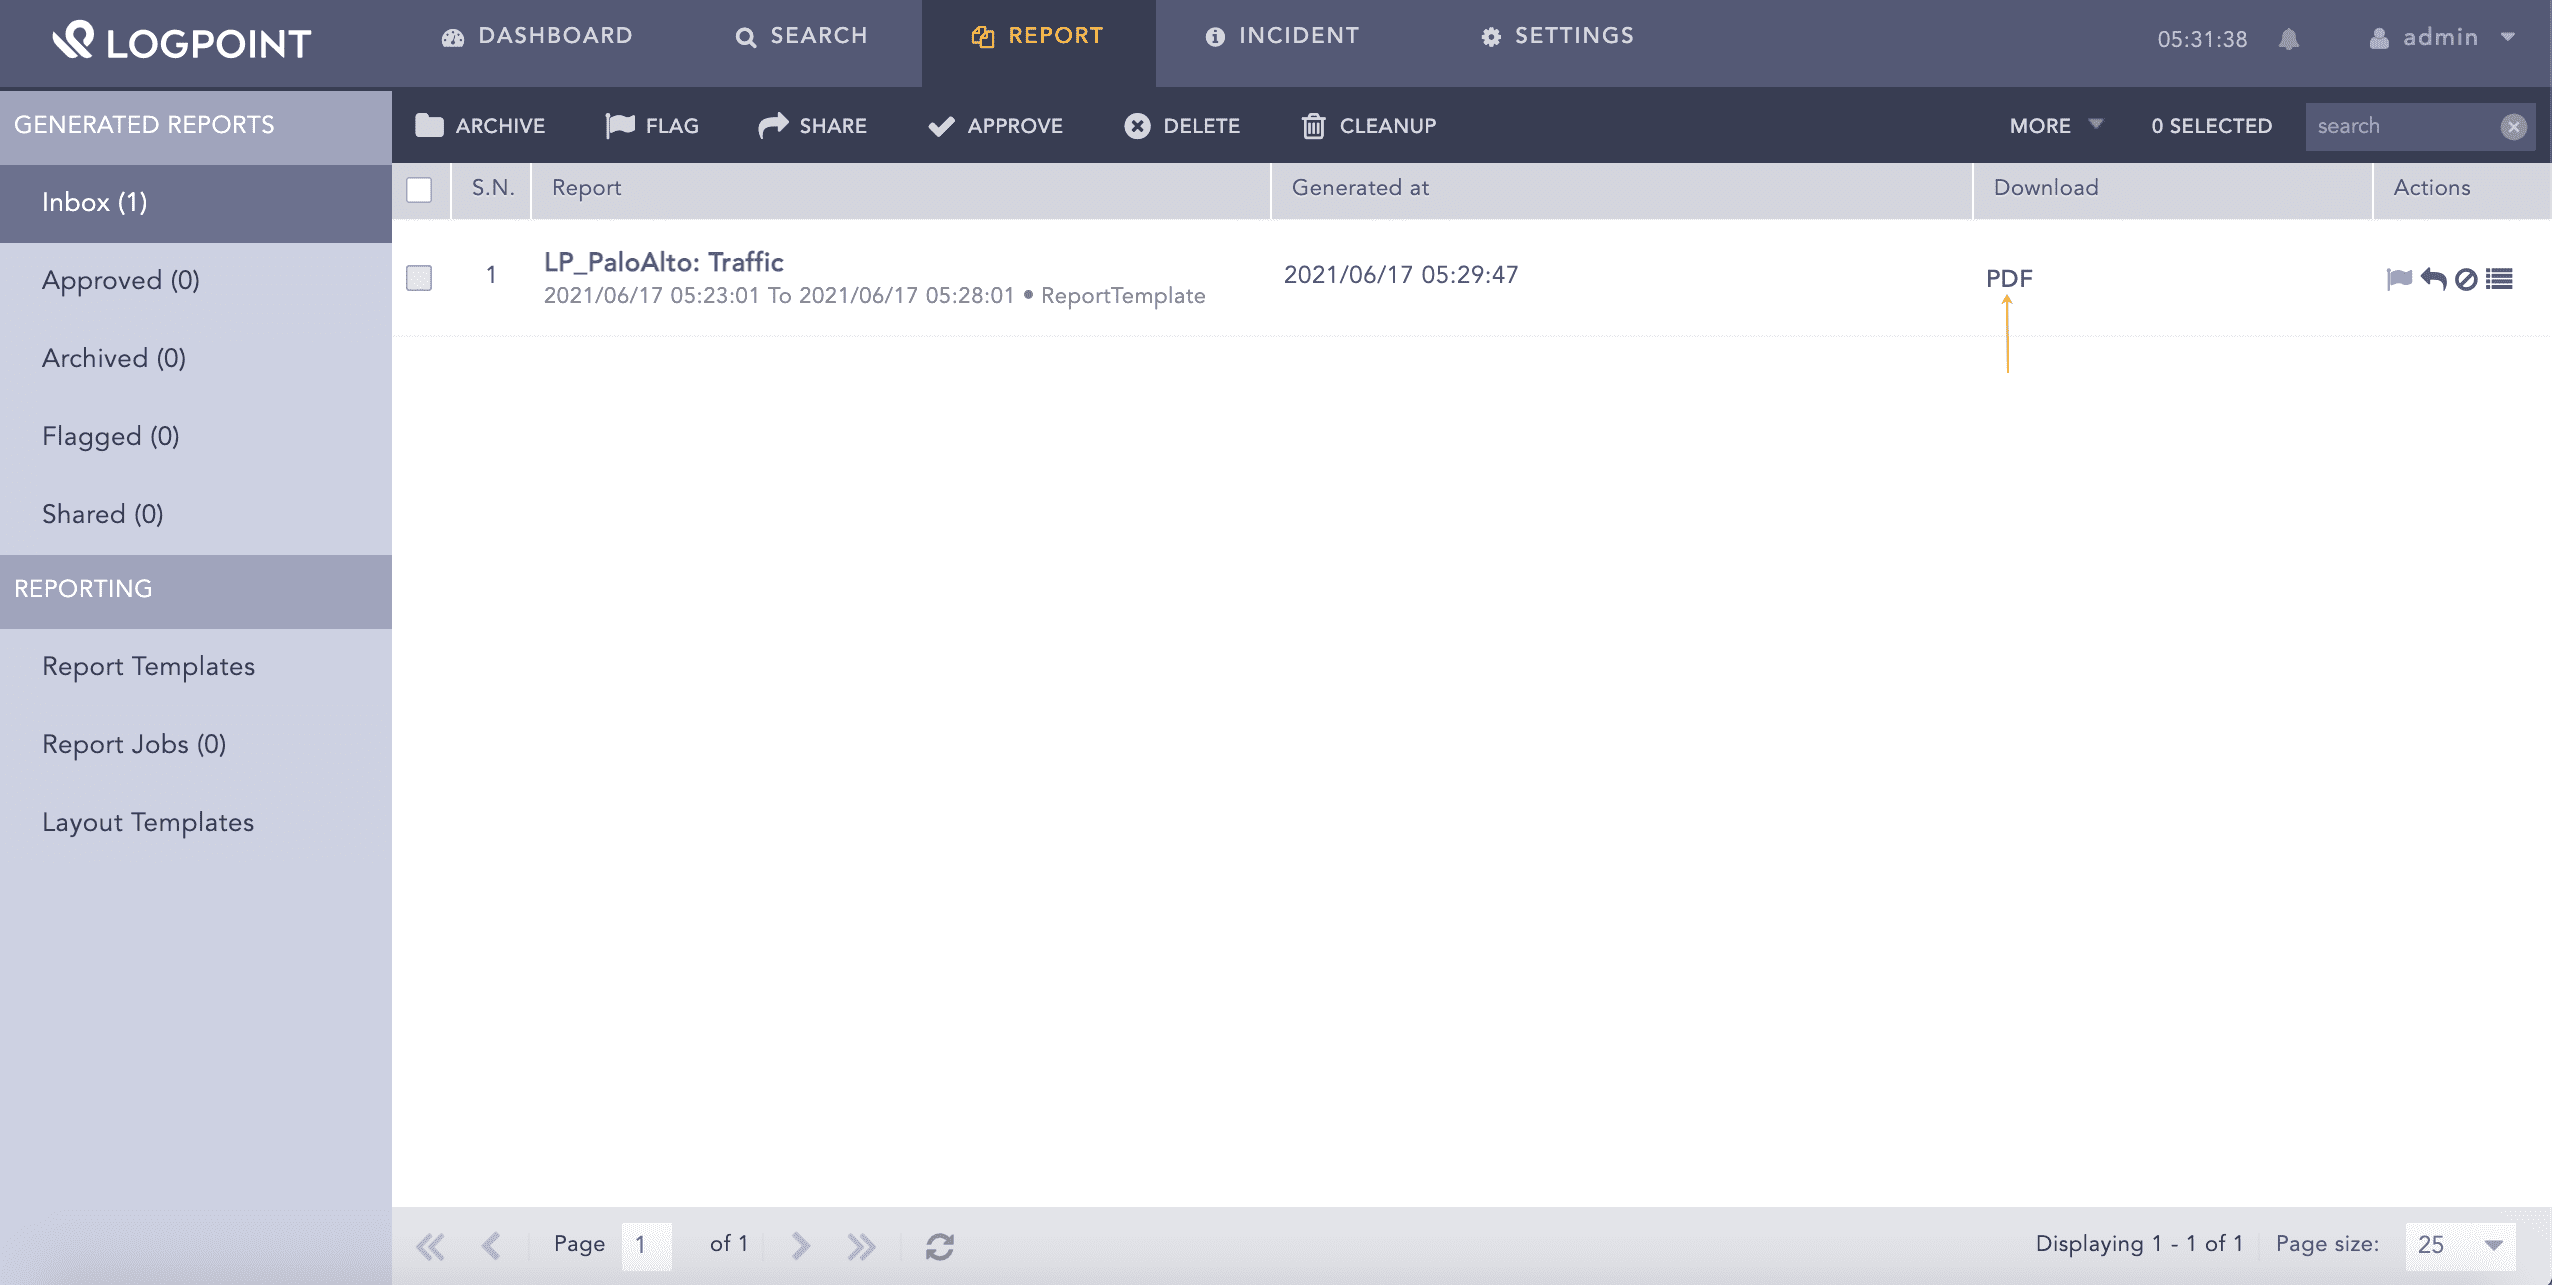
- Using the Palo Alto Network Firewall Report Templates
- Palo Alto Network Firewall Alerts
- LP_PaloAlto Multiple Failed Login
- LP_PaloAlto Session Drop
- LP_PaloAlto Potential Risk Activity
- LP_PaloAlto Risk Events Allowed
- LP_PaloAlto Potential C2 Connection
- LP_PaloAlto Illegal Content Download
- LP_PaloAlto HTTP Request Block
- LP_PaloAlto Flooding Packet Drop
- LP_PaloAlto DNS SinkHole Activate
- LP_PaloAlto Cortex Risk Events Unrestricted
- LP_PaloAlto Bypass Content Filter
- LP_PaloAlto Brute Force on Block Override
- LP_PaloAlto Brute Force Attempts