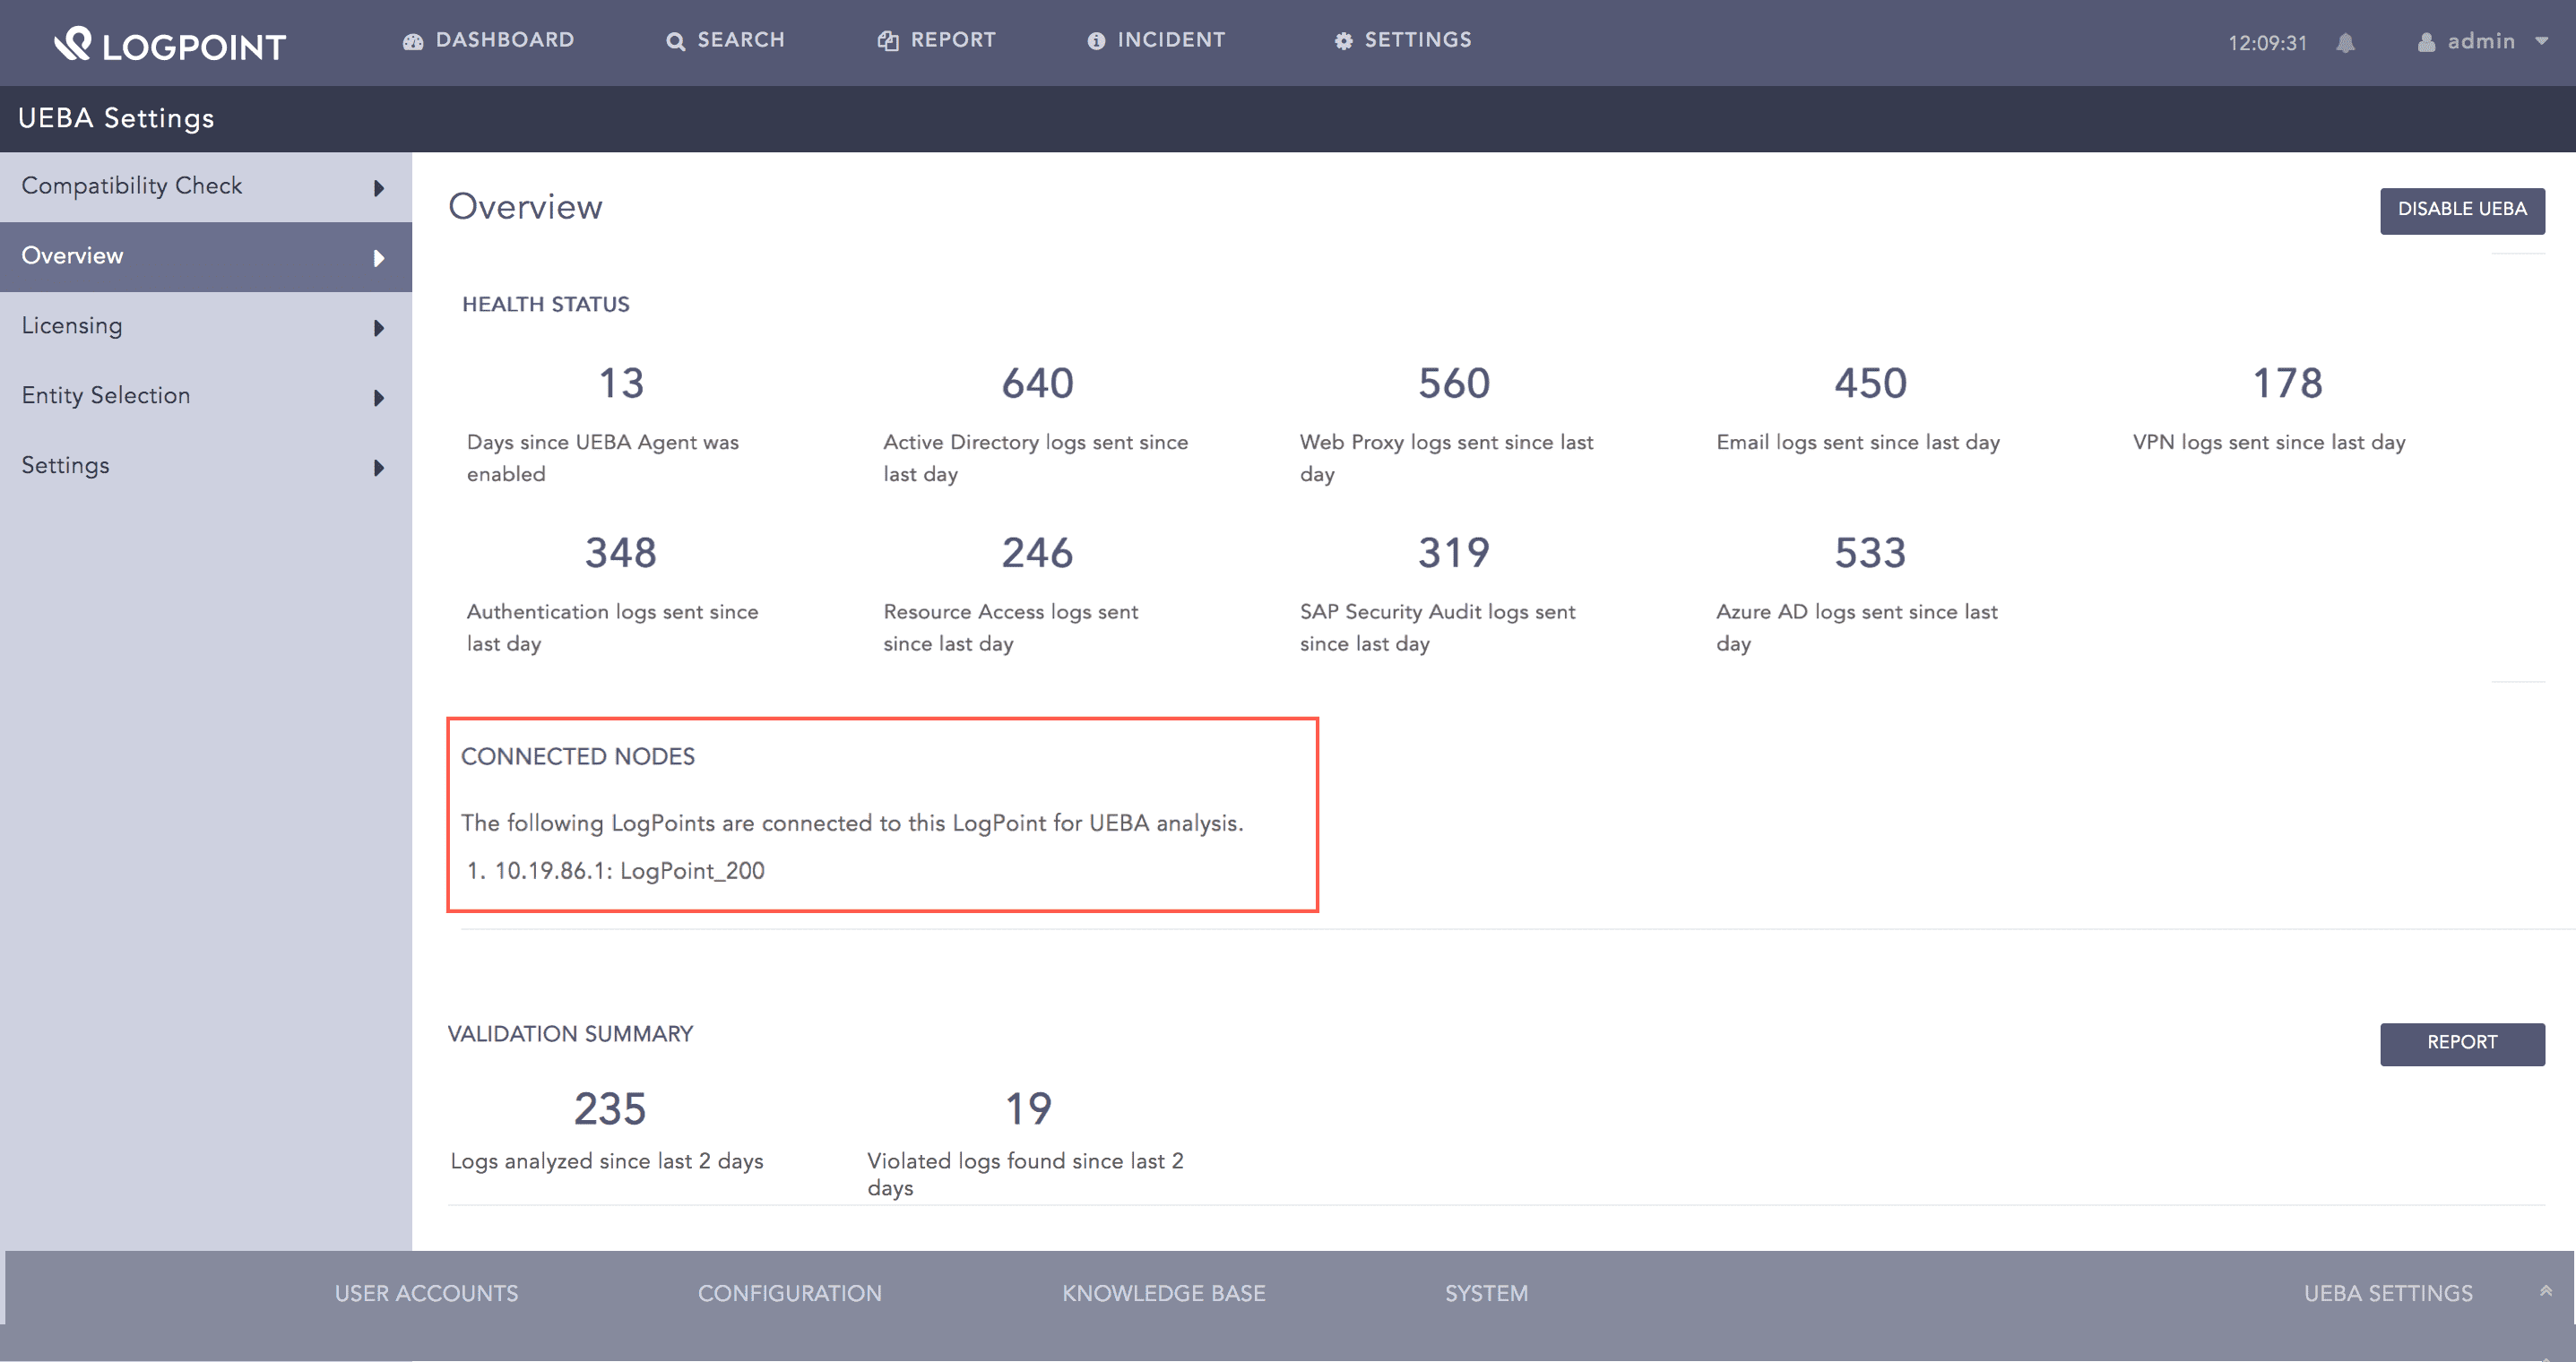
You can use Overview to enable UEBA, check the health status of the system, and see which Distributed Logpoints are connected to the Search Head for UEBA analysis. Logpoint communicates with the IP through the Search Head, even when you have two or more public IPs.
Important
Disabling UEBA or license expiration won’t delete selected entities and repositories. They’ll remain unchanged if you enable UEBA again or renew the license.
To use UEBA, you need to enable it.
If you have enabled it but have not purchased a license, click the UEBA icon to view information about it. You can also use Book a Demo if you want to watch and understand how UEBA works.
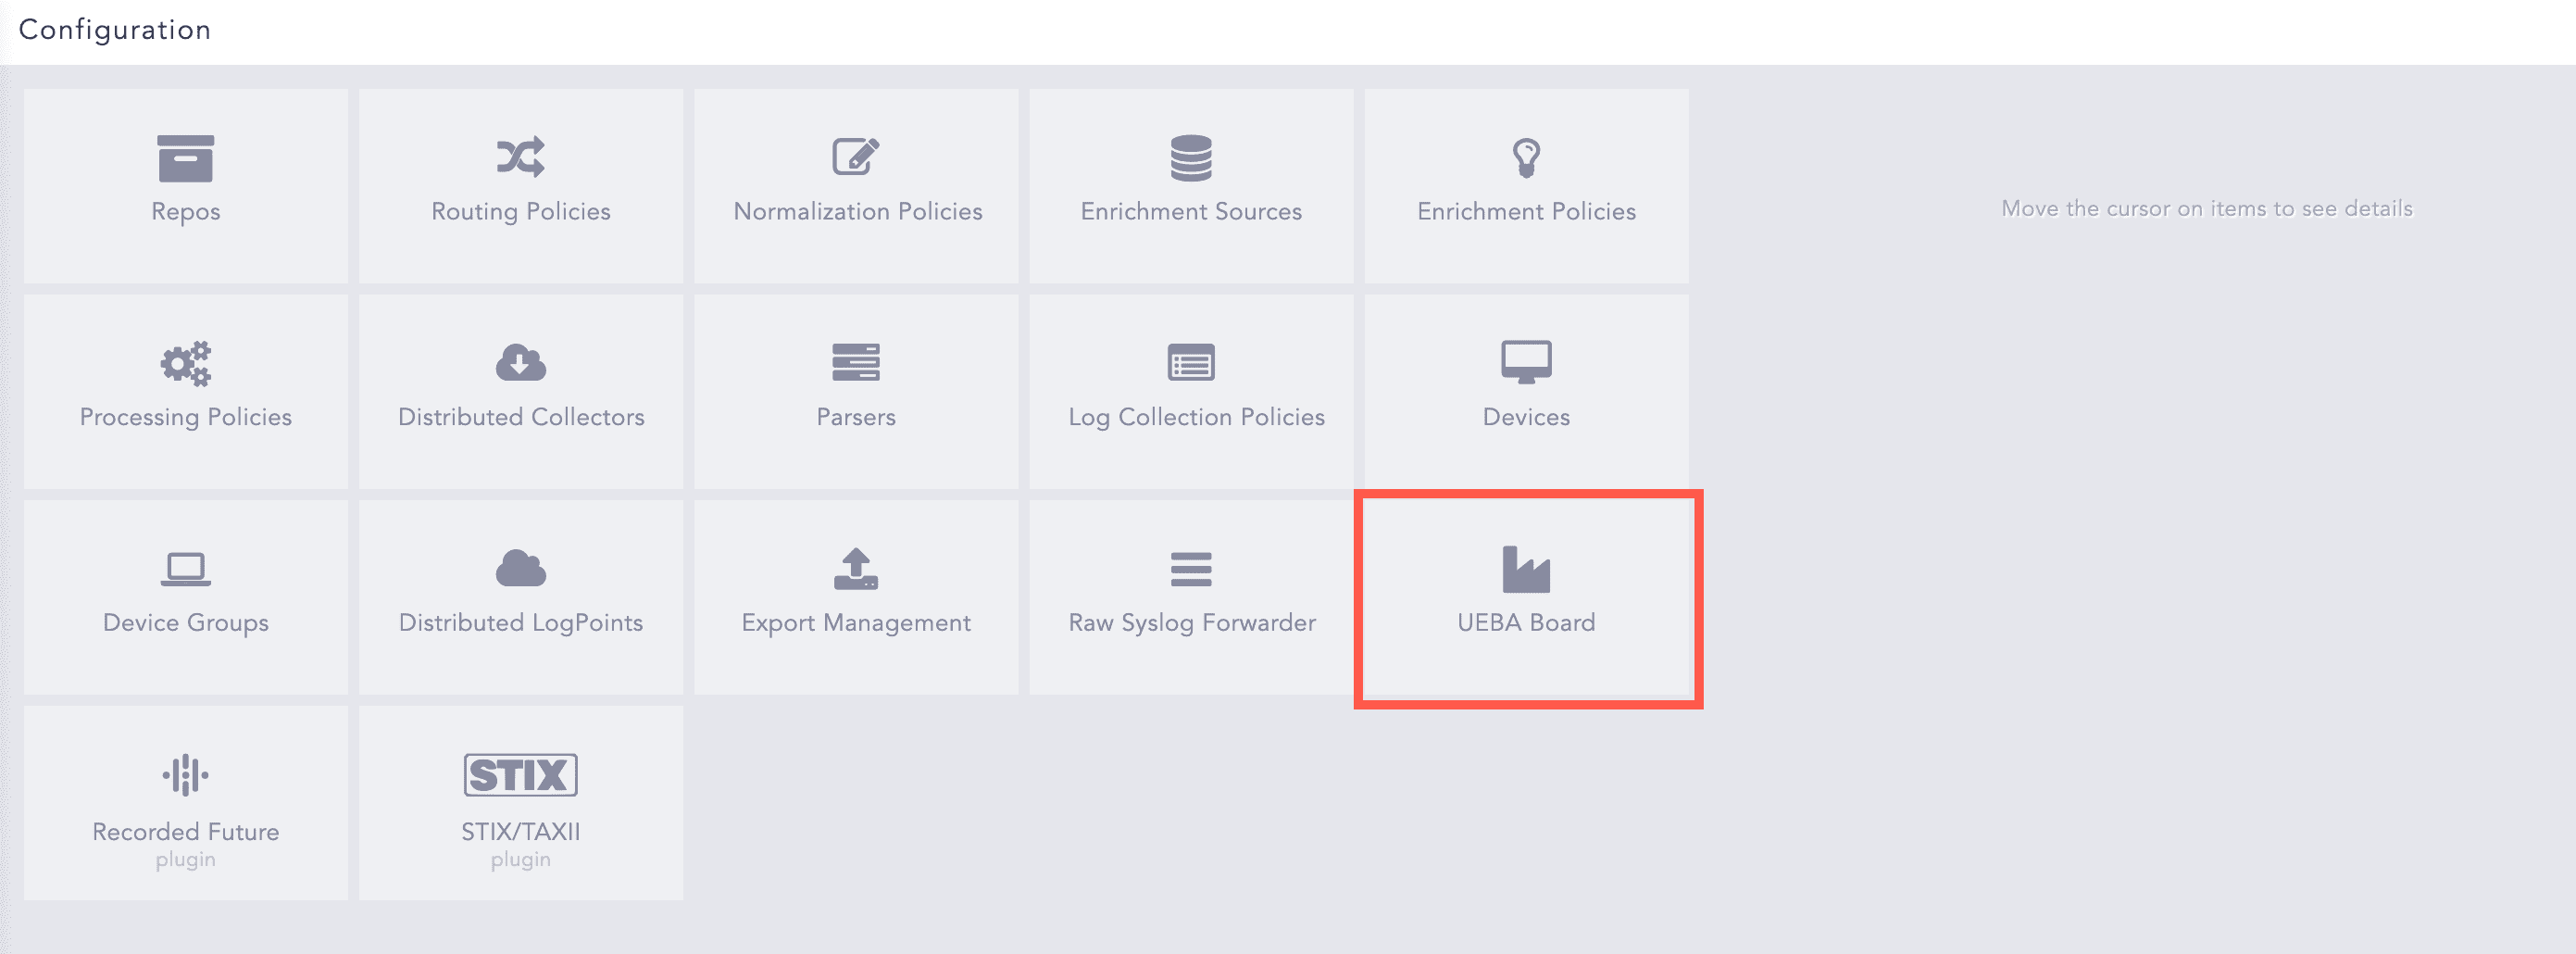
Go to Settings >> Configuration from the navigation bar and click UEBA Board.
UEBA Board
Click Overview.
Click Enable UEBA.
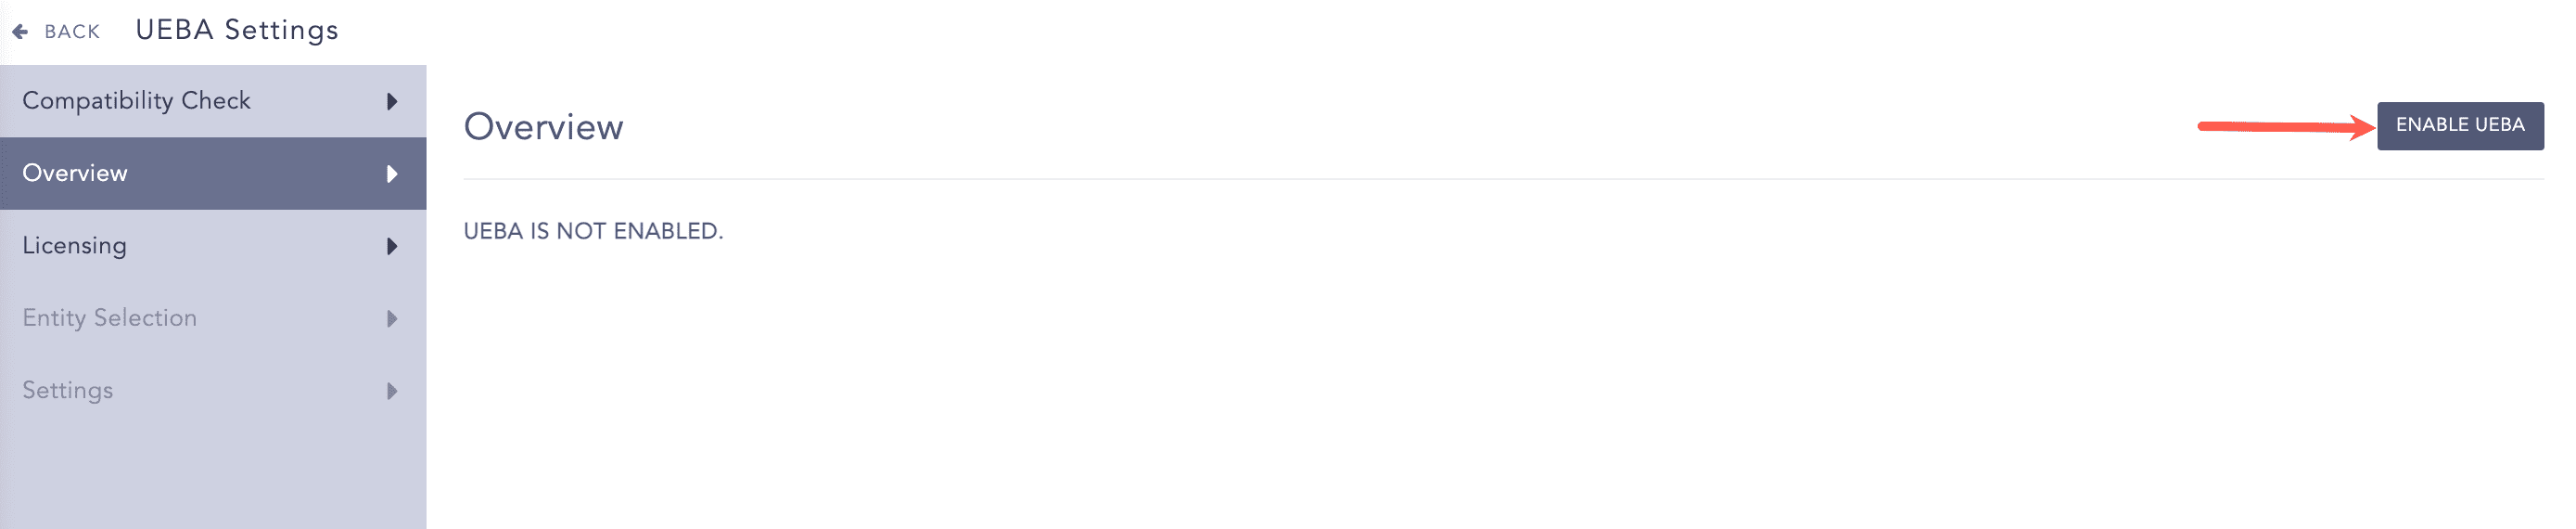
Enabling UEBA
Click Yes.
After enabling UEBA, you need to make sure Logpoint system settings use or apply the log timestamp. Go to System Settings for more details.
Go to Settings >> Configuration from the navigation bar and click UEBA Board.
Click Overview.
Click Disable UEBA.
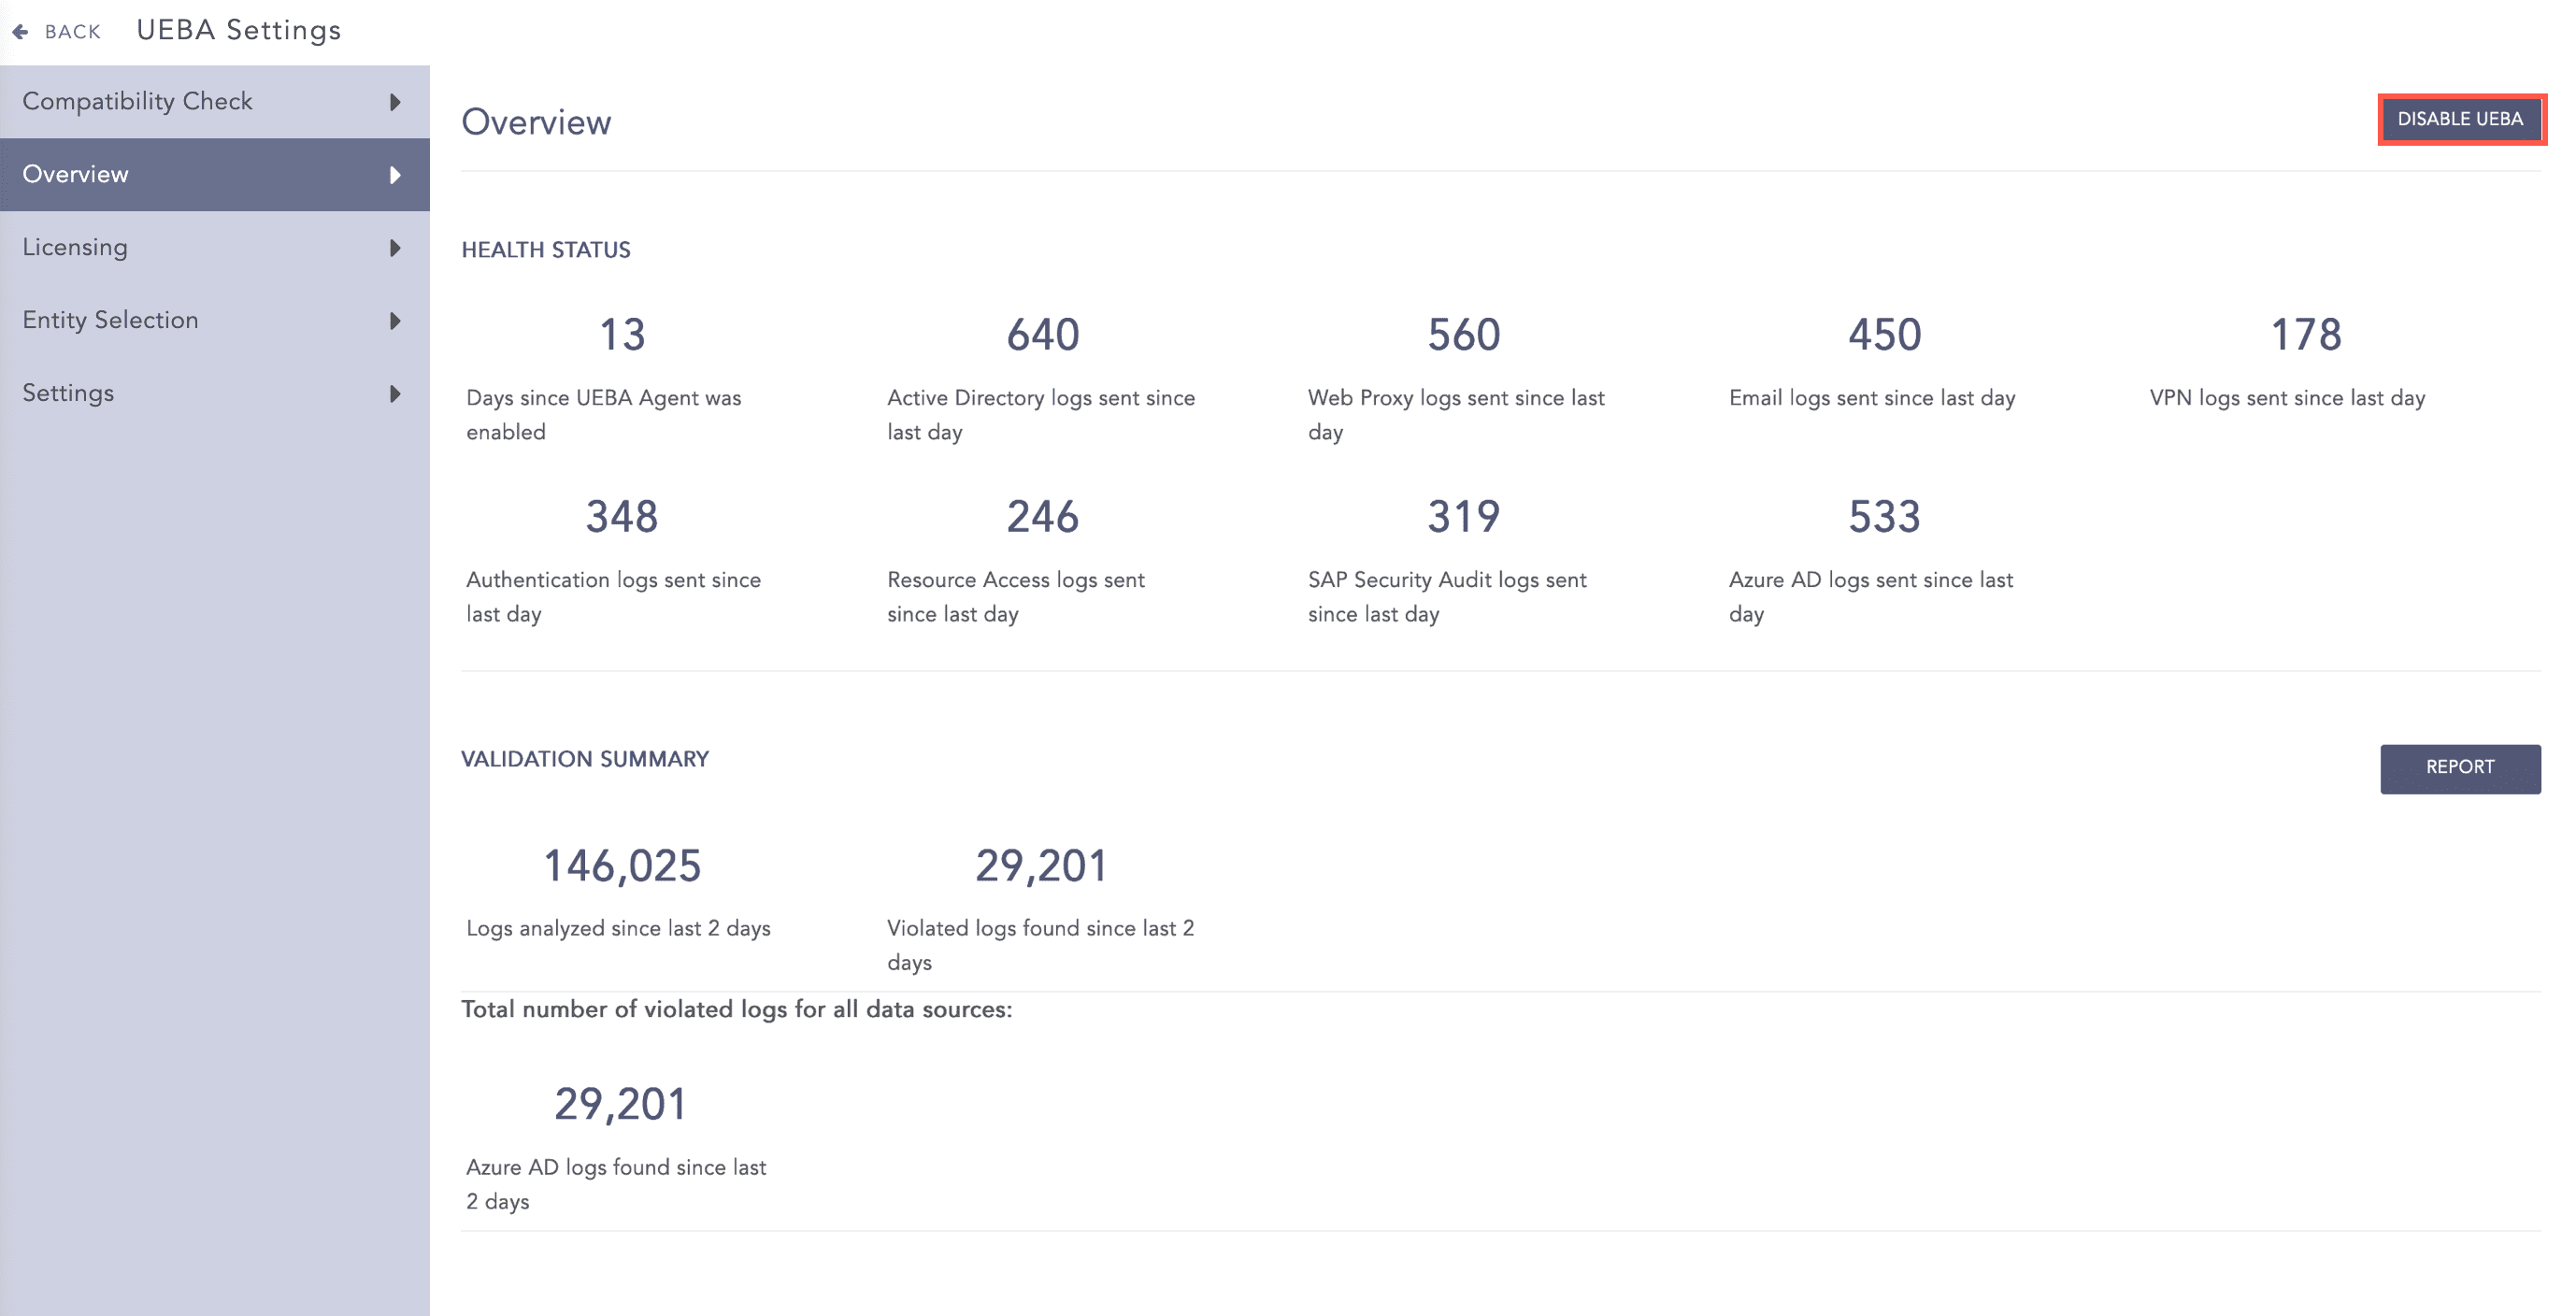
Disabling UEBA
Click Yes.
Health Status contains the number of:
Days UEBA is used or active.
Active Directory logs sent in the last 24 hours.
Web proxy logs sent in the last 24 hours.
Email logs sent in the last 24 hours.
VPN logs sent in the last 24 hours.
Authentication logs sent in the last 24 hours.
Resource access logs sent in the last 24 hours.
SAP security audit logs sent in the last 24 hours.
Azure AD logs sent for in the last 24 hours.
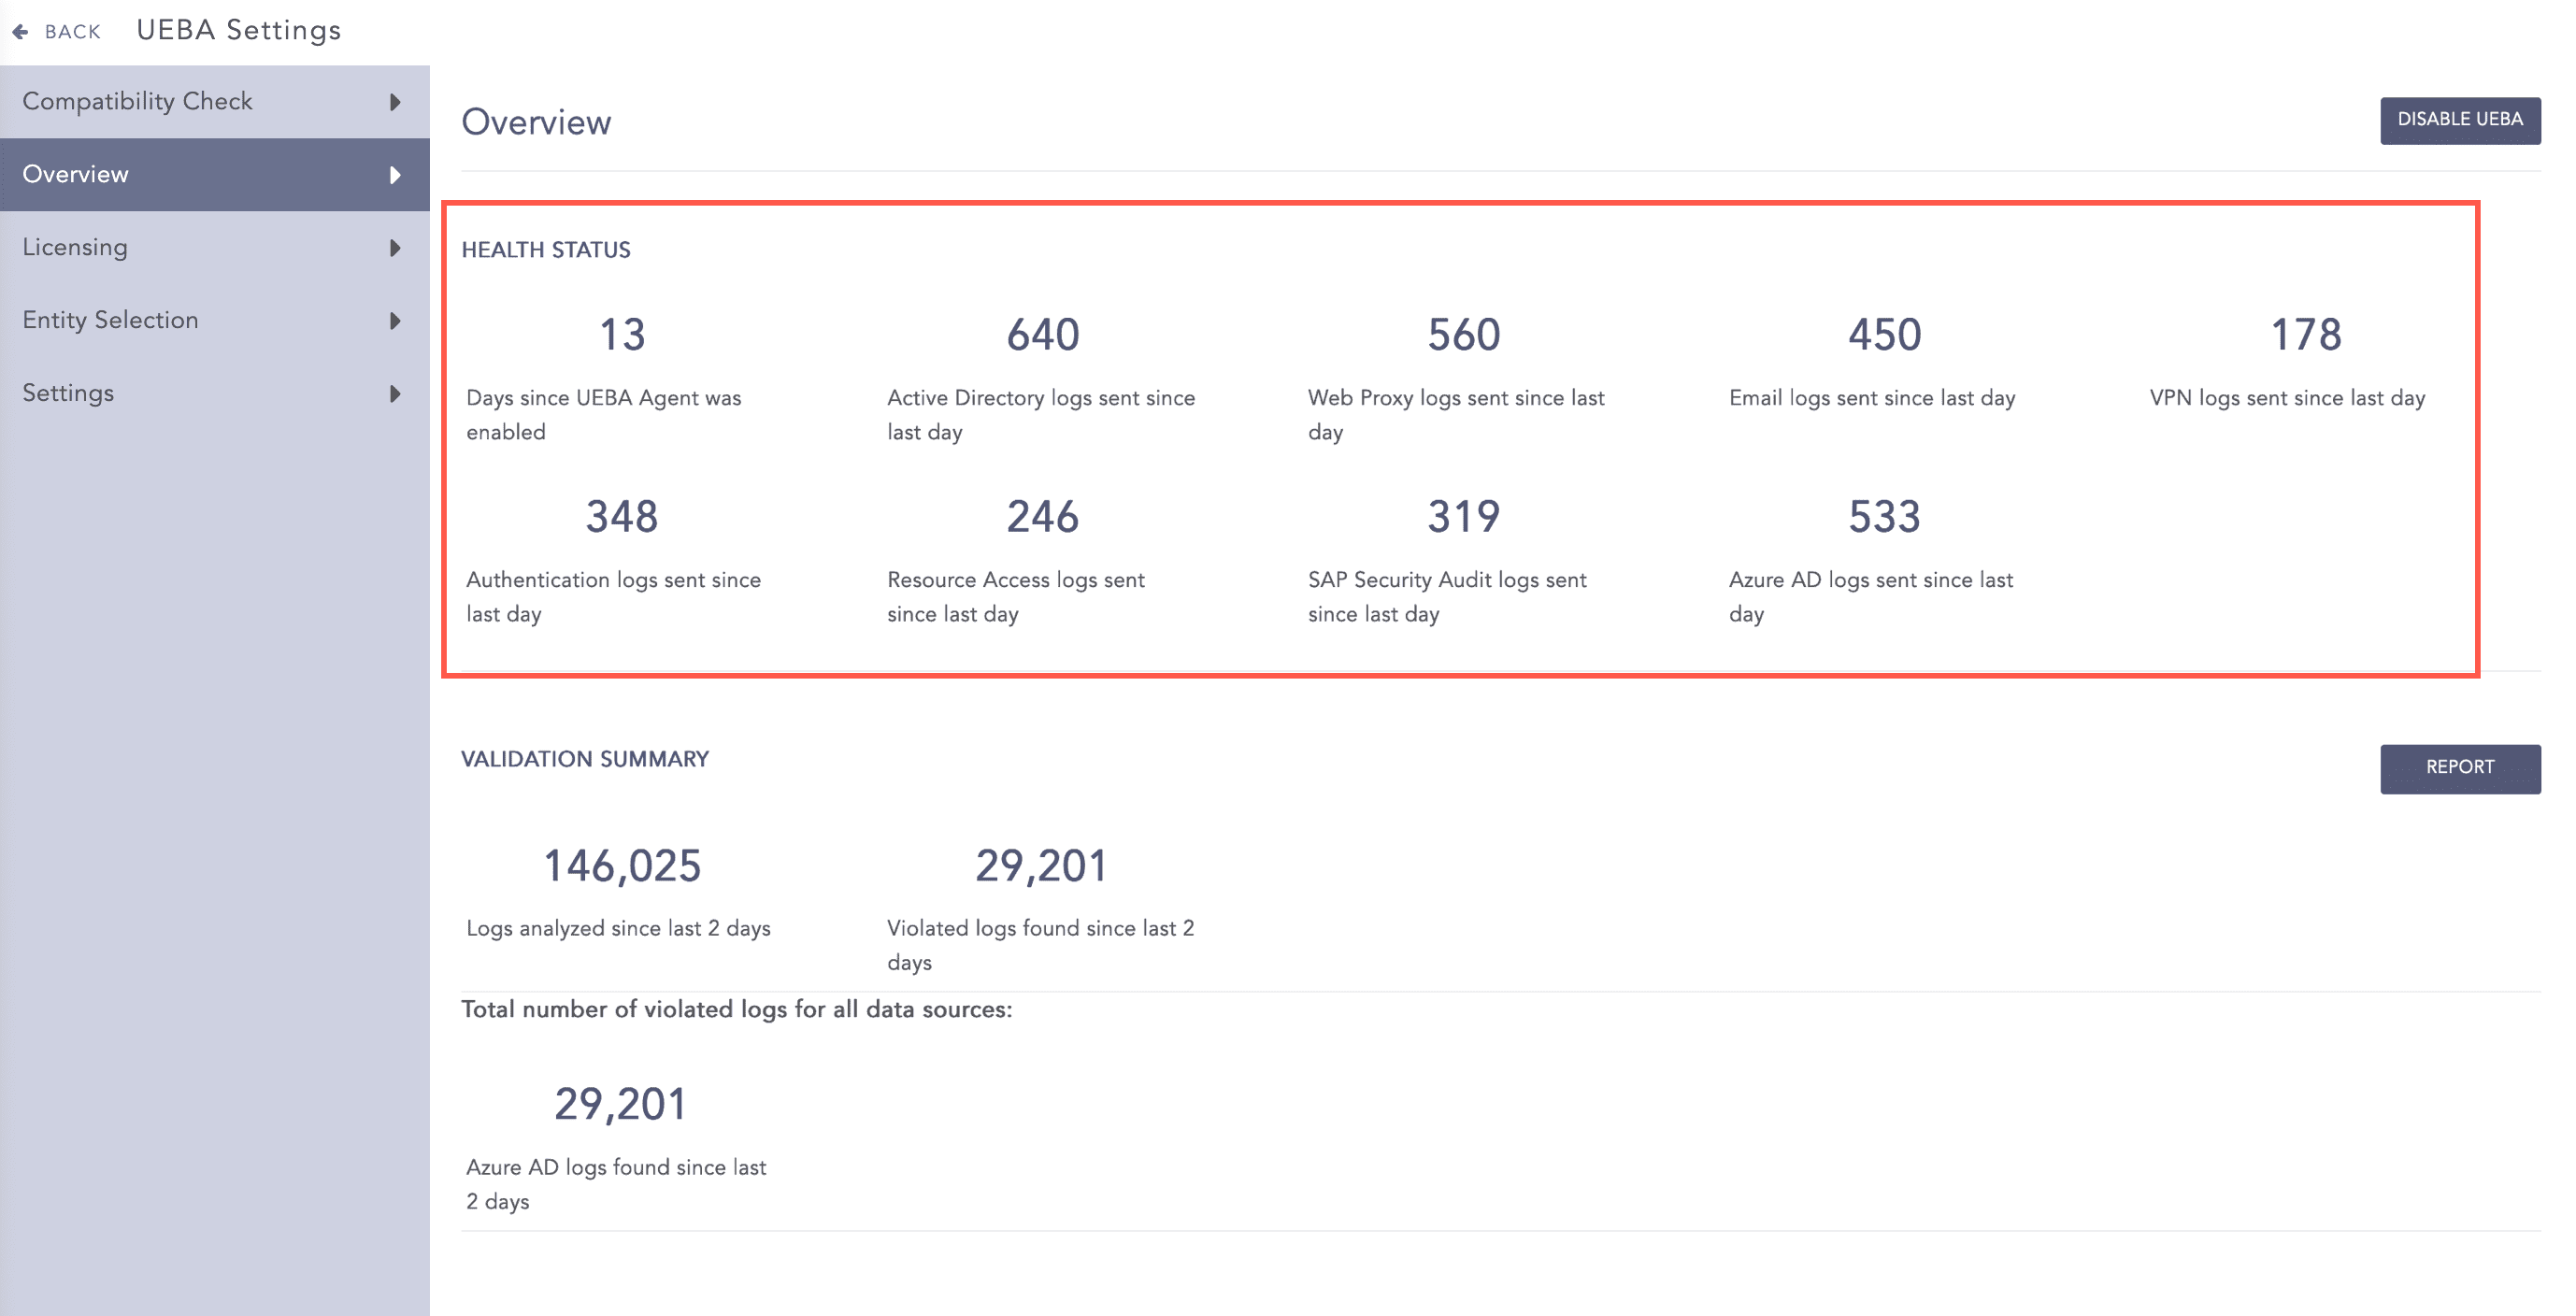
Health Status
Validation Summary displays the total number of:
Historical and real-time logs analyzed for data validation in the past two days.
Invalid logs detected in the past two days while running the validation.
Invalid logs found according to the different data sources.
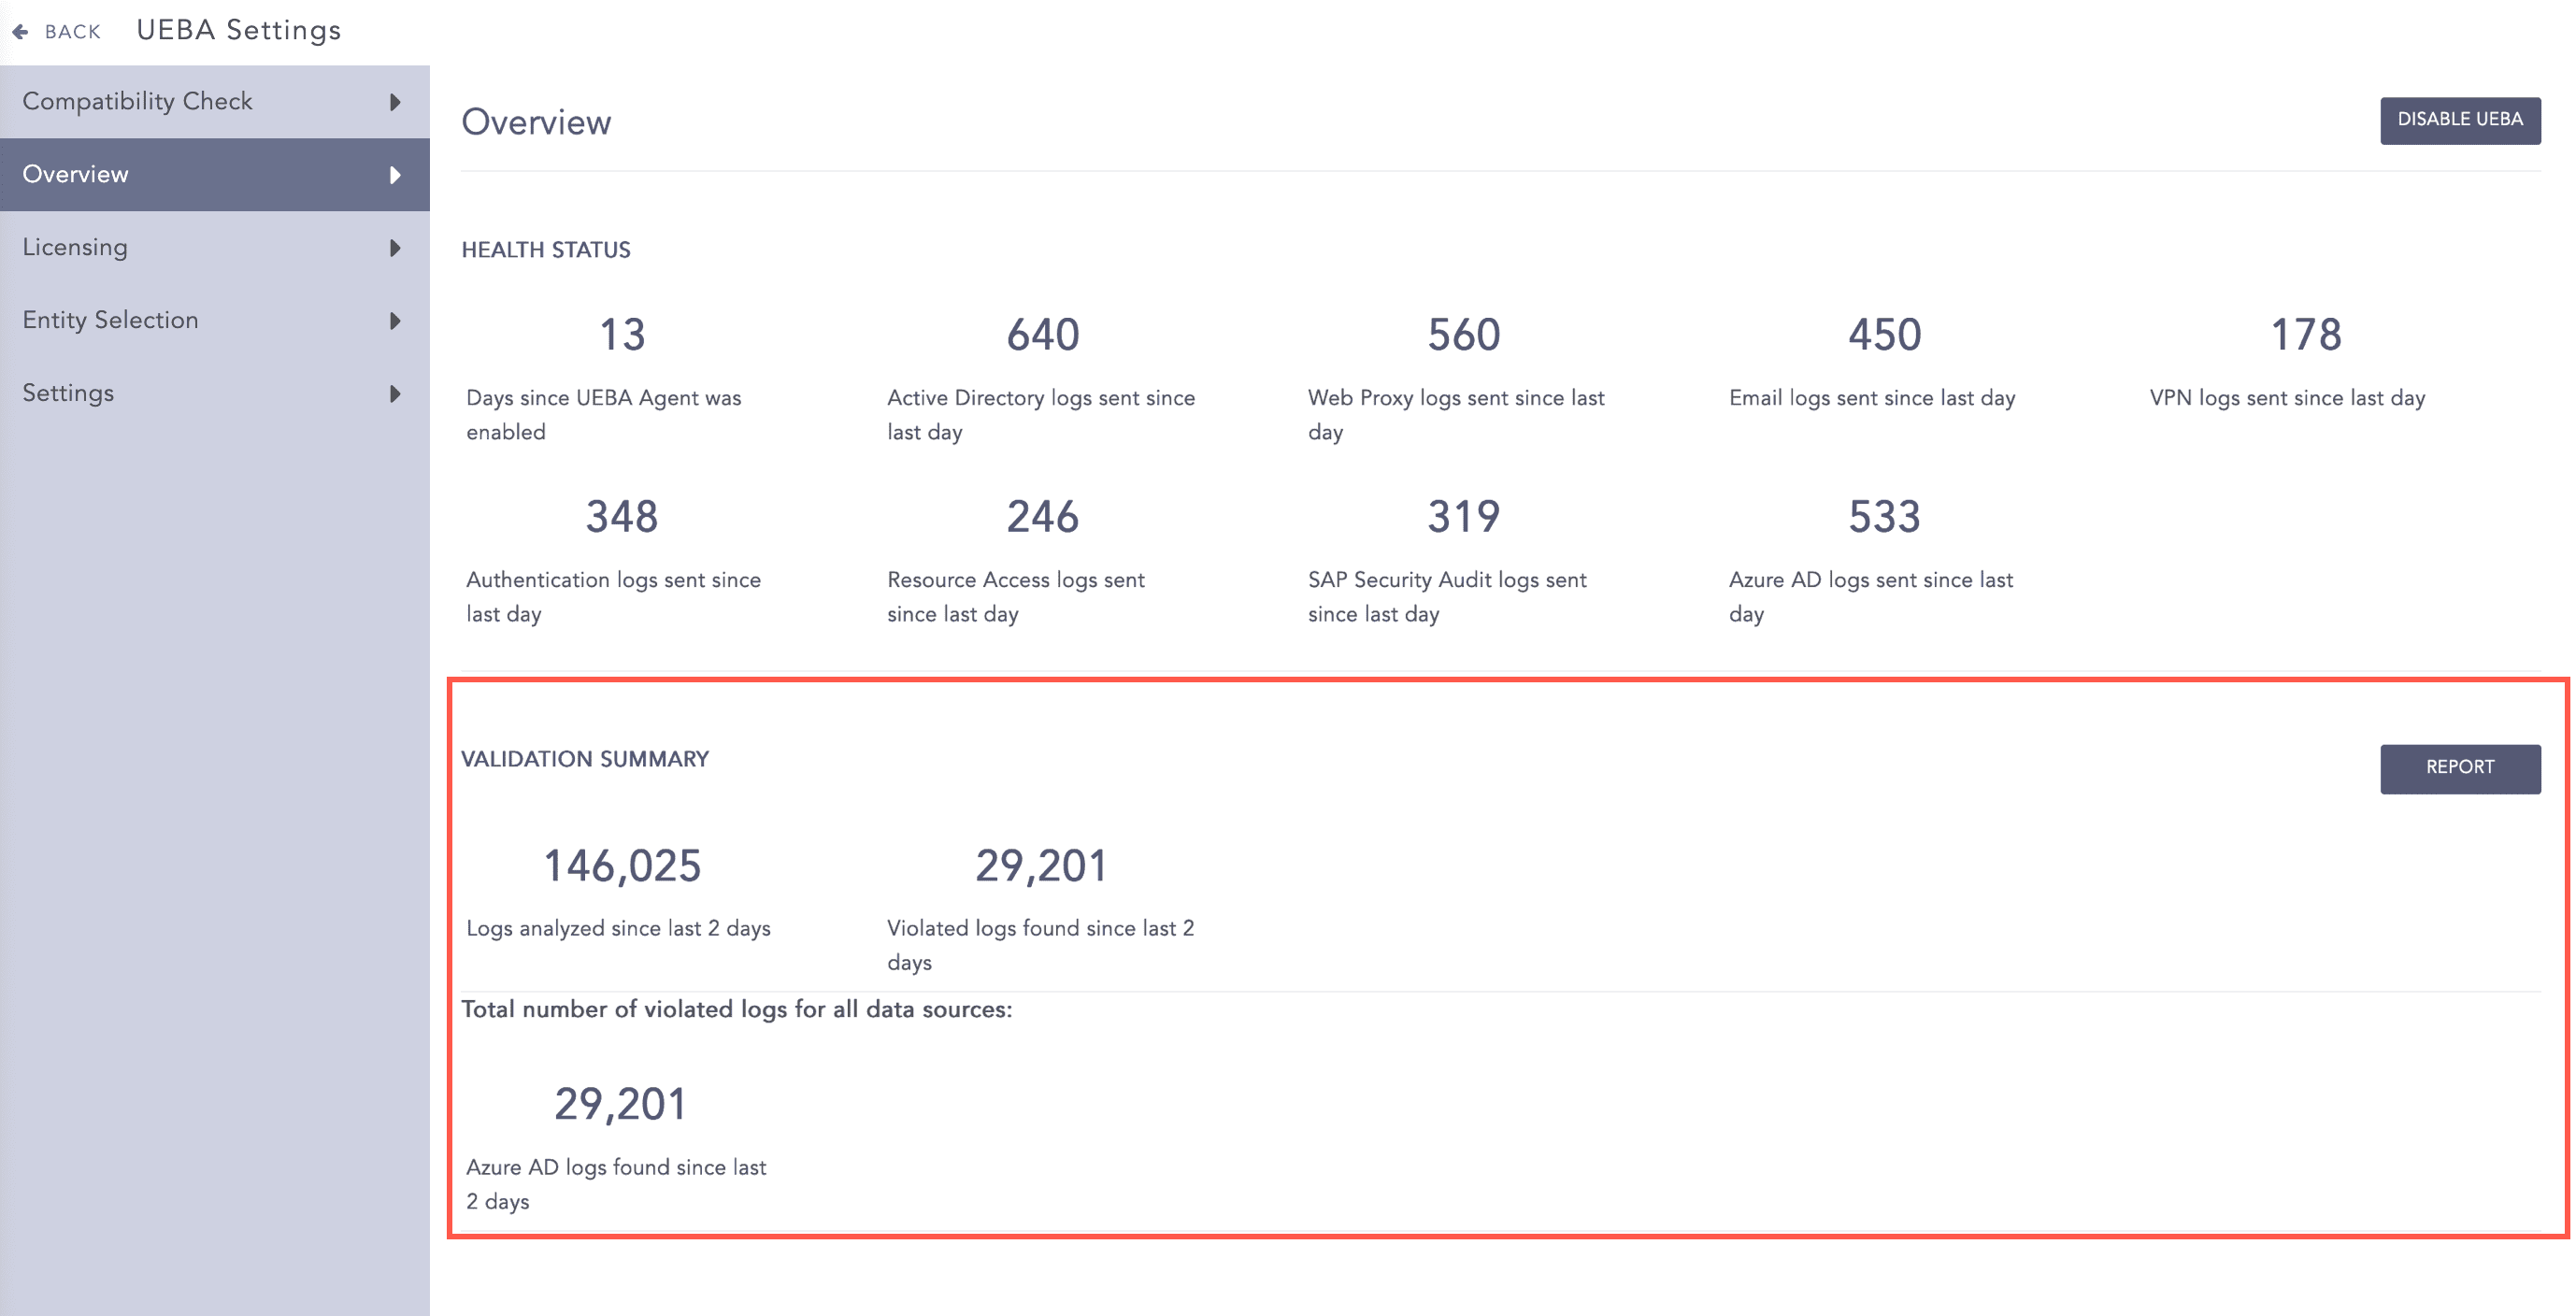
UEBA Validation Summary
You can also view a Validation Summary Report for more details. Click Report to view:
S.N |
Field |
Description |
1 |
Timestamp |
Shows the date and time of the violation. |
2 |
Source Type |
Shows the data source of the violation: Active Directory, web proxy, email, VPN, authentication, resource access, SAP security audit, or Azure AD. |
3 |
Type |
Shows the violation type: whether the mandatory fields are missing or the field value is invalid. |
4 |
Validation Message |
Provides detail of the violation. |
5 |
Actions |
Enables you to search for the respective violation at the particular timestamp by clicking the Search Log icon. |
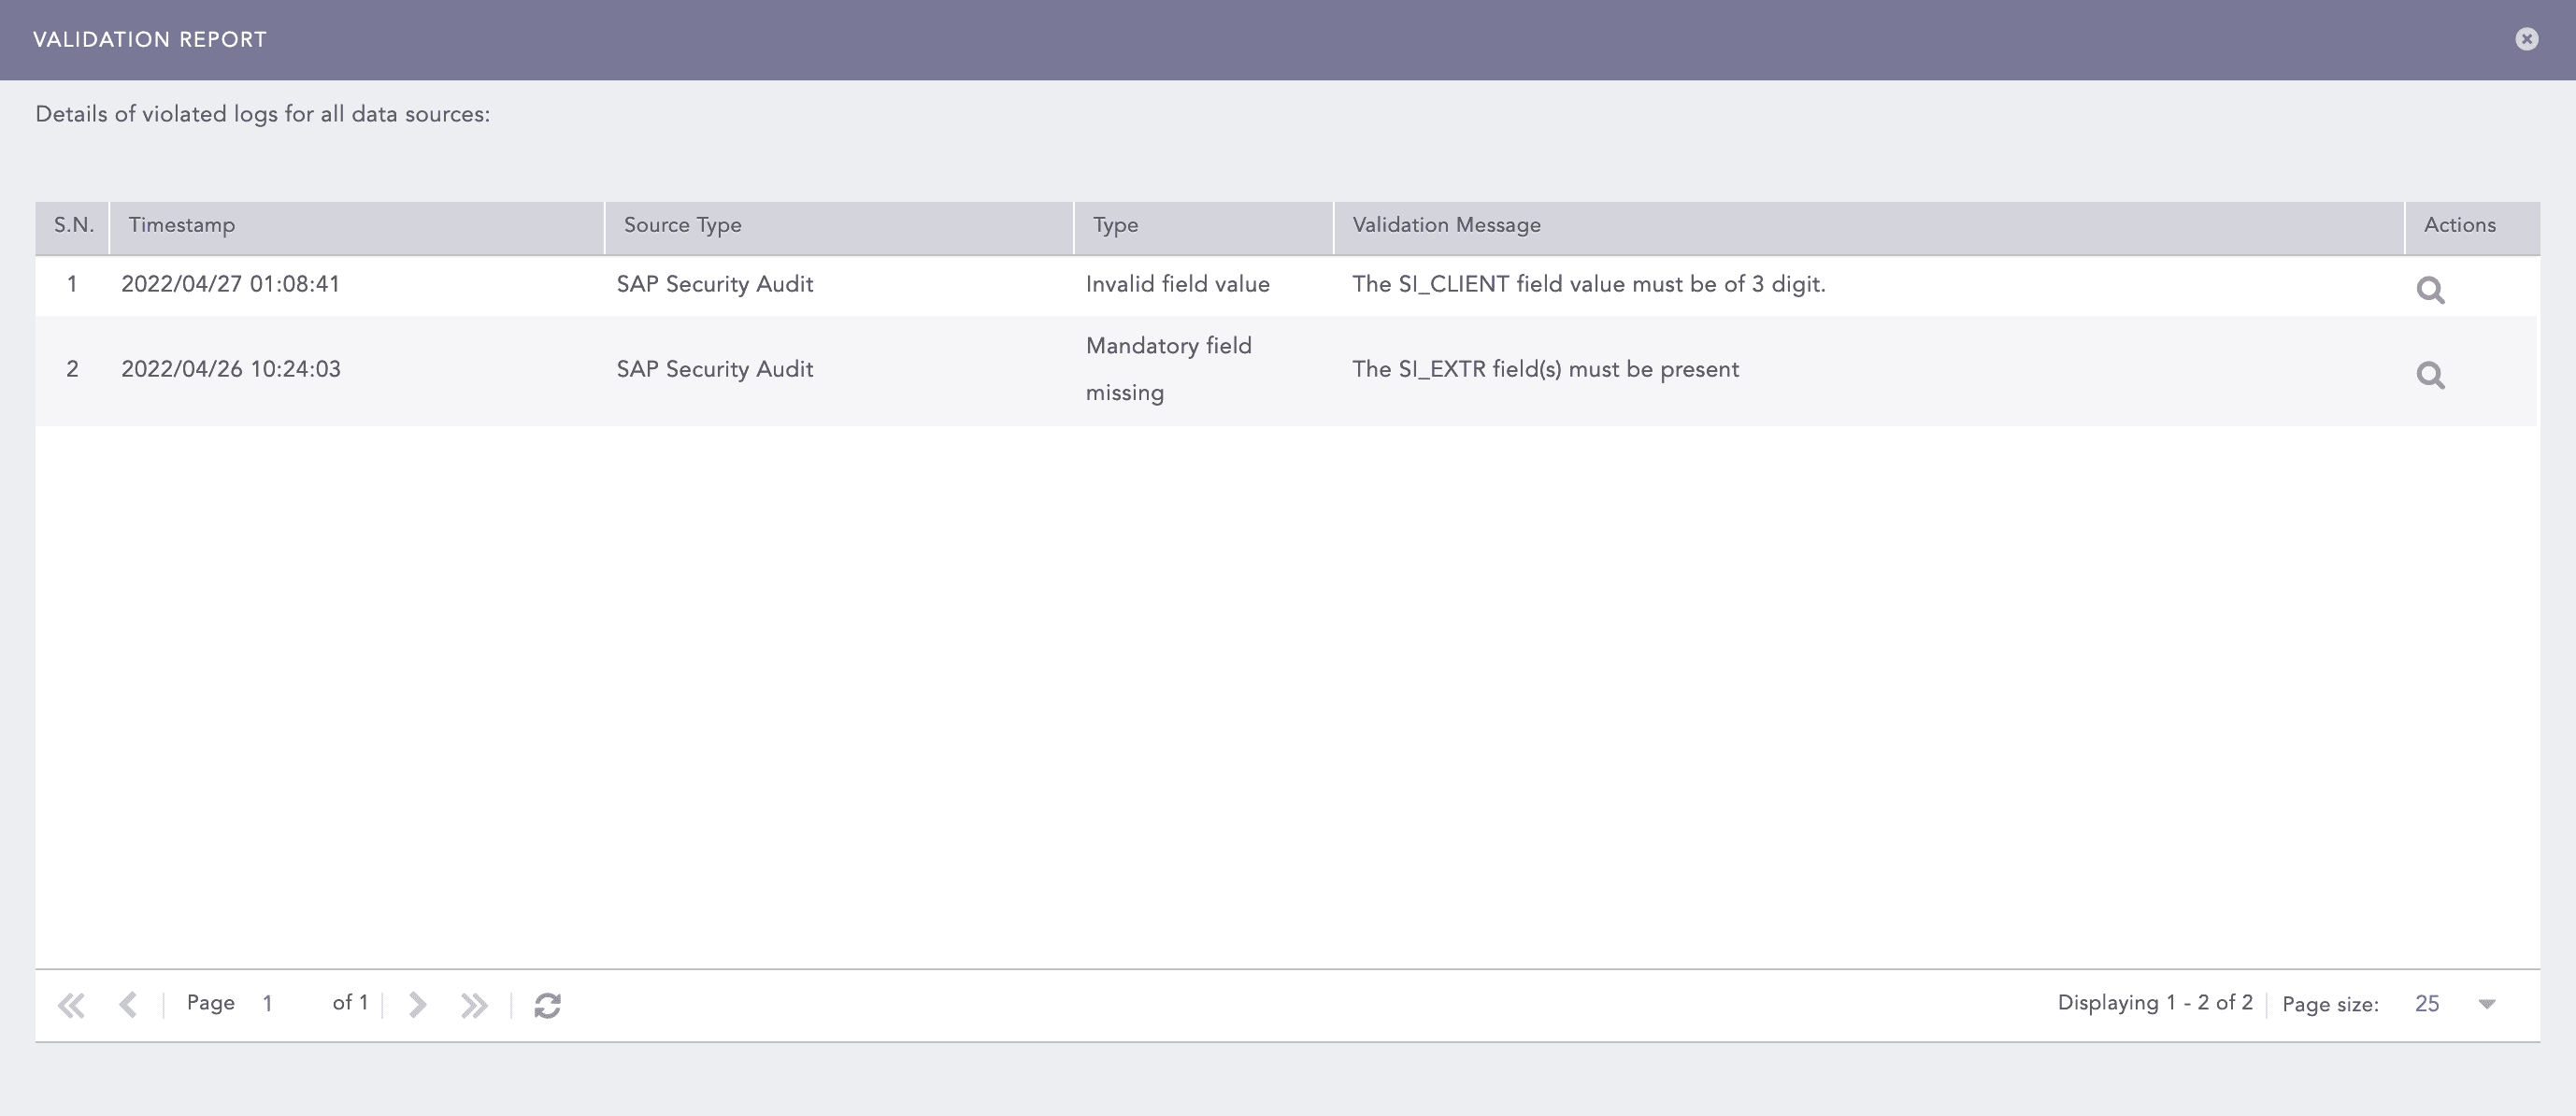
UEBA Validation Report