Tables
Tables are placeholders for storing data that is used to enrich logs. Create a table, add data using the process command, and use the data to enrich logs. The data in the table is updated dynamically using the toTable process command through search or scheduled intervals in alerts and the dashboard, so the table is also referred to as a dynamic table.
Adding a Table
Go to Settings >> Knowledge Base from the navigation bar and click Lists and Tables.
Select Tables.
Click ADD.
Enter a Name.
Enter the Age Limit. It is the time after which the data from the table is deleted. To keep the data forever, set the age limit to 0.
Click Save.
The added tables are also displayed as Enrichment Sources. Go to Settings >> Configuration in the navigation bar and click Enrichment Sources to view the tables.
Adding data to Tables
The added table is initially empty. Use the toTable process command to add field values from the search result into the table.
Syntax:
| process toTable (table_name, field_name1, field_name2,...., field_name9)The process command takes the table name and field names as arguments. You can enter a maximum of 9 fields. If you enter more than nine fields or an incorrect table name, you will get an error message. The fields log_ts, col_ts, sig_id, msg, and col_type are not supported.
If data privacy is enabled, you cannot use the toTable commands with encrypted fields unless you have full access to them.
Example:
device_ip=* | process toTable(device_ip_table, device_name, device_ip, action)When you run the above query for the first time, two columns, device_name and device_ip, are added to the table device_ip_table, and data is added from the search result. Afterwards, running the same query only adds the search result values into the table; it does not update the column.
When you execute the dynamic table command, it updates the table with only the number of rows specified as the pagination value. The table adds the number of rows defined in pagination. The pagination value can be changed from Page Size Configuration.
For the command that uses the chart count(), the table is updated to 40 rows. You can change this number by adding a limit in the query. For example,
device_ip = * | chart count() by device_ip limit 200 | process toTable(device_ip_table, device_name, device_ip)Every time you update the table, you must pass the same number of arguments you passed when you first executed the process command. You can also set alerts and dashboards that run in scheduled intervals to update the table.
Viewing the Table Data
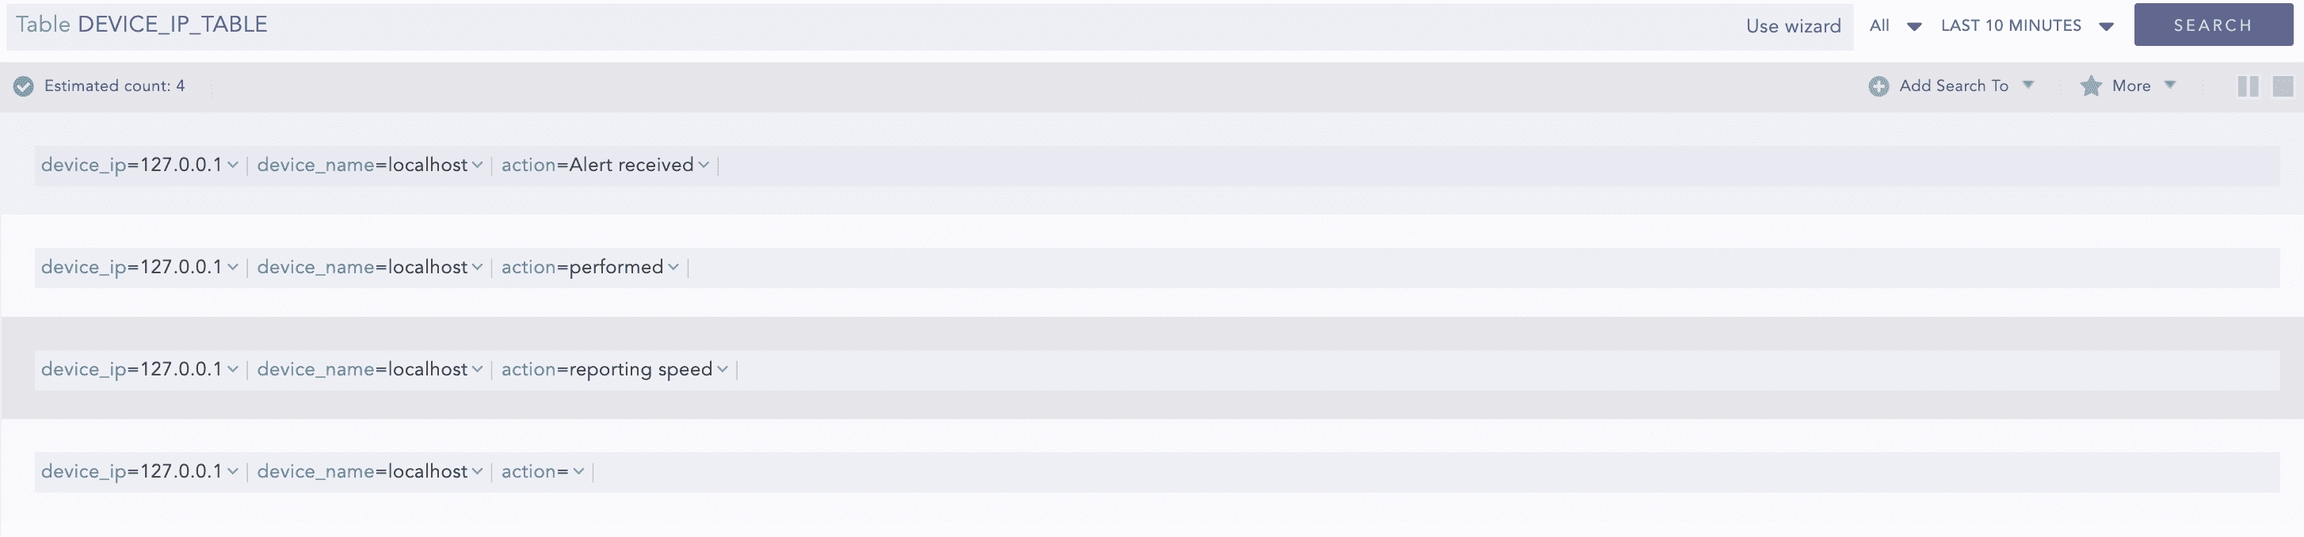
View the table data by clicking the View Table Data icon under the Actions. It redirects you to Logpoint Search with the query Table DEVICE_IP_TABLE prepopulated. You can also view the table directly from the Search page using the same query.
Data Expiry
In a dynamic table with an Age Limit, each row inherits the table’s expiry time. For example, if the table’s expiry time is set to 3 hours, any row added to the table will automatically expire 3 hours after being added. If a row is updated, its expiry time resets, and the row will expire 3 hours after the last update.
In contrast, a table without an Age Limit treats all rows as permanent, setting their expiry time to 0. To delete these items, put an Age Limit on the table, then update the row. Once the row exceeds the new expiry time, it will be removed.
Was this helpful?