Log Management Devices

There are two main ways to set up Log Management using devices:
Processing Policy and Device : A processing policy combines normalization, enrichment, and routing policies into a single policy that is then assigned to a device.
Steps
Write the Signatures for signature-based normalizers.
Set up the relevant Normalization policies (compiled normalizers and normalization packages).
Set up Enrichment.
Set up a Routing Policy.
Create a Processing Policy from the normalizer, enrichment, and routing.
Configure the Repository.
Create a Device and add the Collector to it.
Add the Device to a Device Group.
Log Collection Policy and Device: A Log Collection Policy groups the configuration of collector/fetchers, normalization, enrichment, routing and repos that you add to a Device. You can use Log Collection Policies to apply or reuse the same configurations to one or more devices.
Steps
Write the Signatures for signature-based normalizers.
Set up the relevant Normalization policies (compiled normalizers and normalization packages).
Set up Enrichment.
Set up a Routing Policy.
Create a Processing Policy from the normalizer, enrichment, and routing.
Configure the Repository.
Create a Log Collection Policy.
Create a Device and add the Collector to it.
Create a Device and add the Collector to it.
Normalization
Normalization translates a raw log message into Logpoint taxonomy. Raw log messages come from different source devices in a variety of formats. Normalizing allows for searches, identification of patterns and correlation across logs from different sources. For example, different firewall vendors may label fields differently or have no labels. Normalization maps various input fields like source or third field from the left into standardized field names such as source_address.
Logpoint uses two types of normalizers:
Compiled Normalizers: They are hard-coded and fast.
Normalization Packages: They contain one or more normalizers that use regex or signatures, to find and extract the key value pairs from the raw logs. The resulting key value pairs depend on the log source and which signatures and potential labels are used. Use signature-based normalizers for raw logs that are not well-defined.
Normalization Packages
Normalization Packages contain one or more signature-based normalizers. Each normalizer contains a list of signatures that are looked up in the log message. The signature ID of the line that the log message was matched against is added as a field to the log, in addition to a norm_id field with the name of the normalizer package used.
Normalization Packages Types:
Vendor Packages: Normalization Packages Logpoint developed and are part of the Log Source Integration. You can't modify or edit Vendor Packages. You can clone them and then make your changes or edits.
My Packages: Normalization Packages that you create. You can create your own packages based on Vendor Packages. First, clone a package, then make your changes. After that, share your packages with other Logpoint A/Susers.
Go to Settings >> Knowledge Base from the navigation bar and click Normalization Packages. You can switch between My Packages and Vendor Packages by clicking the dropdown at the top-left. Export a normalization package from one Logpoiny and import it into other to save configuration time.
Before creating a Normalization Package, you must create signatures to not use the packages that come out-of-the-box with the integrations. Go to Signatures to learn how to make them.
Adding a Normalization Package
Go to Settings >> Knowledge Base from the navigation bar and click Normalization Packages.
Click ADD.
Enter a Name and Description.
Click Submit.
Click the Signatures icon under Actions.
Click Add.
In Pattern, enter the signature.
In Example, enter a log message to apply the signature to.
Click Check Pattern to validate the signature against the example.
Use Key Values fields to map other values to a signature (e.g.,
object = process,status = failure).Use Replace Keys to replace a key-value pair (e.g., replace
host_userwithhost).Click Save, then Submit. Add as many signatures as required.
Click Re-Order to sort signatures.
Click Definers to view Signature Definers.
Deactivating Signatures
Go to Settings >> Knowledge Base from the navigation bar and click Normalization Packages.
Click the View Signatures icon under Actions of the relevant normalization package.
Deselect signatures to deactivate them.
Click Submit.
Cloning Normalization Packages
Go to Settings >> Knowledge Base from the navigation bar and click Normalization Packages.
Click the Clone Package icon under Actions.
To clone:
Multiple normalization packages, select the ones to clone. Click MORE and select Clone Selected Packages.
All normalization packages, click MORE and select Clone All Packages.
Enter a new Name for the cloned package.
Select Replace to overwrite an existing package with the same name.
Click Clone.
Exporting Normalization Packages
You can export a normalization package from a Logpoint and import it to another and save configuration time.
1. Go to Settings >> Knowledge Base from the navigation bar and click Normalization Packages.
2. In the dropdown at the top-left, click My Packages.
3. Select the normalization packages to export and click EXPORT.
4. Click Save.
Importing Normalization Packages
Go to Settings >> Knowledge Base from the navigation bar and click Normalization Packages.
Click Import.
Browse to the Normalization Package file.
Click Upload.
Editing a Normalization Package
Go to Settings >> Knowledge Base in the navigation bar, then click Normalization Packages.
Click the Name of the package to edit (name cannot be changed).
In Pattern, change the signature.
In the Example, enter a log message that resembles the signature. Optional field.
Click Check Pattern to check if the signature matches the example.
Use Key Values fields to link other values to a signature.
For example, for a particular signature that captures process failure, you can add a key-value as object = “process” and status = “failure”.
Use Replace Keys to replace a key-value pair with another.
For example, if the field
host_userin a log, you can replace this withhost.Click Save.
Click Submit. Add as many signatures as required.
Click Re-Order to sort them.
Click Definers to view the Signature Definers.
Click Submit.
Deleting Normalization Packages
Go to Settings >> Knowledge Base from the navigation bar and click Normalization Packages.
Click the Delete icon under Actions.
To delete:
Multiple normalization packages, select the packages. Click MORE and choose Delete Selected Packages.
All normalization packages, click MORE and choose Delete All Packages.
Click Yes.
Normalization Policies
If a normalization policy contains both compiled and regex-based normalizers, Logpoint first tries compiled normalizers. Regex-based normalizers (normalization packages) are used only if compiled normalizers fail. The order of normalization packages matters.
Adding a Normalization Policy
Go to Settings >> Configuration from the navigation bar and click Normalization Policies.
Click ADD.
Enter a Policy Name.
Select Normalization Packages and Compiled Normalizers by
Double-clicking the packages.
Dragging and dropping the packages from the left pane to the right.
Selecting a package and clicking the > button.
Click View Signatures at the bottom-left corner view all the signatures in the selected packages.
Click Submit.
Editing a Normalization Policy
You can modify the normalizers and their order of use, but not change the policy name.
Go to Settings >> Configuration from the navigation bar and click Normalization Policies.
Click the Name of the normalization policy.
Make your changes.
Click Submit.
Deleting Normalization Policies
Go to Settings >> Configuration from the navigation bar and click Normalization Policies.
Click the Delete icon under Action.
To delete multiple normalization policies, select the policies. Click MORE and choose Delete Selected.
To delete all the normalization policies, click MORE and choose Delete All.
Click Yes.
Enrichment
Enrichment adds metadata from enrichment sources to log events that were not part of the original log. Enriched fields in Logpoint logs are marked red.
Enrichment Types
Static: This enrichment is applied at data ingestion, either during collection or storage. Static enrichment is indexed, which makes queries over large datasets run faster.
Dynamic: This enrichment is applied during analysis, or when a query runs. It is useful for lookups that are only possible long after logs are received. For example from a threat intelligence table, as the threat was likely unknown when the logs were originally ingested. Dynamic Enrichment uses less storage than static enrichment, uses less of a collection load, and is good for small data sets and short time ranges.
Enrichment data comes from an Enrichment Source. To use the Enrichment Source, create an Enrichment Policy and add it to a Processing Policy or a Log Collection Policy so the log data is enriched. Enrichment Sources are Integrations that is downloaded from the Marketplace.
Logpoint Enrichment Sources
LDAP: User information from an LDAP server.
GeoIP: Geographical information of a public IP address.
CSV: Data in a Comma-Separated Values (CSV) file.
IPtoHost: Hostname from IP address.
Stix/Taxii: Cyber Threat Intelligence (CTI) data written in STIX format from a TAXII server.
Oracle: Data from an Oracle database.
ODBC: Data from ODBC database server. Supported ODBS databases include PostgreSQL, MSSQL, and MySQL.
Threat Intelligence: Groups a number of threat intelligence sources into a single Integration for download.
To learn how to use and apply enrichment data to your logs, go to Enrichment.
Routing
Routing specifies which repository on which specific device incoming log data should be stored based on a log message's key or key value pair.
Routing Policies are made up of one or more routing criteria, which determines where or which repo incoming log data should go to. Part of a Processing Policy, a routing policy can also be used to selectively discard incoming log messages.
You use Routing Policies to select which repos the incoming logs should go. Routing criteria uses keys to direct the logs to the correct repo.
KeyPresentValueMatches routes the log files if they match a Key-Value pair.
KeyPresent routes the log files if a specific key matches.
Routing keys must be normalized fields. The following keys cannot be used for routing:
log_ts, device_ip, device_name, col_type, repo_name, col_ts, collected_at, device_address, index_ts, logpoint_name.
You cannot apply a routing policy for the _logpoint repo.
There is a default LogpointAlerts routing policy that routes messages with norm_id = LogpointAlerts to the _LogpointAlerts repo; otherwise they go to the default repo.
Adding a Routing Policy
Go to Settings >> Configuration from the navigation bar and click Routing Policies.
Click ADD POLICY.
Enter a Policy Name.
Select a repo from Catch All. If an incoming log does not match any routing criteria, it gets stored in the Catch All repo.
In Type, use:
KeyPresentValueMatches routes the log files if they match a Key-Value pair.
KeyPresent routes the log files if a specific key matches.
Select an Operation:
Store raw message: to store both the raw message and the normalized data in the target repository.
Discard raw message: to discard the raw message and store the normalized data.
Discard entire event: to discard both the raw message and the normalized data.
In the Routing Criteria dropdown, select the target Repository.
Click Add. When you change a criterion, it is listed in the table below the Routing Criteria. The priority of the routing criteria can be changed by clicking the up and down arrows in Actions.
Editing a Routing Policy
Go to Settings >> Configuration in the navigation bar and click Routing Policies.
Click the Name of the required routing policy.
Select a repo from Catch All. If an incoming log does not match any routing criteria, it gets stored in the Catch All repo.
In Type, select:
KeyPresentValueMatches routes the log files if they match a Key-Value paiir.
KeyPresent routes the log files if a specific key matches.
Select an Operation:
Store raw message: to store both the raw message and the normalized data in the target repository.
Discard raw message: to discard the raw message and store the normalized data.
Discard entire event: to discard both the raw message and the normalized data.
In the Routing Criteria dropdown, select the target Repository.
Click Add. When you change a criterion, it is listed in the table below the Routing Criteria.
The priority of the routing criteria can be changed by clicking the up and down arrows in Actions.
8. Click Submit
Deleting a Routing Policy
Go to Settings >> Configuration in the navigation bar and click Routing Policies.
To delete:
A single policy, click the Delete icon under Actions.
Multiple routing policies, select the policies. Click MORE and click Delete Selected.
all routing policies, click MORE and click Delete All.
KeyPresent routes the log files if a specific key matches.
Click Yes to confirm.
Processing Policies
A Processing Policy combines normalization, enrichment, and routing policies into a single policy assigned to a device. All collectors and fetchers use processing policies, eliminating the need to attach separate normalization, enrichment, and routing policies each time.
Adding a Processing Policy
Go to Settings >> Configuration from the navigation bar and click Processing Policies.
Click ADD.
Enter a Policy Name.
Select a Normalization Policy, an Enrichment Policy, and a Routing Policy.
Click Submit.
Editing a Processing Policy
Go to Settings >> Configuration in the navigation bar and click Processing Policies.
Click the Name of the required processing policy and update the information.
Click Submit.
Deleting a Processing Policy
Go to Settings >> Configuration in the navigation bar and click Processing Policies.
To delete:
A single policy, click the Delete icon under Actions.
Multiple processing policies, select the policies. Click MORE and click Delete Selected.
All processing policies, click MORE, and click Delete All.
Click Yes.
Repositories
A repository or repo is a log storage location where device logs are routed to. When you setup or run a search query, you select which repos to run the search on. A Routing Policy determines which repo logs are sent to. Repo properties control how long log data is stored until its automatically deleted, which storage tier to use, where log data is potentially moved to, and whether the data is replicated using Logpoint High Availability. Repos, are different from actual storage volumes. A server can have multiple disks or volumes. These volumes will have the same or different mount points. While repos are logical volumes within Logpoint, a repository can use multiple storage tiers located on one or more of the underlying volumes.
A single repo consists of one or more repo-paths, each with its own retention policy. Log retention period depends on the policies set.
High-Availability (HA) Repos
You can replicate one Logpoint repo to another Distributed Logpoints repo. These High Availability (HA) Repos replicate logs from one Logpoint to multiple Logpoint machines, ensuring logs remain available even if one Logpoint becomes unavailable.
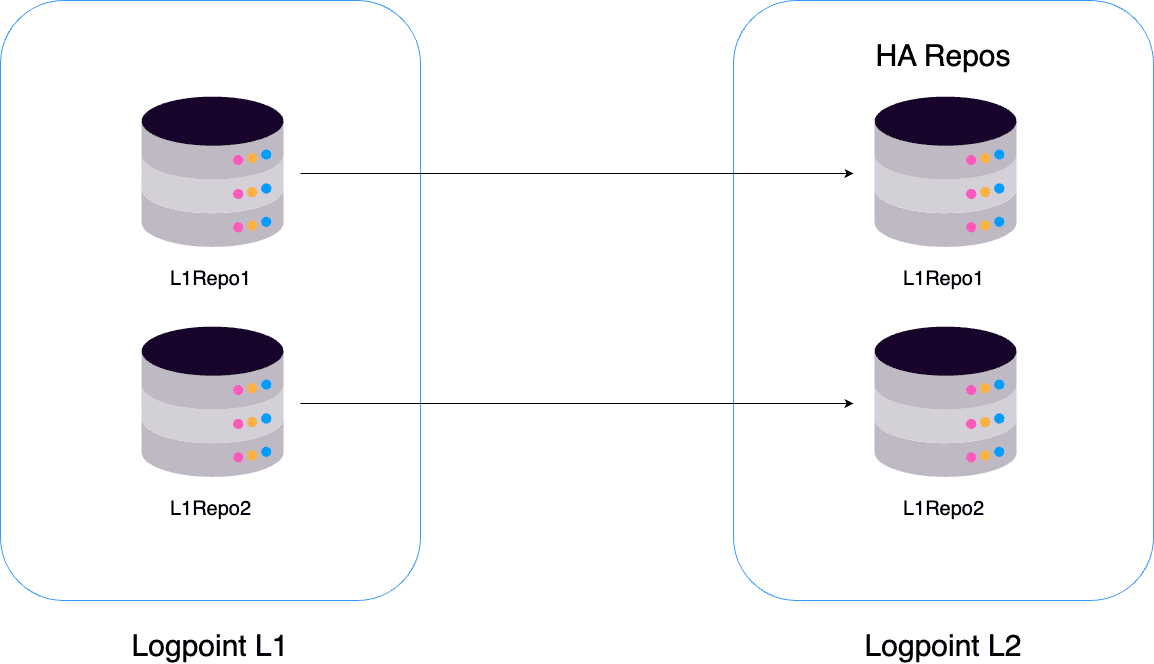
In the above diagram, the repos R1 and R2 belong to Logpoint L1. When you add Logpoint L2 as the Remote Logpoint of L1 and configure them for high availability, Logpointreplicates the repos of L1 to the corresponding repos in L2. Ingested logs are stored in both repos. If you configure HA Repo for R1 and R2, their HA repos L1R1 and L1R2 are replicated in Logpoint L2.
Log Retention specifies the number of days for which logs are kept in storage before they are removed. You can add multiple Repo Path to transfer older logs from primary to secondary storage according to their retention period. This frees up space in primary storage for the newer logs.
For example, you can define two repo paths for repo as /opt/immune/storage/tier1 and /opt/immune/storage/tier2 and select the Retention (day) as five days and fifteen days, respectively. Then, Logpoint stores the collected logs in the first path for the first five days. Then, they are moved to the second path and stored for fifteen days. The total retention period for the repo is twenty days. After twenty days, the logs are deleted from the database.
Logs are stored in folders, each with a maximum capacity of 5 million. When a folder reaches this capacity or its retention time exceeds, it becomes immutable, meaning no additional logs can be added. Once a folder is immutable, it is moved from primary to secondary storage, ensuring that all logs within it are moved.
Logpoint moves the logs daily at 1 AM GMT.
 Adding a Repo / HA Configuration
Go to Settings >> Configuration from the navigation bar and click Repos.
Click ADD.
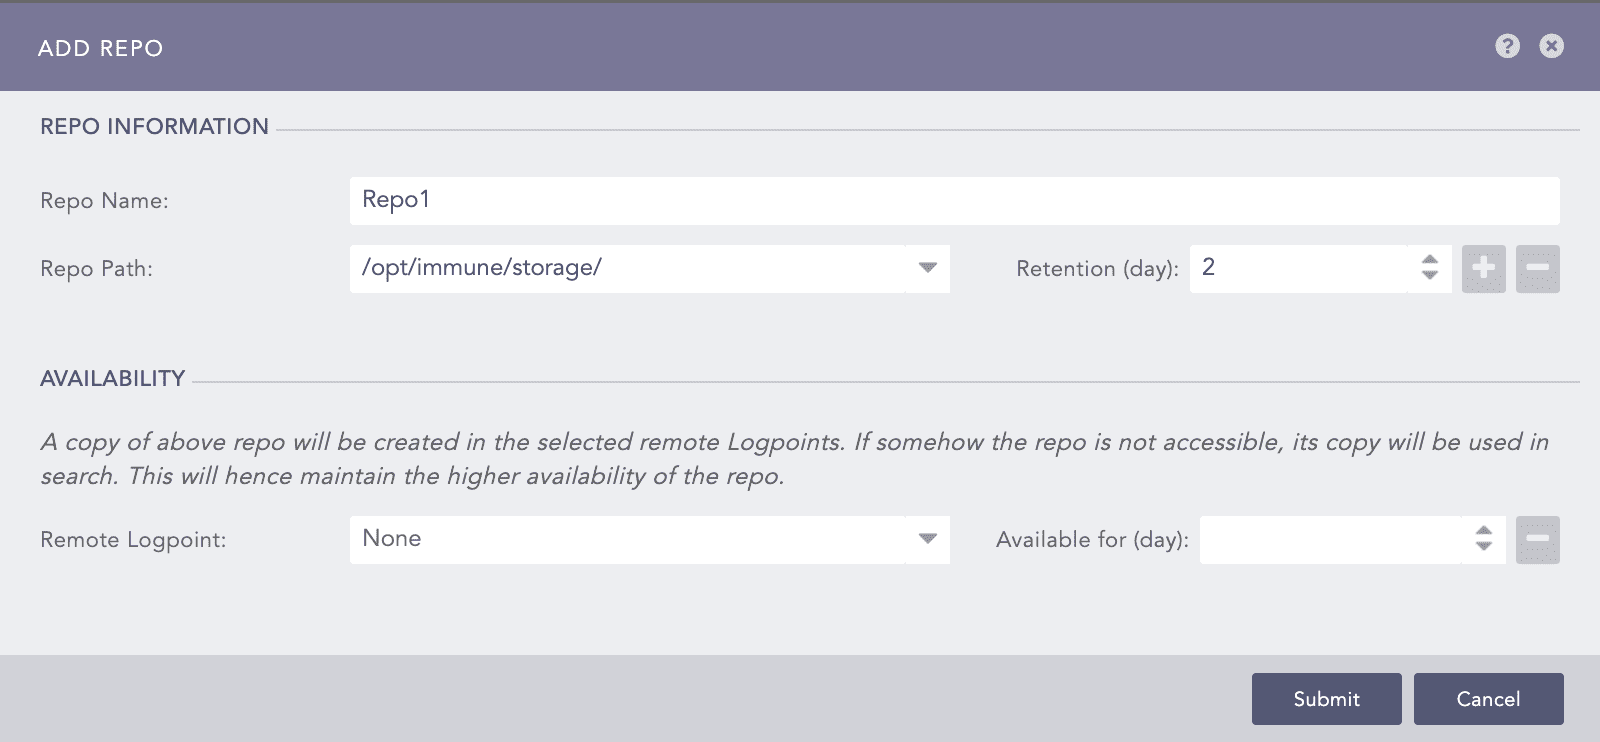
In REPO INFORMATION,
Enter a Repo Name. The length must be less than 29 characters.
Select a Repo Path. Click the plus icon to add another repo path if you are archiving logs in secondary storage. To add new paths in the Repo Path dropdown, use the
repodiraddli-admin command. For more details, go to Logs Retention.Enter the number of Retention (days). The number must be greater than two.
Use Availability to set up High-Availability Repos.
Remote Logpoint lists all the distributed or remote Logpoints connected to yours. Select a remote Logpoint to replicate the repo.
In Available for (day), select the retention period for the High-Availability repo. If you select five days, the logs will be removed from High-Availability repo after five days.
Click Submit.
Exporting Repos
The exported file contains the repo configuration, i.e., its name, the repo-paths, and the retention policies.
Go to Settings >> Configuration from the navigation bar and click Repos.
Select the repositories to export.
Click Export.
Save the exported pak file.
Importing Repos
Create HA repos for one Logpoint in only one of its Distributed Logpoint. On the Distributed Logpoint, you can change the base repo-path from the system settings. You can specify the HA repos when creating a repo on the local machine. If the imported pak file contains an existing repo name, a dialog box appears that lets you enter a new repo name.
Go to Settings >> Configuration in the navigation bar and click Repos.
Click IMPORT and browse to the repository file.
Click Upload.
Editing Repos
Go to Settings >> Configuration from the navigation bar and click Repos.
Click the Repo Name of the required repo and update the information. You cannot edit the name of a repo.
Click Upload.
Deleting Repos
Go to Settings >> Configuration from the navigation bar and click Repos.
To delete:
A single repo, click the Delete icon under Actions.
Multiple repos, select the repos. Click More and click Delete Selected.
All repos, click More, and click Delete All.
Click Yes.
Collectors & Fetchers
A collector retrieves logs from the source and buffers them. It receives logs through specific ports and/or forwards them to a Logpoint Storage Node. The collector uses a normalizer to split each log message into key-value pairs and apply static enrichment during processing.
Logpoint has the following out-of-the-box collectors.
Syslog Collector
Snare Collector
FTP Collector
SNMP Trap Collector
SFlow Collector
File System Collector
Syslog Collector
Syslog Collector collects data from sources that follow the Syslog protocol and serves as the collector for most Logpoint Log Sources. You can use Syslog Collector in one of three ways:
As a Syslog Collector:
It collects syslog messages from the source devices, processes the logs, and forwards them to Logpoint. It facilitates direct communication between source devices and Logpoint.
As a Proxy Collector:
It collects syslog messages from the source device and sends them to Logpoint, acting as a proxy between the source device and Logpoint. It is configured where direct communication between source devices and Logpoint is not possible, such as when there are network restrictions, location restrictions, or security policies in place.
Uses a Proxy
The source device sends the logs to a proxy device, which acts as an intermediate log forwarder. The proxy device collects, processes, and forwards the logs to Logpoint. A proxy device can be a log forwarder or a collector that sits between the source devices and the log source, centralizing log forwarding from multiple sources to reduce the load. This ensures reliability by caching logs if the SIEM is temporarily unavailable.
To set up the Syslog Collector
For Windows-based systems, use third-party agents
For Linux-based systems, use the command-line. After using the command line to add it, you will be able to link it to a device using the Logpoint UI.
Sequence Numbering
You can add sequence numbers to logs collected by Syslog Collector. Sequence numbers start from 1, are reset when you restart Syslog and when the number of logs reach 1,000,000,000,000. They help you identify the order of the logs received from a device.
Configuring Syslog Collector
Go to Settings >> Configuration from the navigation bar and click Devices.
Click the Add collectors/fetchers icon under Actions.
Click SYSLOG COLLECTOR.
In PROXY SERVER, select:
Use as Proxy
Uses Proxy
None for the device to be a Syslog Collector. Select a Parser, a Processing Policy, and a Charset.
In SYSLOG COLLECTOR, if the Syslog Collector:
Is a proxy, select a Parser and a Charset. Select the Proxy IP and enter the HostName of the source device, which is case-sensitive. A proxy server can have multiple source devices, but each device's hostname must be unique.
Uses a proxy, select a Processing Policy. If a device not configured as a Proxy sends logs via a syslog proxy, it is considered malicious, and its events are rejected.
Click Submit.
Supported Specification and Syslog Format
Syslog Collector supports the RFC 6587 specification for UTF-8 encoded logs with the following formats:
RFC 3164
Standard RFC 3164:
<PRI> MTH DD HH:MM:SS Hostname LogContent
For example:
RFC 3164 with year:
<PRI> YYYY MTH DD HH:MM:SS Hostname LogContent
For example:
RFC 5424
<PRI> [PRIVAL] [FULL-DATE]T[FULL-TIME] Log Content
Here,
FULL-DATE = DATE-FULLYEAR “-” DATE-MONTH “-” DATE-MDAY
FULL-TIME = PARTIAL-TIME TIME-OFFSET
PARTIAL-TIME = TIME-HOUR “:” TIME-MINUTE “:” TIME-SECOND [TIME-SECFRAC]
TIME-SECFRAC = “.” 1*6DIGIT
IME-OFFSET = Z / (“+” / “-“) TIME-HOUR “:” TIME-MINUTE
For example:
Logpoint prioritizes the timezone offset in the log over the device’s timezone when extracting log_ts. If both the device and the log contain timezone information, the log’s timezone offset is used for log_ts.
Before you start receiving logs, you must configure the log source settings on your Linux or Windows to forward logs to Logpoint:
Linux Configuration
Open the syslog configuration using the terminal:
Add your remote server in this format.
Restart Syslog.
Configuring Linux devices for forwarding SSL encrypted logs
Install stunnel, and type the following command in the terminal.
Copy
/usr/share/doc/stunnel4/examples/stunnel.conf-sampleto/etc/stunnel/stunnel.conf.Go to /etc/stunnel/stunnel.conf and modify as follows (create it if it doesn’t exist).
Now, on the same config file, add:
Restart the config file with:
Open
/etc/syslog.confwith the administrative privilege.Forward the logs to Logpoint server.
Restart syslogd with:
Go to Logpoint server.
Select the Linux Device from Settings >> Configuration >> Devices and click Add Collectors/Fetchers.
Windows Configurations
Forward syslog format logs from Windows to Logpoint using third-party agents. We recommended InterSect Alliance’s Snare for Windows. The following procedure only applies to Snare for Windows.
Go to Network Configuration in Snare.
Enter the IP address of your Logpoint in Destination Snare Server Address.
Enter port number 514 in the Destination Port.
Click Change Configuration.
Go to Apply the Latest Audit Configuration and click Reload Settings.
Sequence Numbering in logs collected from Syslog Collector
A sequence number is assigned per device per protocol to each log collected from the Syslog Collector. This helps you identify the order of the logs received from a particular device.
The log collected from a device with the device IP 192.168.0.135 and communicating via the TCP protocol is:


The sequence number for the above log is 41, shown in the seq_num_tcp field. It means that this log is the 41st TCP log message received from the device with the device IP 192.168.0.135.
Similarly, the log collected from a device with the device ip 192.168.0.135 and communicating via the UDP protocol is as follows:

The sequence number for the above log is 83, as shown in the seq_num_udp field. It means that this log is the 83rd UDP log message received from the device with the device IP 192.168.0.135.
And, the log collected from a device with the device ip 192.168.0.135 and communicating via the SSL protocol is as follows:

The sequence number for the above log is 68, shown in the seq_num_ssl field. It means that this log is the 68th SSL log message received from the device with the device IP 192.168.0.135.
Configuring Sequence Numbering
When you configure or add sequence numbers to logs, each log is assigned an incremental number starting from 1. Sequence numbering resets when you restart Syslog and when the number of logs reaches 1,000,000,000,000.
Go to Settings >> System Settings from the navigation bar and click System Settings.
Go to General tab, scroll until you find Sequence Numbering.
Select Add sequence numbers on log received from syslog collector.
Click Save.
Parsers
Parsers process raw logs by identifying log formats and extracting meaningful fields, including timestamps, source, event details, and attributes. They transform unstructured or semi-structured logs into structured, searchable data, enabling accurate normalization, correlation, and analysis across different log sources.
In addition to built-in default parsers, you can create custom parsers to handle unique log formats. The regex pattern defined in a parser splits incoming messages into individual log entries and extracts the required fields for further processing.
Syslog collector only supports the Syslog Parser.
Default Parsers
Line Parser
Line Parser splits each line in the log file into individual logs. If the size of the log file is larger than 12 KB, the log file is split into individual logs.
Example: Logs are divided into 2.
Syslog Parser
Syslog Parser splits syslog-formatted logs into individual messages using either the newline character (n) or octet-counting. It splits logs based on the message length specified in the log. If the size of the log exceeds the defined Message Length set from Syslog, the log is split into segments of that length.
For example, if the message length is set at 12 KB, logs larger than 12 KB size are divided into 12 KB segments. Use Syslog Parser only if the syslog message is formatted in one of the supported syslog formats.
This log entry will be split into two separate logs.
Multi Line Syslog Parser
Multi Line Syslog Parser splits multiple syslog messages written in multiple lines into individual logs. It uses Priority Value, or PRI, a numerical value enclosed in angle brackets “<>”, to split the message.
Example: The following Log entries are split into three logs
Email Parser
Email Parser aggregates logs with the same message ID into a single log. After aggregation, a compiled normalizer specific to each supported email service is required in the normalization policy to extract key-value pairs. Compiled Normalizers are hard-coded by Logpoint. While they not be flexible they are very CPU efficient.
Email Parser only works with the Syslog Collector.
Exim
EximMTACompiledNormalizer
Qmail
QmailCompiledNormalizer
Cisco IronPort
CiscoIronPortESGCompiledNormalizer
Sendmail
SendMailCompiledNormalizer
Postfix MTA
PostFixCompiledNormalizer
Proofpoint Email Protection Parser
splits logs coming from Proofpoint’s Email Protection service.
DB2 Parser
splits logs from IBM DB2 servers.
RACF Parser
RACF Parser splits logs from Resource Access Control Facility (RACF) devices.
CSVParser
CSVParser processes comma-separated values from a file. CSVParser can only be used with file-based collectors and fetchers.
JSONLineParser
Processes JSON lines from a file. JSONLineParser can only be used with file-based collectors and fetchers.
Integrations available in Marketplace may include additional default parsers.
Adding a New Parser
Go to Settings >> Configuration from the navigation bar and click Parsers.
Click Add Parser.
Enter a Name.
In Pattern, enter the regex pattern used to split the incoming logs into separate log entries.
In Example, enter an example of the parsed log.
Click Check to verify if the pattern matches the examples.
Click Submit.
Editing a Parser
Go to Settings >> Configuration from the navigation bar and click Parsers.
Select the parser to edit by clicking the name. The name of a parser can't be changed.
In Pattern, enter the regex pattern used to split the incoming logs into separate log entries.
In Example, enter an example of the parsed log.
Click Check to verify if the pattern matches the examples.
Click Submit.
Deleting a Parser
Go to Settings >> Configuration in the navigation bar and click Parsers.
Select the parser to delete and click the Delete icon under Actions.
To delete
Multiple parsers, select the parsers, click More, and choose Delete Selected.
All the parsers, click More and choose Delete All.
Click Yes.
Log Collection Policy
A Log Collection Policy defines the rules and settings for collecting, forwarding, and managing log data from various sources. It determines which log sources are included, how logs are filtered, and the frequency and method of collection. Administrators can configure policies to ensure that only relevant log data is collected, helping optimize storage and improve system performance.
Adding a Log Collection Policy
Go to Settings >> Configuration in the navigation bar and click Log Collection Policies.
Click ADD.
Enter a Name and a Description.
Click Save.
To add Collectors/Fetchers to the policy, click Yes.
Double-click the relevant collectors and fetchers and configure them.
Editing a Log Collection Policy
Go to Settings >> Configuration in the navigation bar and click Log Collection Policies.
Click the Name of the policy to edit. Names cannot be edited.
To make changes to the collectors/fetchers used, click the Add collectors/fetchers icon under Actions for each log collection policy.
The count under each collector and fetcher indicates how many times the Log Collection Policy uses it.
Click Submit.
Deleting a Log Collection Policy
Go to Settings >> Configuration in the navigation bar and click Log Collection Policies.
To delete:
A single policy, click the Delete icon under Actions.
Multiple log collection policies, select the policies. Click MORE and choose Delete Selected.
All the log collection policies, click MORE and choose Delete All.
Click Yes.
Devices
Devices represent the hardware or software components that generate and send logs to the Logpoint. These include servers, workstations, network devices, applications, or cloud services. Each device is identified by its IP address or addresses and must be added and configured in Logpoint before log collection begins. If a device is not configured, Logpoint’s internal firewall will block its traffic.
Logs from a device are retrieved by a collector or fetcher, either configured directly on the device or through a collection policy. Devices can optionally be organized into device groups, which are logical groupings of similar devices, but this is not mandatory. Registering devices ensures accurate log tracking, proper application of collection policies, and efficient management of log sources.
Viewing Device Details
Go to Settings → Configuration from the navigation bar and click Devices.
Under the Actions column, click the Details icon for the device.
Here, Last Log Received shows the last time a device sent log(s). If a log is received within the set threshold time, its Last Log Received timestamp appears in green. If no log is received within that period, the device is considered inactive and the timestamp is shown in yellow. The default inactivity threshold is 60 minutes, but this can be edited when adding a device.
You can also create a query with “message”=”Inactive Logsource monitoring” to generate alerts, visualize data in dashboards, create reports, and perform searches for inactive log sources.
Adding a Single Device
Go to Settings → Configuration in the navigation bar and click Devices.
Click ADD.
Enter the device’s Name and Device address(es), either an IP address or hostname. IP addresses are allocated within a /16 network, allowing up to 65,536 addresses. Hostnames must follow the RFC-compliant format. A hostname can resolve to multiple IP addresses, and it is counted as a single node.
Hostnames consist of 63 or fewer alphanumeric characters and hyphens. Hostnames can’t start or end with a hyphen. They do not need to resolve to any IP address to create a device.
By default, Logpoint docker bridge uses the IP address range 172.17.0.0/16. If there are devices in your network using the same IP range, there will be a network conflict. To avoid network conflict, go to change-docker-bip to update the docker bridge IP range.
Select Device Groups and a Log Collection Policy.
Select a collector/forwarder from the Distributed Collector dropdown. These are all the distributed collectors and syslog forwarders configured in Distributed Logpoints. If you add more than one distributed collector, you cannot configure a fetcher for the device.
Select a Time Zone. The timezone of a device must be the same as its log source. Logpoint uses it to convert timestamps in collected logs to the user's time zone. If the time zones do not match, search results may not appear in the expected timeframe.
For example, to add two devices located in Cairo and Brisbane, set their time zones to GMT+2:00 (Cairo) and GMT+10:00 (Brisbane), respectively. For localhost devices, we recommend not changing the timezone and keeping UTC. Changing the timezone can delay log collection.
Enter the Inactivity Threshold in minutes. It specifies the time after which to mark the device as inactive in Last Log Received under device lists if no logs are received. You can enter a value from 5 to 525600.
Select Risk Values for the device. Logpoint uses these values to calculate the risk level of alerts generated from the device. The overall alert severity is determined by combining the alert rule criteria with the device’s configured risk values.
For example, if an alert rule is configured to trigger when the number of failed login attempts exceeds 100 within 5 minutes, Logpoint generates an alert only when this condition is met and assigns a risk severity based on the device’s risk values.
Click Submit.
In Available Collectors/Fetchers, select the collectors and fetchers relevant to the device.
Click Submit.
To add collectors and fetchers on existing devices, click the Add Collectors/Fetchers icon under Actions. To learn about these out-of-the-box collectors and fetchers, go to Other Collectors and Fetchers.
Adding Bulk Devices
Go to Settings → Configuration in the navigation bar and click Devices.
Click ADD BULK DEVICES.
In PROPERTY,
Enter a device Name.
Enter IP addresses or hostnames in Device address(es). IP addresses are allocated within a /16 network, allowing up to 65,536 addresses. Hostnames must follow the RFC-compliant format. A hostname can resolve to multiple IP addresses, and it is counted as a single node.
By default, Logpoint docker bridge uses the IP address range 172.17.0.0/16. If there are devices in your network using the same IP range, there will be a network conflict. To avoid network conflict, go to change-docker-bip to update the docker bridge IP range.
Select Device Groups and a Log Collection Policy.
Select a collector/forwarder from the Distributed Collector dropdown. These are all the distributed collectors and syslog forwarders configured in Distributed Logpoints. If you add more than one distributed collector, you cannot configure a fetcher for the device.
Select a Time Zone. The device's timezone must match its log source. Logpoint uses it to convert timestamps in collected logs to the user's time zone. If the time zones do not match, search results may not appear in the expected timeframe.
For example, to add two devices located in Cairo and Brisbane, set their time zones to GMT+2:00 (Cairo) and GMT+10:00 (Brisbane), respectively. For localhost devices, we recommend not changing the timezone and keeping UTC. Changing the timezone can delay log collection.
Click Submit.
In Available Collectors/Fetchers, select the collectors and fetchers relevant to the device.
Click Add.
Click Submit.
Devices are listed in BULK ADD. You can remove them by clicking the Remove icon under Actions.
Use .CSV File to Add Devices
The first line of the CSV file must be a header row with the following fields:
device_name
device_ips
device_groups
log_collection_policies
distributed_collector
confidentiality
integrity
availability
timezone
The device_name and device_ips fields are mandatory. The values provided for all the non-mandatory fields must already exist in Logpoint. For example: If you add windows in the list of device_groups, the Windows device group must already exist in Lopoint.
The field values are separated with a comma (,) but if a field has multiple values, it should be written within a double quotation mark (“”).
Logpoint predefines which timezone values you need to use in the CSV file. Use the names exactly as listed in the List of Timezones.
Import Devices via a CSV File
During device import, click Jobs to check the import status.
Go to Settings >> Configuration from the navigation bar and click Devices.
Click IMPORT.
Browse to the CSV file and click Submit.
Configure Syslog Collector via a CSV File
For the device to use a proxy, add the uses_proxy, proxy_ip, hostname of the source, and processpolicy fields in the header row of the CSV file, and the value of uses_proxy for the corresponding device must be TRUE.
For the device to be used as a proxy, add the use_as_proxy, charset, and parser fields in the header row of the CSV file, and the value of use_as_proxy for the corresponding device must be TRUE.
Proxy settings are not available for Classless Inter-Domain Routing.
Blocked IPs
BLOCKED IPS lists upto 1000 blocked IP addresses from all the devices sending logs to Logpoint within the last hour. The IPs of Syslog logs are not listed if you have enabled Accept logs from Unregistered Log Sources in Syslog.
Go to Settings >> Configuration from the navigation bar and click Devices.
Click ADD BULK DEVICES.
Click Detect Blocked IPs for a list of the IPs blocked on the ports where there are configured collectors.
To add the blocked device, double-click the blocked IP. The device’s details are in PROPERTY, where you can enter or edit the device’s properties manually. Click Add and click Submit.
To ignore the blocked IP in the list, click the Ignore icon. To view a list of all the ignored devices, click Ignored List. Click the Remove (
 ) icon under Actions to remove the devices from the list.
Device Groups
Device Groups allow you to organize two or more devices by common characteristics, such as operating system, location, or function. For example, create group devices by platform (e.g., Windows or Linux) or by location (e.g., Office A or Office B).
Device Groups are also used for user access management, allowing you to control which users can view and interact with specific device sets. Grant one user group access to a particular device group and restrict access to others. For example, Windows administrators with Logpoint access can be limited to viewing and managing only the devices in the Windows device group. One device can belong to multiple device groups.
Use the in command in search to retrieve logs from devices in a specific device group. For example, to search for logs from devices in the Linux device group, use the device_ip in DG_LINUX query.
When using a device group in a search query, ensure that:
The device group name is written in uppercase.
Underscores (
_) are used instead of spaces.
Adding a Device Group
Go to Settings >> Configuration in the navigation bar and click Device Groups.
Click ADD.
Enter a Name and Description.
In DEVICES IN THIS GROUP, type or enter the name of the device or select the name from the drop-down.
In LOGSOURCES IN THIS GROUP, type or enter the name of the Log Source or select it from the drop-down.
Click Submit.
Editing a Device Group
Go to Settings >> Configuration in the navigation bar and click Device Groups.
Click the Name of the required device group and update the information.
Click Submit.
Deleting Device Groups
Go to Settings >> Configuration in the navigation bar and click Device Groups.
Click the Delete icon under Actions.
To delete:
Multiple device groups, select the groups. Click MORE and choose Delete Selected.
All the device groups, click MORE, and choose Delete All.
Click Yes to confirm deletion.
Last updated
Was this helpful?