Other Collectors and Fetchers
Other Collectors and Fetchers
While the most widely used collector or fetcher is the SysLog Collector, there are other out-of-the-box Collectors and Fetchers.
Snare Collector
Snare Collector collects and analyzes logs from the Windows Snare agent.
Using Snare Collector
Go to Settings >> Configuration in the navigation bar and click Devices.
Click the Add collectors/fetchers icon under Actions.
Click Snare Collector.
Select a Parser, a Processing Policy, and a Charset from the dropdowns.
Click Submit.
FTP Collector
FTP Collector collects logs from the files uploaded by users using FTP clients. You can add multiple FTP collectors for a single device. Use an FTP client to forward logs to the FTP collector. We recommend FTP Rush or Filezilla.
Configuring FTP Collector in Logpoint
Go to Settings >> Configuration in the navigation bar and click Devices.
Click the " Add collectors/fetchers icon under Actions.
Click FTP Collector to see a list of all the FTP Collectors configured for the device.
Click Add.
Enter a Username and a Password. These credentials are required to configure settings on the client’s side.
Enter a Source Name, which is a unique identifier for the collector.
Select a Parser, a Processing Policy, and a Charset to apply to the logs.
Click Submit.
Configuring FTP Rush or Filezilla
Enter the address of Logpoint in Host.
Enter the Username and the Password of the FTP Collector.
Use Port 21.
Click Enter or Quick Connect to connect to the Logpoint.
Drag the log files from the Local site and drop it in the Remote site. The files are transferred to Logpoint.
SNMP Trap Collector
SNMP Trap Collector collects logs from SNMP-enabled devices. SNMP traps are alert messages devices use to notify the SNMP manager about significant events.
Configuring SNMP Trap Collector in Logpoint
Go to Settings >> Configuration in the navigation bar and click Devices.
Click the Add collectors/fetchers icon under Actions.
Click SNMP Trap Collector.
Select an SNMP Version.
For v_12, enter the Community String.
For v_3, enter a Username, Authorization Key, Security Engine ID, and Private Key. The Authorization Key must contain at least 8 characters.
Select a Processing Policy to apply to the logs.
Click Submit.
Configuring SNMP for Windows
Install Simple Network Management Protocol (SNMP) from Turn Windows feature on or off in the Control Panel.
Run services.msc command.
Search for the SNMP Service. Right-click on it and select Properties.
Select the TRAPS tab.
Add the Community name and Trap destinations.
Click OK.
To manually forward different SNMP traps:
Run the evntwin command and select custom.
Click Edit and add the event sources.
Click OK.
sFlow Collector
sFlow monitors networks, wireless, and host devices. The sFlow Collector forwards counter and flow samples using UDP or ARP. Ensure the sFlow Package is installed. The default port for sFlow is 6343.
Configuring sFlow Collector in Logpoint
Go to Settings >> Configuration in the navigation bar and click Devices.
Click the Add collectors/fetchers icon under Actions.
Click the sFlow Collector.
Select a Processing Policy to apply to the logs.
Click Submit.
Logpoint Taxonomy for sFlow Collector
sFlow Field
Logpoint Field
agent_ip_address
host_address
cs_ethernet_dot3_stats_AlignmentErrors
alignment_error
cs_ethernet_dot3_stats_CarrierSenseErrors
carrier_sense_error
cs_ethernet_dot3_stats_DeferredTransmissions
deferred_transmission
cs_ethernet_dot3_stats_ExcessiveCollisions
excessive_collision
cs_ethernet_dot3_stats_FCSErrors
fcs_error
cs_ethernet_dot3_stats_FrameTooLongs
frame_too_long
cs_ethernet_dot3_stats_InternalMacReceiveErrors
mac_receive_error
cs_ethernet_dot3_stats_InternalMacTransmitErrors
mac_transmit_error
cs_ethernet_dot3_stats_LateCollisions
late_collision
cs_ethernet_dot3_stats_MultipleCollisionFrames
multiple_collision_frame
cs_ethernet_dot3_stats_SingleCollisionFrames
single_collision_frame
cs_ethernet_dot3_stats_SQETestErrors
sqe_test_error
cs_ethernet_dot3_stats_SymbolErrors
symbol_error
cs_generic_if_direction
direction
cs_generic_if_if_status
status_code
cs_generic_if_in_bcast_pkts
in_broadcast_packet
cs_generic_if_in_discards
in_discard
cs_generic_if_in_errors
in_error
cs_generic_if_in_mcast_pkts
in_multicast_packet
cs_generic_if_in_octets
in_octet
cs_generic_if_in_ucast_pkts
in_unicast_packet
cs_generic_if_in_unknown_proto
in_unknown_protocol
cs_generic_if_index
if_index
cs_generic_if_out_bcast_pkts
out_broadcast_packet
cs_generic_if_out_discards
out_discard
cs_generic_if_out_errors
out_error
cs_generic_if_out_mcast_pkts
out_multicast_packet
cs_generic_if_out_octets
out_octet
cs_generic_if_out_ucast_pkts
out_unicast_packet
cs_generic_if_promisc
if_promiscuous
cs_generic_if_speed
if_speed
cs_generic_if_type
if_type
fs_input_if_format
input_if_format
fs_input_if_value
input_if_value
fs_output_if_format
output_if_format
fs_output_if_value
output_if_value
fs_rph_frame_length
frame_length
fs_rph_header_protocol
header_protocol
fs_rph_header_size
header_size
fs_rph_sample_dst_ip
destination_address
fs_rph_sample_dst_mac
destination_hardware_address
fs_rph_sample_dst_port
destination_port
fs_rph_sample_eth_type
ethernet_type
fs_rph_sample_ip4_flags
ip4_flag
fs_rph_sample_ip_version
ip_version
fs_rph_sample_protocol
protocol
fs_rph_sample_sender_ip_address
source_address
fs_rph_sample_sender_mac_address
sender_hardware_address
fs_rph_sample_src_ip
source_address
fs_rph_sample_src_mac
source_hardware_address
fs_rph_sample_src_port
source_port
fs_rph_sample_target_ip_address
destination_address
fs_rph_sample_target_mac_address
target_hardware_address
fs_rph_sample_tcp_flags
tcp_flag
fs_rph_sample_vlan_id
network_id
fs_rph_stripped
rph_stripped
fs_sample_pool
sample_pool
fs_sampling_rate
sampling_rate
fs_sequence_number
sequence_number
fs_source_id_index
source_id_index
fs_source_id_type
source_id_type
switch_uptime
duration
File System Collector
File System Collector collects logs from Logpoint file systems, allowing you to monitor file access, changes, and other activities. It is only applied to the localhost device. The File System collector processes all the internal logs generated in Logpoint. It captures all the logs from collectors, web servers, mergers, normalizers, services and integrations in Logpoint.
File System Collector can only access logs for files present in /var/log/ and /opt/immune/var/log. If you need to add any file path outside these two locations, contact support.
Configuring File System Collector in Logpoint
Go to Settings >> Configuration in the navigation bar and click Devices.
Click the Add collectors/fetchers icon under Actions.
Click File System Collector.
Click ADD.

Enter the File Path and Exclude Paths.
During patch installation, up to 6,000–7,000 logs may be generated, and in normal operation, up to 200–300 events are collected every 10 minutes. These logs are collected by default and stored in /var/log/audit/audit.log. This may increase storage usage by about 1 MB every 1.25 hours. You can exclude it by adding the path in Exclude Paths.
Select a Parser, a Processing Policy, and a Charset.
Click Submit.
Fetchers
WMI Fetcher
The Windows Management Instrumentation (WMI) Fetcher retrieves Windows logs.
Configuring WMI Fetcher in Logpoint
Go to Settings >> Configuration in the navigation bar and click Devices.
Click the Add collectors/fetchers icon under Actions.
Click WMI Fetcher.
Enter the Username and Password of Windows configured for the WMI Fetcher.
If the Windows user is in a domain, the username must be in the format domain\username (domain\username is invalid).
Enter the frequency at which data is retrieved in Fetch Interval (minutes).
Select Parser.
In Facility, select the code used to specify the system that has the log.
Select Severity.
Select a Processing Policy.
Select an encoding format from Charset.
Click Submit.
Configuration of Windows for WMI
Go to Control Panel >> Administrative Tools >> Components Services in the Windows device.
On Components Services, expand Component Services >> Computers.
Right-click My Computer and select Properties.
Select COM Security.
Click Edit Limits in Launch and Activation Permissions.
Click Add.
Click Advanced.
Click Find Now.
Select a user and click OK.
The username is displayed in the name field in Select Users or Groups.
Click OK.
In Launch Permission, select Remote Launch and Remote Activation.
Click OK.
Configuration of Windows for WMI with Non-admin Rights
Create a new user from Administrative Tools >> Active Directory Users and Computers in the Windows device.
Add users to the following groups.
Distributed COM users
Performance monitor users
Event log readers
Open WMI Control console.
Click Start.
Click Run.
Type wmimgmt.msc.
Click OK.
Right-click on WMI control and click Properties.
Click Security and click Add.
In Select Users, Computers, or Groups, enter the name of Performance monitor users.
In Security, under Permissions, select Permissions. Add Remote Enable and Read Security.
Assign the user to use Component Services.
Go to Component Services under Administrative Tools.
On Components Services, expand Component Services/Computers.
Right-click My Computer and select Properties.
Select COM Security.
Grant Access Permissions (Remote Access) and Launch and Activation Permissions (Remote Launch and Remote Activation) to the newly created user.
FTP Fetcher
FTP Fetcher fetches logs from the relative file path of the FTP server. You can configure FTP Fetcher from Log Source or Devices. We recommend configuring it from the log source, as it provides a centralized User Interface for all configurations.
Configuration from Log Source
FTP Fetcher consists of the log source template, FTP Fetcher, which has pre-defined settings and configurations to fetch logs. However, some fields in the template must be configured manually.
To configure FTP Fetcher from Log Source:
Go to Settings >> Log Sources in the navigation bar and click + Add Log Source.
Click + Create New and select FTP Fetcher.
Source
Add details about the FTP server from where the FTP Fetcher fetches logs
Click Source.
Enter the Log Source’s Name.
Enter the IP addresses of the device whose logs are to be monitored in Device Addresses.
Select Device Groups.
Select the Time Zone.
Select the risk values for Confidentiality, Integrity, and Availability.
Connector
Configure how the FTP Fetcher and the FTP server communicate.
Click Connector.
Enter the FTP server Username and Password. When editing FTP Fetcher, you must re-enter the password.
Enter the Port on which the FTP server is running. The default port is 21.
Enter the frequency at which data is retrieved in Fetch Interval (min). If logs are not received for two consecutive intervals, the log source is marked as inactive in Last Log Received under
Settings >> Log Source.If you are using a Distributed Logpoint, select Distributed Collector from the dropdown.
Fetchers
Configure the file path from where logs are fetched.
Click Fetchers.
Enter the Relative FilePath.
Enter a valid Python regular expression (regex) in Filename Pattern that matches the files to fetch from the FTP server. Example:
^.\.txt$*matches all files ending in.txt.
Glob-style patterns are not supported (e.g. .txt, .log, etc). You must replace the glob-style pattern with an equivalent Python regex, for example:
Instead of
.txt, use.*\.txt$Instead of
.log, use^.*\\.log$Instead of
logs-.json, use^logs--.json%$
Select Forward Old Logs to fetch logs from the file before configuring the log source.
Select a Parser to parse the logs.
Select the Charset.
Routing
Create repos and routing criteria for FTP Fetcher. Repos are locations where incoming logs are stored, and routing criteria are created to determine the conditions under which these logs are sent to repos.
To create a repo:
Click Routing and + Create Repo.
Enter a Repo name.
In Path, enter the location to store incoming logs.
In Retention (Days), enter the number of days logs are kept in a repository before they are automatically deleted.
In Availability, select the Remote logpoint and Retention (Days).
Click Create Repo.
In Repo, select the created repo to store logs.
To create Routing Criteria:
Click + Add row.
Enter a Key and Value. The routing criteria are only applied to those logs that have this key-value pair.
Select an Operation for logs that have this key-value pair.
Select Store raw message to store both the incoming and the normalized logs in the selected repo.
Select Discard raw message to discard the incoming logs and store the normalized ones.
Select Discard entire event to discard both the incoming and the normalized logs.
In Repository, select a repo to store logs.
Click the Delete icon under Action to delete the created routing criteria.
Normalization
Select normalizers for the incoming logs. Normalizers translate a raw log message into the
Click Normalization.
You can either select a previously created normalization policy from the Select Normalization Policy dropdown or select a Normalizer from the list and click the swap icon.
Enrichment
Select an enrichment policy for the incoming logs. Enrichment Policies are used to add additional information to a log, such as user information, device type or geolocation.
Click Enrichment.
Select an Enrichment Policy.
Click Create Log Source to save the configurations of Source, Connector, Fetchers, Routing, Normalization, and Enrichment.
Configuration from Devices
Configuring FTP Fetcher from Devices
Go to Settings >> Configuration in the navigation bar and click Devices.
Click the Add collectors/fetchers icon under Actions.
Click FTP Fetcher.
Click ADD.
Enter Username and Password. When editing FTP Fetcher, you must re-enter the password.
Enter Port on which the FTP is running. The default port is 21.
Enter the Relative FilePath
Enter a valid Python regular expression (regex) in Filename Pattern that matches the files to fetch from the FTP server. Example:
^.\.txt$*matches all files ending in.txt.Glob-style patterns are not supported (e.g. .txt, .log, etc). You must replace the glob-style pattern with an equivalent Python regex, for example:
Instead of
.txt, use.*\.txt$Instead of
.log, use^.*\\.log$Instead of
logs-.json, use^logs--.json%$
Select Forward Old Logs to fetch logs from the file before configuring the log source.
Enter the frequency at which data is retrieved in Fetch Interval (min).
Select a Parser to parse the logs.
Select a Processing Policy, and a Charset.
Click Submit.
SCP Fetcher
SCP Fetcher fetches logs from the log files in a remote host using the SSH connection. You must enable SFTP (SSH File Transfer Protocol) in the remote server to fetch logs using the SCP Fetcher.
Configuring SCP Fetcher
Go to Settings >> Configuration in the navigation bar and click Devices.
Click the Add collectors/fetchers icon under Actions.
Click SCP Fetcher.
Click Add.
Enter a Username for the fetcher.
Enter the Relative FilePath and the Filename Pattern to specify from which files to fetch logs.
Select Forward Old Logs to fetch logs from the file before configuring the log source.
Enter the Port number the SCP uses to listen for the remote server. The default SCP port is 22.
Enter the frequency at which data is retrieved in Fetch Interval (min).
Select a mode of Authentication: Password or SSH Certificate.
If you choose Password, enter or type the password.
If you choose SSH Certificate, Logpoint automatically generates a certificate key for you.
Copy the password or the SSH certificate key, as it is required later for the user validation.
Choose a Parser, a Processing Policy, and a Charset.
Click Submit.
SNMP Fetcher
SNMP Fetcher allows you to send SNMP queries to network devices and receive responses in Logpoint. You can then use these responses as event logs for further analysis.
SNMP Fetcher needs an SNMP Policy to make the SNMP Walk query. SNMP Policy is a set of OIDs and their query time intervals.
SNMP Fetcher makes an SNMPWALK query. The query uses SNMP GETNEXT requests to get the logs from a network entity. An object identifier (OID) is used while making this query. The OID specifies all the branches of the OID tree for fetching. All variables in the sub-tree below the given OID are queried, and their values are presented to the user.
Before configuring the SNMP Fetcher, create an SNMP Policy.
Creating an SNMP Policy
Go to Settings >> Configuration in the navigation bar and click Devices.
Click the Add collectors/fetchers icon under Actions.
Click SNMP FETCHER.
Click Policy and click ADD.
Enter the Name of the policy.
Enter a list of OIDs and their respective Fetch time (in minutes).
Click Submit.
Configuring SNMP Fetcher
Go to Settings >> Configuration in the navigation bar and click Devices.
Click the Add collectors/fetchers icon under Actions.
Click SNMP Fetcher.
Select the SNMP Version of the server.
For Version1/Version2 (v_12) enter Community String.
For Version3 (v_3) enter Username, Authorization Key, and Private Key. Enter the Authentication Protocol and Privacy Protocol of the SNMP server from which Logpoint fetches logs.
Enter the Port number.
Select the previously created SNMP Policy. You can also apply a policy from plugins.
Select a Processing Policy to apply to the logs.
Select an encoding format from the Charset dropdown.
Click Submit.
SDEE Fetcher
Security Device Event Exchange (SDEE) is a network protocol used by security devices to communicate. You can forward network statistics from SDEE devices to Logpoint via the SDEE Fetcher.
Configuring SDEE Fetcher
Go to Settings >> Configuration from the navigation bar and click Devices.
Click the Add collectors/fetchers icon under Actions.
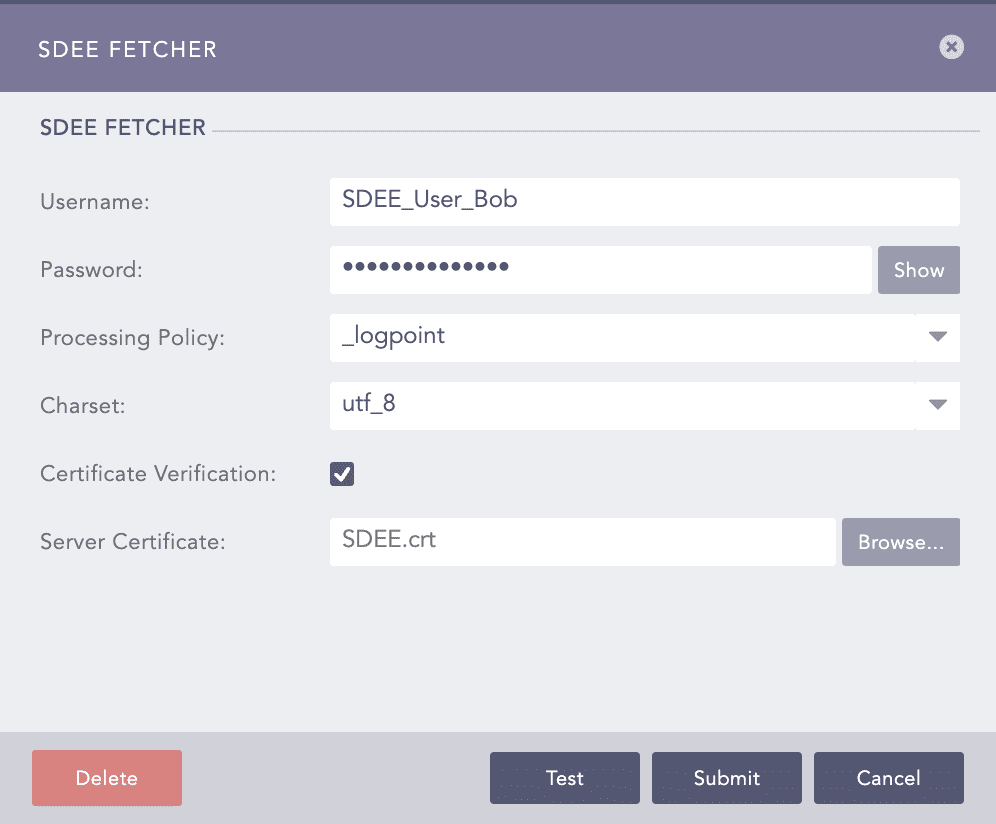
Click SDEE Fetcher and configure its essential parameters.
Enter Username and Password.
Select a Processing Policy, and a Charset.
Select Certificate Verification to ensure Logpoint enables connection by verifying SSL/TLS certificates.
Browse to upload a server certificate. If no certificate is uploaded, Logpoint uses a default certificate.
Click Submit.
Last updated
Was this helpful?