Alert Notifications
Alert Notification notifies you when an alert rule is triggered. You can set it to send a notification every time the alert rule is triggered, or send it manually from Incidents. By defining how and when you are notified, alert notifications help ensure timely response, reduce the risk of security incidents, and support effective incident handling.
Logpoint supports multiple notification types, allowing you to integrate alerts into your existing workflows and tools:
Email Sends alert details directly to specified email addresses when an alert rule is triggered. You must configure the SMTP service before using email notifications.
HTTP Sends an HTTP or HTTPS request to a specified URL when an alert rule is triggered. Supported request methods include GET, POST, PUT, DELETE, PATCH, and HEAD.
IncMan Sends critical event notifications directly to IncMan Incident Management for centralized incident handling.
SSH Executes a command or script on a remote server via SSH using data from the triggered alert.
SSH for Syslog Sends alert data to a remote system over SSH in syslog format.
SMTP for Syslog Sends alert data using SMTP in syslog format.
SMS Sends alerts to a mobile device via SMS. The SMSC server must be accessible from Logpoint before configuring SMS notifications.
SNMP Sends alerts to an SNMP-enabled network management system for integration with monitoring tools.
Setting Up Email Notifications
Go to Settings >> Knowledge Base in the navigation bar, then click Alert Rules.
Continue with ALL RULES or click the ALL RULES dropdown to select one of these filters: My Rules, Used Rules, or Shared Rules.
Select a specific alert rule, then click the Setup Notification icon in its Actions.
Select multiple alert rules, then in the MORE dropdown, click Setup Notifications of Selected Alert Rules.
Click SELECT ALL at the top right, then in the MORE dropdown, click Setup Notifications for Selected Alert Rules.
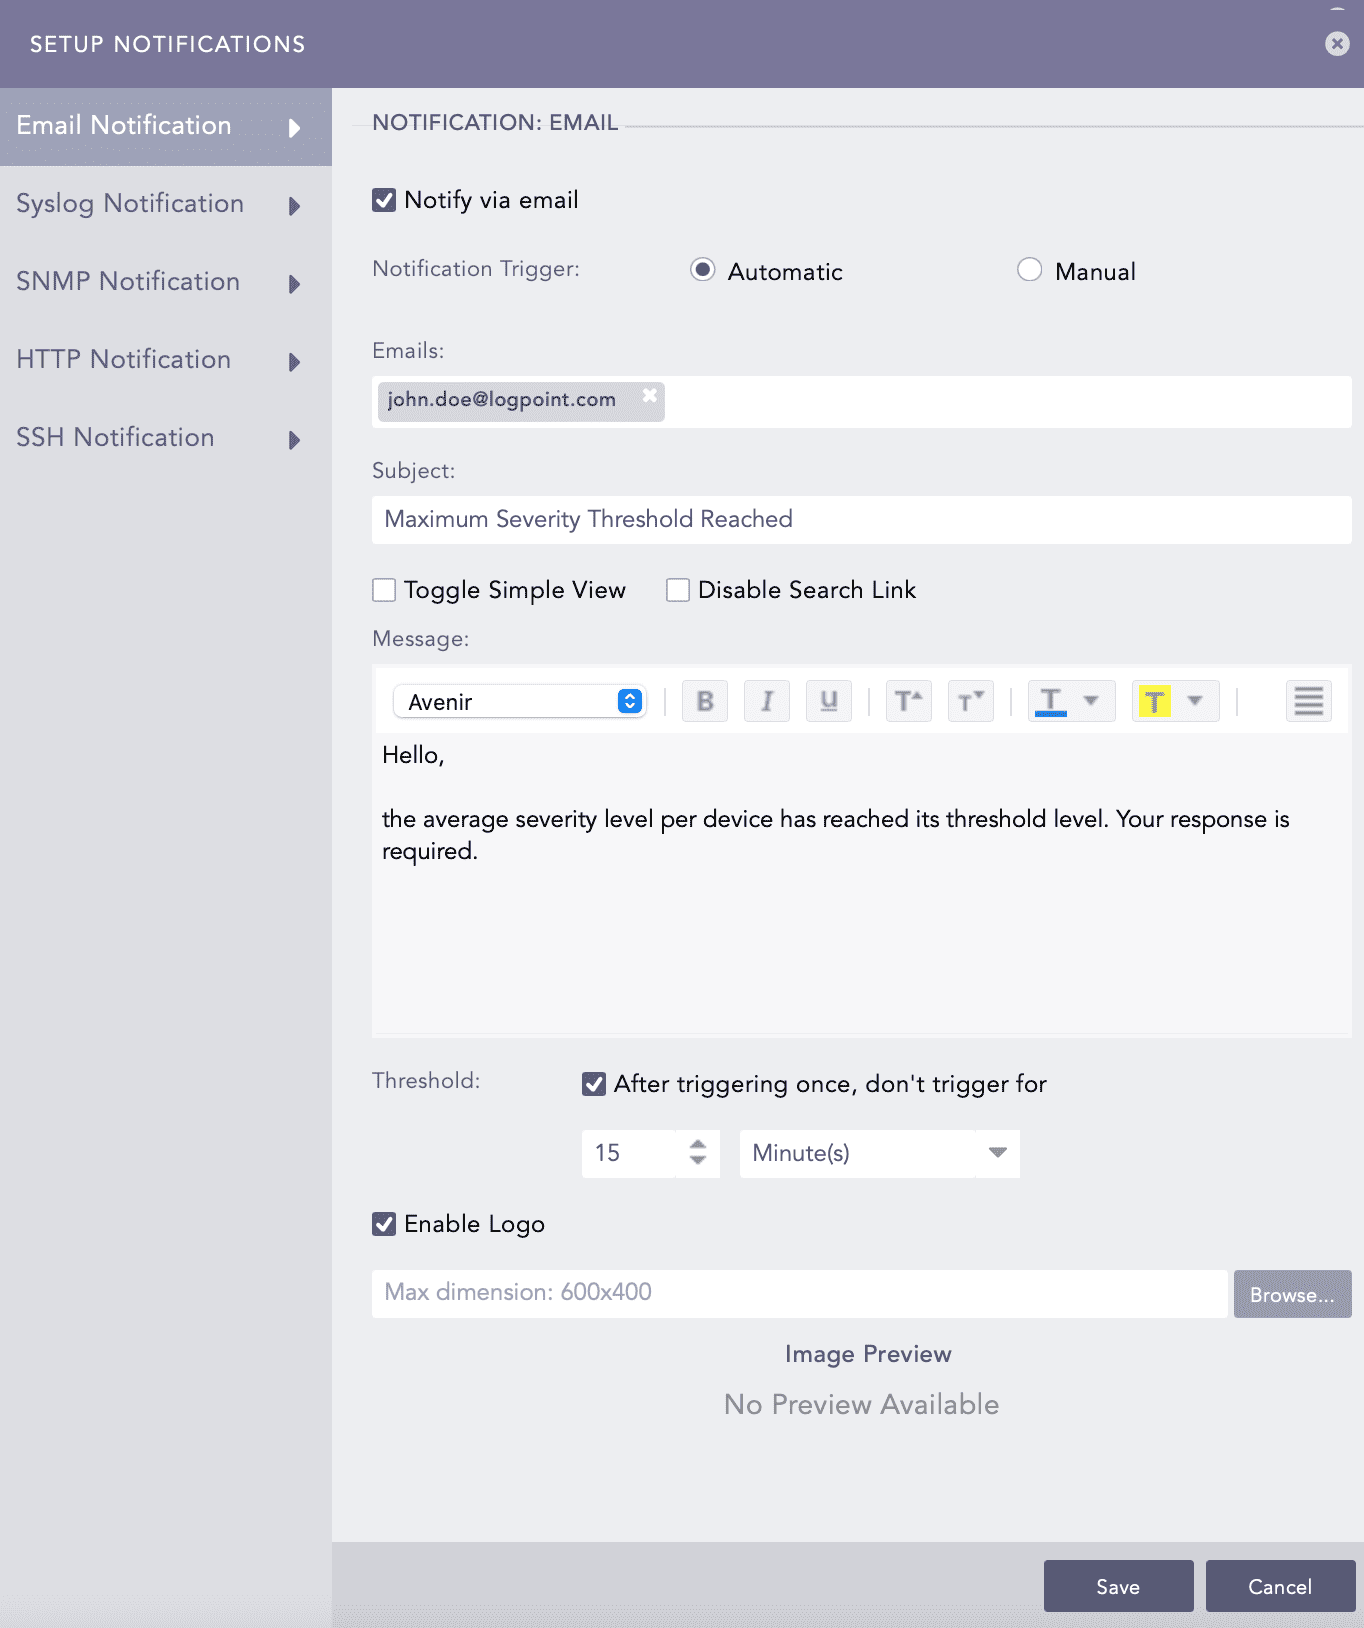
Click Email Notification and select Notify via email.
In Notification Trigger:
Select Automatic to send a notification every time the alert rule is triggered.
Select Manual to manually send the notification from Incidents.
Enter a valid email address(es) in Emails.
Enter a Subject. Logpoint supports various Jinja commands for alert rules. You can use the Jinja placeholders as templates to customize the output of your subject. Write them in the Subject field as:
Logs from {{rows[0].col_type}} on date {{rows[0].col_ts|datetime}}To learn more about which Jinja commands you can use for the Subject and Message fields, go to Logpoint Reserved Jinja Placeholders and for the examples, go to Jinja Templates.
Select Toggle Simple View to enable or disable the advanced text editor.
Select Disable Search Link to remove the search link in the email. The search link redirects to the Logpoint search page, from which the email notification is configured.
Enter a Message and set the Threshold.
Select Enable Logo to include the Logpoint logo in the email notification and deselect Enable Logo to not include and click Save.
Browse for the image in the JPG/JPEG format to provide a custom logo. The maximum dimension for the custom logo is 600*400.
Click Save.
Setting Up HTTP Notifications
Logpoint can send an HTTP POST or GET request to a specified URL when an alert rule is triggered.
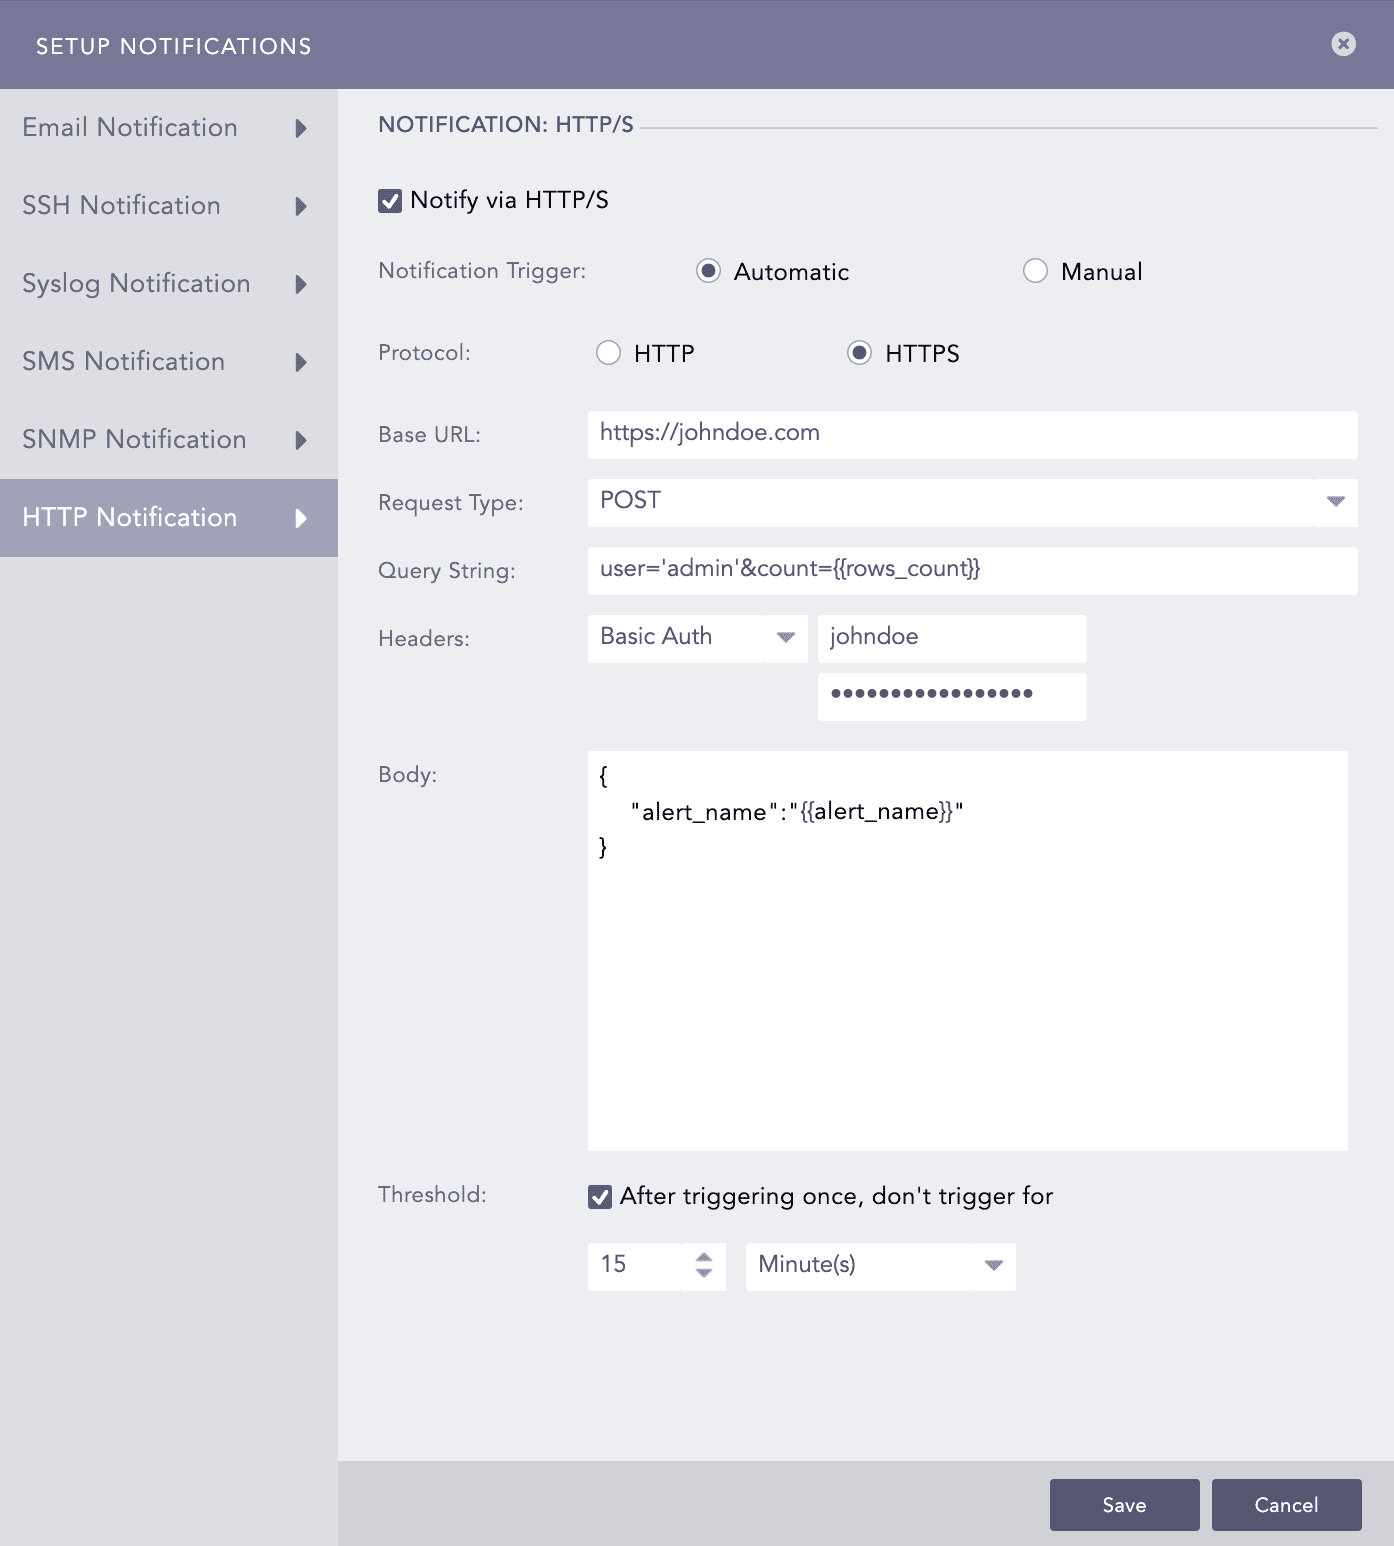
Click HTTP Notification and select Notify via HTTP.
In Notification Trigger:
Select Automatic to send a notification every time the alert rule is triggered.
Select Manual to manually send the notification from Incidents.
Select Protocol as HTTP or HTTPS.
Enter either a valid IP address or a domain name in the Base URL field.
Select a Request Type from the drop-down.
Enter a Query String. Use the Jinja commands in the Query String and Body fields. You must input JSON string in the Body field. To learn more about which Jinja commands to use for the Body field, go to Logpoint Reserved Jinja Placeholders, and for the examples, go to Jinja Templates.
You can write them in a query as:
user='admin'&count={{rows_count}}Select an authentication Header type.
If you select Basic Auth, enter the Key and Password.
If you select API Token, enter the Key and Value.
If you select Bearer Token, enter the Key.
Enter a template for the Body of the HTTP notification in Jinja format. You can enter the template only for the POST, PUT, and PATCH request methods.
Set the Threshold and click Finish.
Setting Up IncMan Notification
Use IncMan notification to escalate critical events directly to IncMan, ensuring that incidents are investigated and resolved with minimal delay.
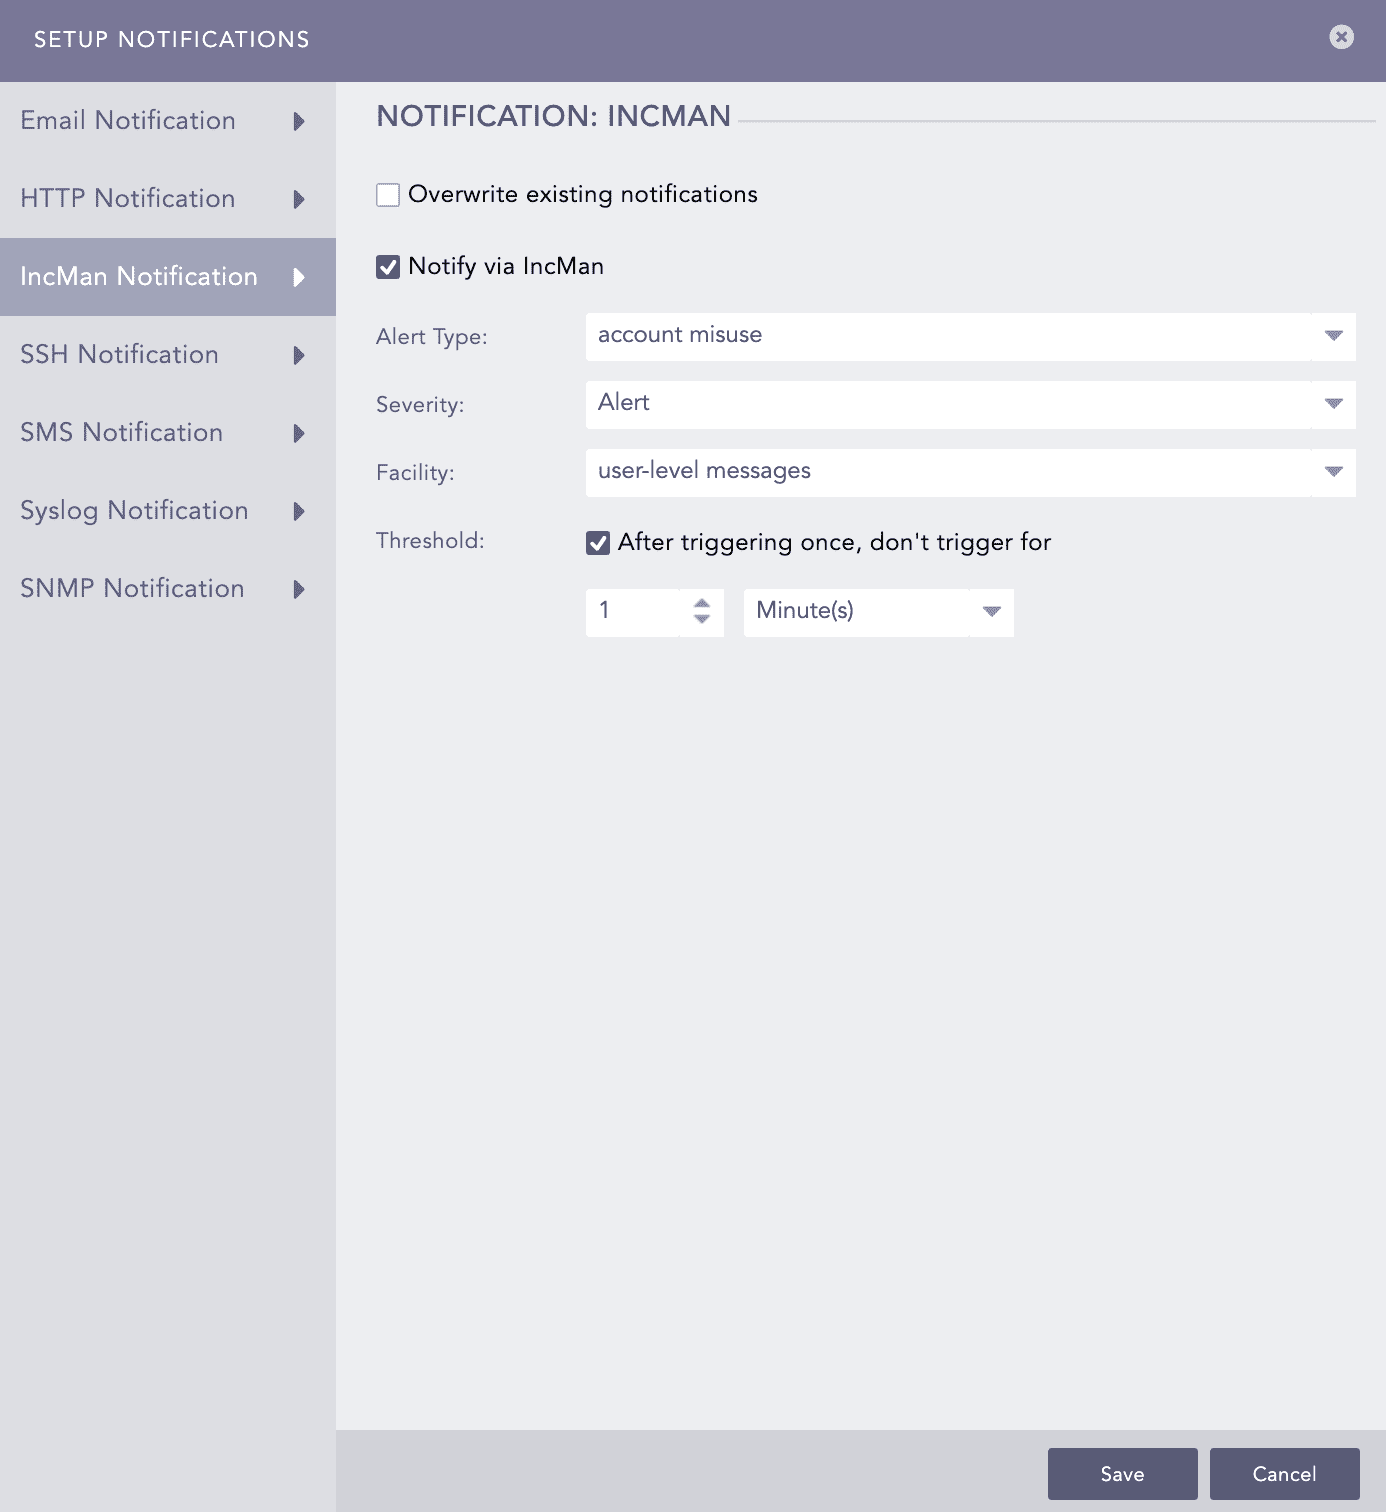
Click IncMan Notification and select Notify via IncMan.
Select Alert Type, Severity, Facility, and Threshold from the dropdown.
Select Threshold and set the trigger interval in minutes. The threshold determines how many times an event must occur before triggering an alert, while the interval defines the time gap for evaluating the threshold.
Click Save.
Setting Up SSH Notification
Configure alert notification to execute a command or script on a remote server via SSH based on the alert information when an alert is triggered.
Click SSH Notification and select Notify via SSH.
In Notification Trigger:
Select Automatic to send a notification every time the alert rule is triggered.
Select Manual to manually send the notification from Incidents.
Enter a Server address and a Port number.
Enter a Username for the user in the destination server.
Enter a Command to execute when the alert rule is fired. Make sure that the command is a valid bash command and is executable. You can use the Jinja commands in the Command field. To learn more about which Jinja commands you can use for the Command field, go to Logpoint Reserved Jinja Placeholders and for the examples, go to Jinja Templates.
Select the required mode of Authentication: Password or SSH Certificate.
If you select Password, enter a passkey in the Password tab.
If you select SSH Certificate, select the Certificate type: System Certificate or User Certificate. The SSH Certificate key is automatically generated. You must add the key to the authorized keys at ~/.ssh/authorized_keys in your system.
If you select System Certificate, Logpoint uses a system-specific certificate for authentication.
If you select User Certificate, Logpoint uses an individual user-specific certificate for authentication.
Set the Threshold and click Finish.
Setting Up SMS Notification
SMS notifications enable users to receive alerts on their mobile devices. Before configuring SMS notification, SMSC server must be accessible from Logpoint.
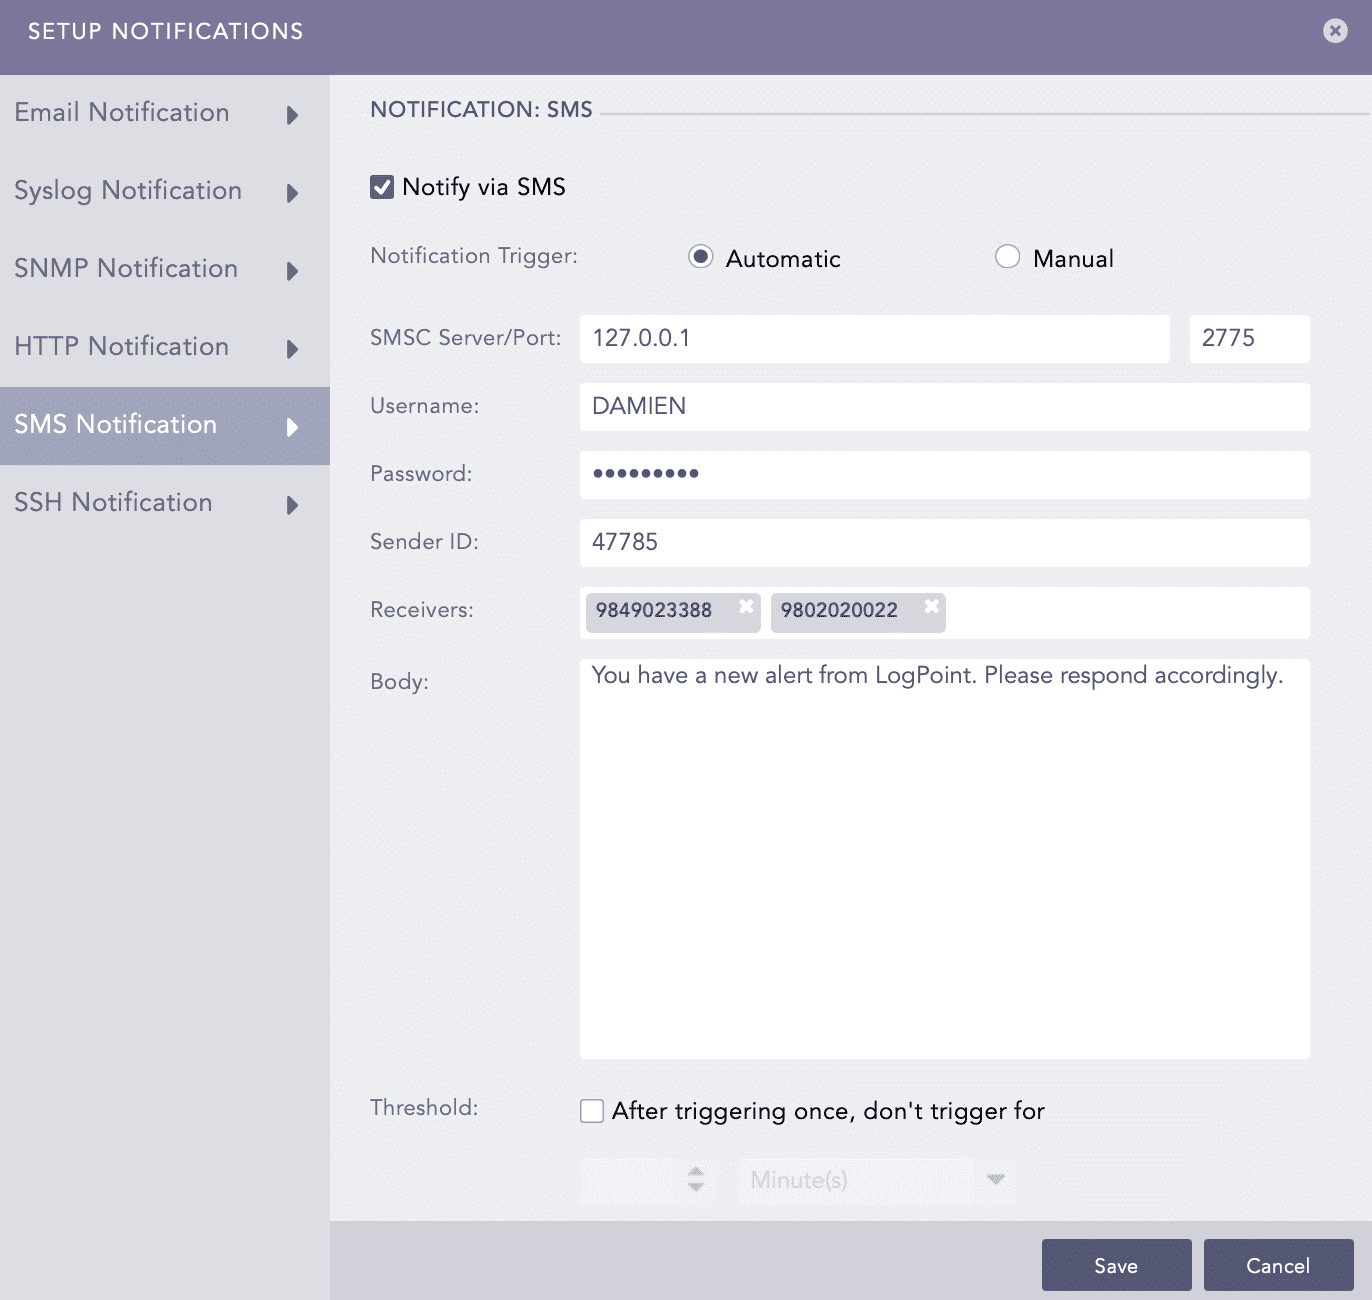
Click SMS Notification and select Notify via SMS.
In Notification Trigger:
Select Automatic to send a notification every time the alert rule is triggered.
Select Manual to manually send the notification from Incidents.
Enter SMSC Server/Port. The SMSC server supports both hostname and IP address.
Enter Username, Password, and Sender ID of the server.
In Receivers, enter the phone numbers of the receivers. You can also include the country code if necessary.
In Body, enter the SMS message. You can also use Jinja commands. To learn more about which Jinja commands you can use for the Body field, go to Logpoint Reserved Jinja Placeholders and for the examples, go to Jinja Templates.
Set the Threshold time to trigger the SMS notification after enabling it.
Click Save.
Configuring Syslog Notification
When an alert rule is triggered, Logpoint sends the alert details to the Syslog server, where they can be stored, analyzed, or forwarded.
Click Syslog Notification and select Notify via Syslog.
In Notification Trigger:
Select Automatic to send a notification every time the alert rule is triggered.
Select Manual to manually send the notification from Incidents.
Enter the IP Address and port number for the syslog receiver in the Server/Port text boxes.
Select the level of Severity and Facility from the drop-downs.
Enter a Message that provides the information about the event. You can use the Jinja template to construct a message that extracts specific information about the event. To learn more about which Jinja commands you can use for the Message field, go to Logpoint Reserved Jinja Placeholders and for the examples, go to Jinja Templates.
Set the Threshold.
Select the UDP or TCP protocol to send the Syslog Notification.
If you use UDP, the log message may be dropped, or it may arrive out of order.
If you use TCP, the log message arrives without being dropped and in order.
Select the Send each new line as separate syslog notification checkbox to generate one syslog message for each log message in the search results. If you do not select it, all messages within the incident's chosen time range are compressed into a single syslog message in the search results. The Send each new line as separate syslog notification option is useful only if the Message textbox contains a Jinja template with a for loop.
SMTP and SSH services can use Jinja2 syntax in messages or commands.
Configuring SNMP Notifications
Logpoint sends an alert to an SNMP-enabled network management system when an alert rule is triggered.
Click SNMP Notification and select Notify via SNMP.
In Notification Trigger:
Select Automatic to send a notification every time the alert rule is triggered.
Select Manual to manually send the notification from Incidents.
Enter the trap receiver’s IP address and the Port number.
Enter a valid SNMP trap or Enterprise-specific OID (Object Identifier) in the dotted decimal format. Make sure not to use the OID with a leading dot.
Select SNMPv2c or SNMPv3 according to the security level you require. The notification settings change according to the version you pick.
For SNMPv2c configuration
Enter the name of the Agent that sends the SNMP trap.
Enter a passphrase in the Community String. The passphrase should be recognizable by the manager.
Enter the OID’s corresponding value in the Message.
For SNMPv3c configuration
Enter the Username.
Enter the Authorization Key and Private Key. You can select whether to Show or Hide your key.
In the Message field, enter the OID’s corresponding value. You can use the Jinja commands in the Message field. To learn more about which Jinja commands you can use for the Message field, go to Logpoint Reserved Jinja Placeholders and for the examples, go to Jinja Templates.
Set the Threshold.
Click Save.
For SMTP
For SMTP, you can include the Jinja2 syntax in the Message textbox to deliver more information about the alert rule fired. Using Jinja2, you can explain the incident in an elaborate way and can fetch individual data while the alert is fired.
{{rows_count}} returns the count of the rows.
{{rows}} returns the list of rows returned from a search query.
{{rows}} returns a list in a machine-readable format which is difficult to read. Use filter functions with your Jinja syntax for a readable list. The available filter functions are as follows:
readable This command has its effect according to the query provided in the alert; for plain search, it returns the result in a list, whereas for queries with a chart/time chart, it displays the output in a tabular form. Use this filter as:
date
You can convert the fields containing UNIX timestamps in year/month/day format. Use this filter as:
time This command converts the UNIX timestamp and displays the time in the format hour:minute:second. Use this filter as:
datetime You can use this syntax to convert datetime from UNIX timestamp. The result is displayed in the year/month/day hour:minute:second format. Use this filter as:
You can also provide additional parameters to specify the required format.
Syntax to specify the format:
For example:
Iteration Through Values
You can iterate through the values returned from {{rows}}, use loops to view the items returned.
For query
You can use the following syntax in the message:
This outputs the device_ip for every list returned by rows.
For Simple Search
You can use the readable function in case of simple search queries. If the parameters returned from the search queries contain UNIX timestamps, then you can use the date, time, or datetime to convert them into a readable form.
For searches with chart/timechart You can use the readable function to clearly understand the values returned from the {{rows}}. If grouping functions used in the search query return the parameters containing UNIX timestamps, then you can convert filter functions date, time, and datetime into readable form. All the filter functions except the readable should be used in loops.
When using a timechart in a search query, the timechart function is considered an aggregation function because it returns a UNIX timestamp for the search results. Therefore, when you use timechart count(), the count() part is the primary aggregation function. You can use the Jinja syntax as:
where colx is the displacement count of the timechart function.
Timechart can be represented with the timestamp, so you can write Jinja syntax as:
Order of Operations
For query:
Use the following jinja syntax:
The grouping function is written as it is in the query making device_ip and source_address same in query and syntax. Aggregation functions can be mentioned with their aliases; max(port) in the search query is denoted as MAX in jinja syntax. You can use the position of the functions and name them accordingly.
For the query above:
The numbering starts from the first grouping function and goes from left to right as:
The complex functions such as step(destination_port,100) can not be used directly in jinja, the only way to use them is by using displacement count.
Example:
Once the grouping functions are done with naming, the order moves to the beginning of the aggregation function and the numbering goes as:
If aliases are used for aggregation functions, they can be written directly in jinja syntax. In the example above, for max(port) the Jinja syntax can be written as:
For SSH
For SSH in the SSH command, you can use the following Jinja2 keywords:
Keyword
Syntax Definition
{{rows_count}}
Number of rows
{{alert_name}}
Name of the alert
{{correlation_name}}
Name of the correlation
{{detection_timestamp}}
Detection timestamp
{{risk_level}}
Risk level
For example:
For the query User Login, you can use the command:
After the alert is fired, the login_alert text is created at the destination location with the number of rows and the risk level of the alert.
Was this helpful?