Incident Management
An incident represents the individual circumstances or conditions that indicate a potential threat that requires investigation and potential action. An incident is generated automatically when the query defined in an alert rule detection, or alert criteria, finds a match in one or more log messages. You can use the incident to investigate whether there is a real threat or not. The incident contains all the log events detected, which can be mapped to identified MITRE ATT&CK techniques.
Incidents are detected separately or they can be used to build off each other to chain together a timeline of that describe the flow of an attack. You can view the log source the incident is based on ans also determine whether the incident was triggered by an alert rule or by a search query.
You are notified that an incident is generated through SSH, SNMP, HTTP, or Syslog.
When you view incidents, the background color tells you the incidents severity.
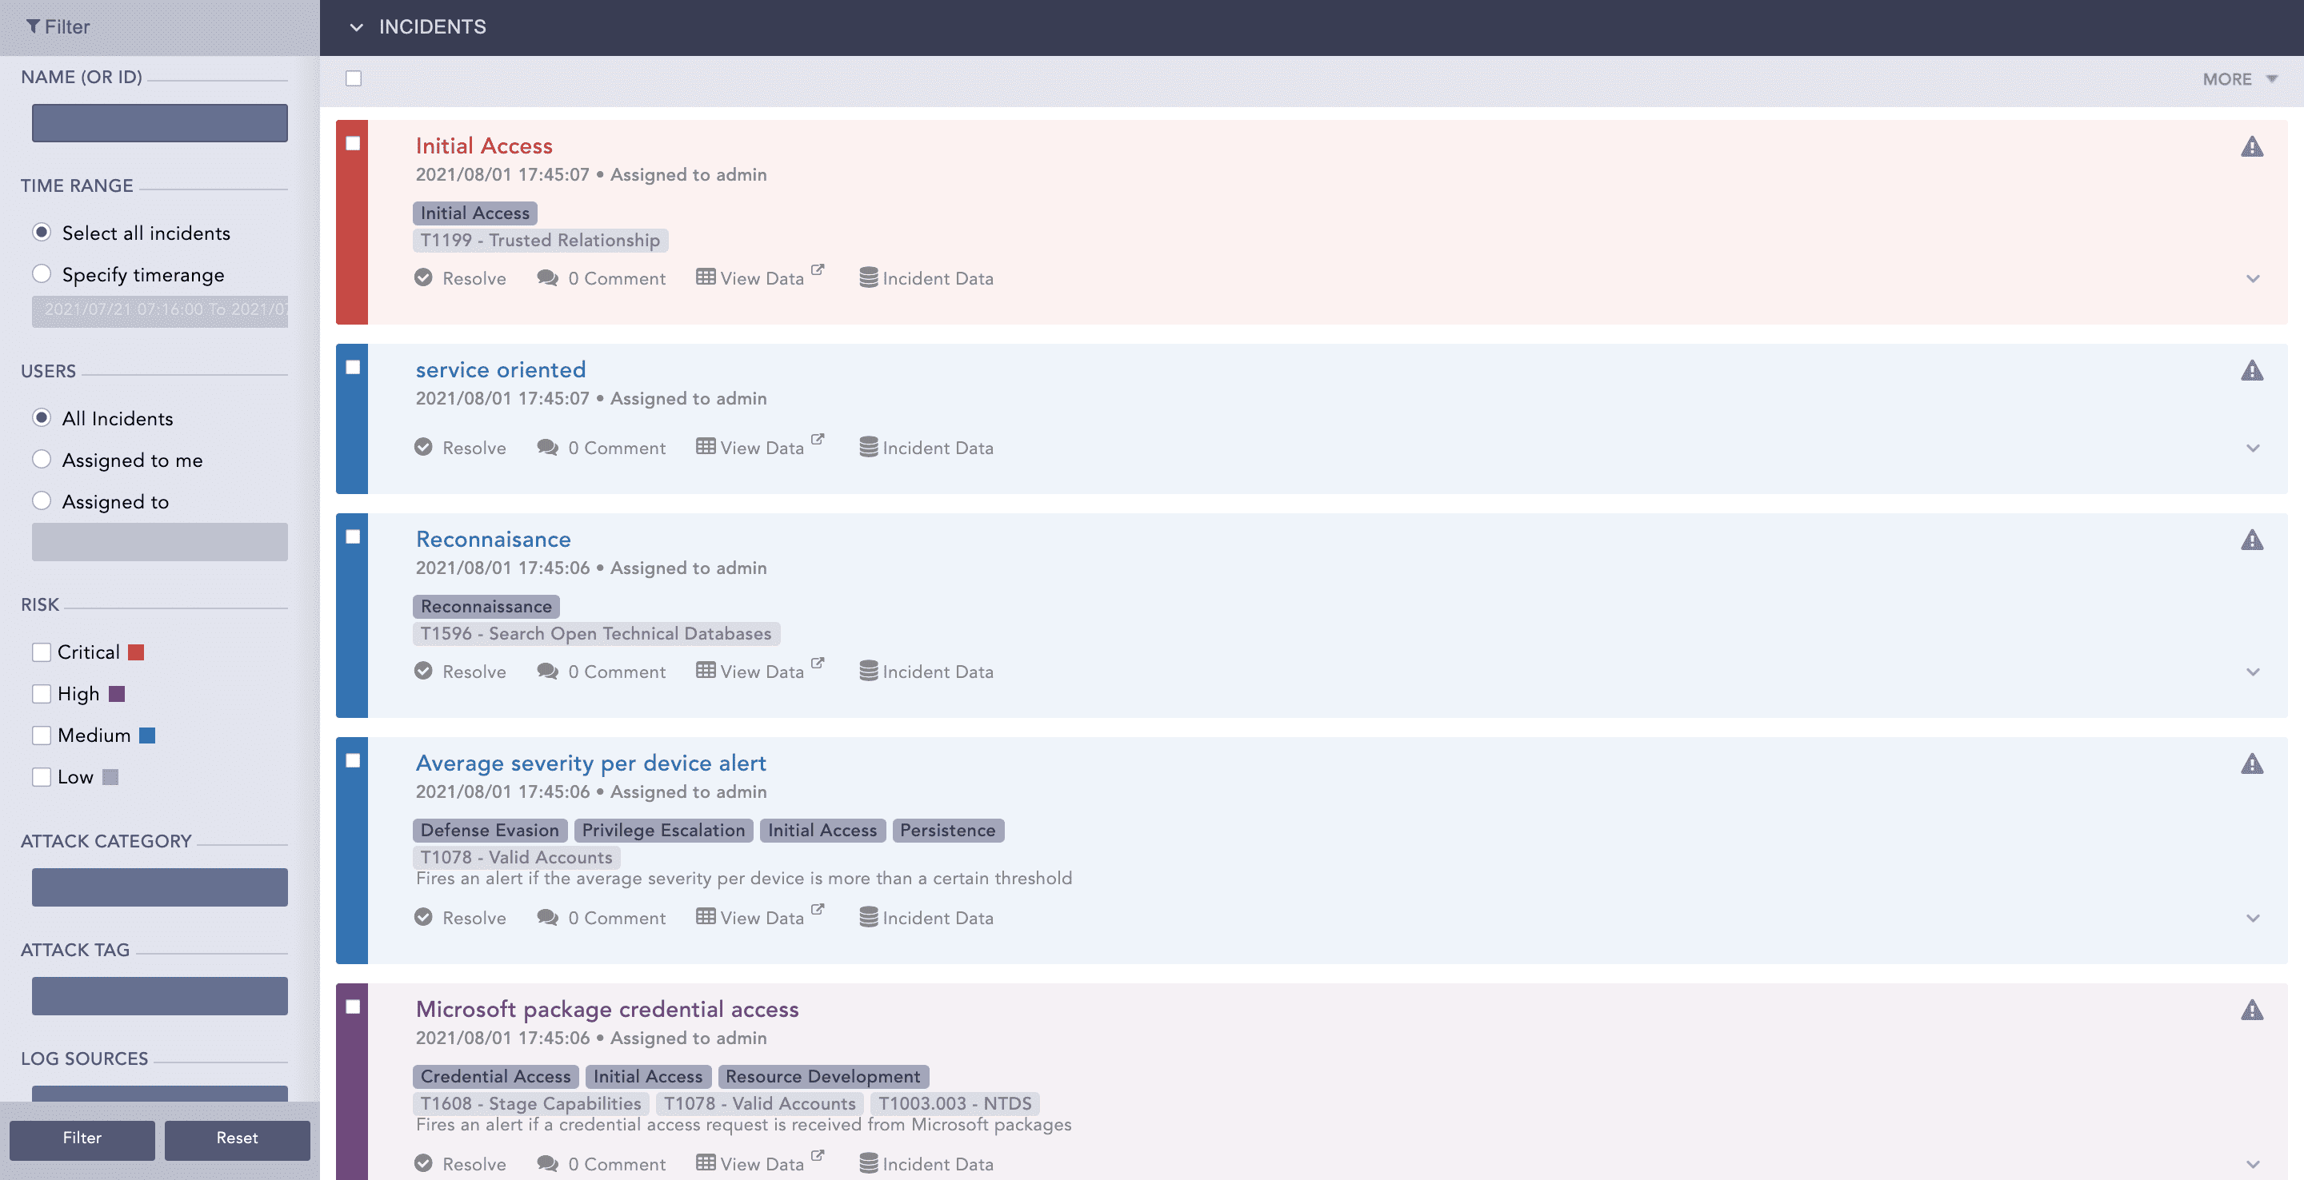
Critical
Red
High
Purple
Medium
Blue
Low
Gray
Incident Data
Incidents contain the data or details necessary to investigate whether there is a real threat or not. The incident contains all the log events detected, which can be mapped to identified MITRE ATT&CK techniques.
There are two ways to view incident data:
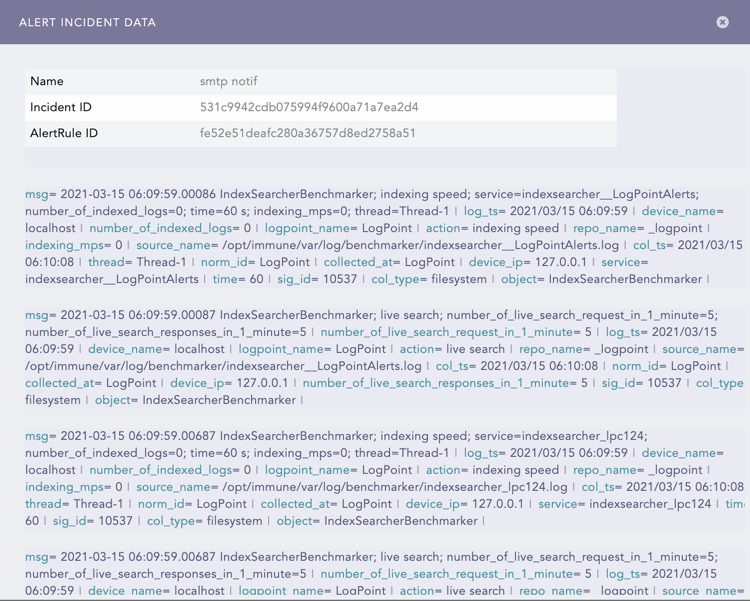
Incident Data lists the logs and the alert rule that generated the incident. If an incident was created manually, there won't be an Alert ID.
Incident Details takes you to the Alert Rule query that generated the incident. Incident details also include the timestamp when the incident was generated.
Viewing Incident Data
In the navigation bar, click Incidents Cases and select Incidents.
Find the incident in the list to investigate and click Incident Data.
If an incident was created manually, there won't be an Alert ID.
View Data for an Incident
In the navigation bar, click Incidents Cases and select Incidents.
Find the incident in the list to investigate and click View Data.
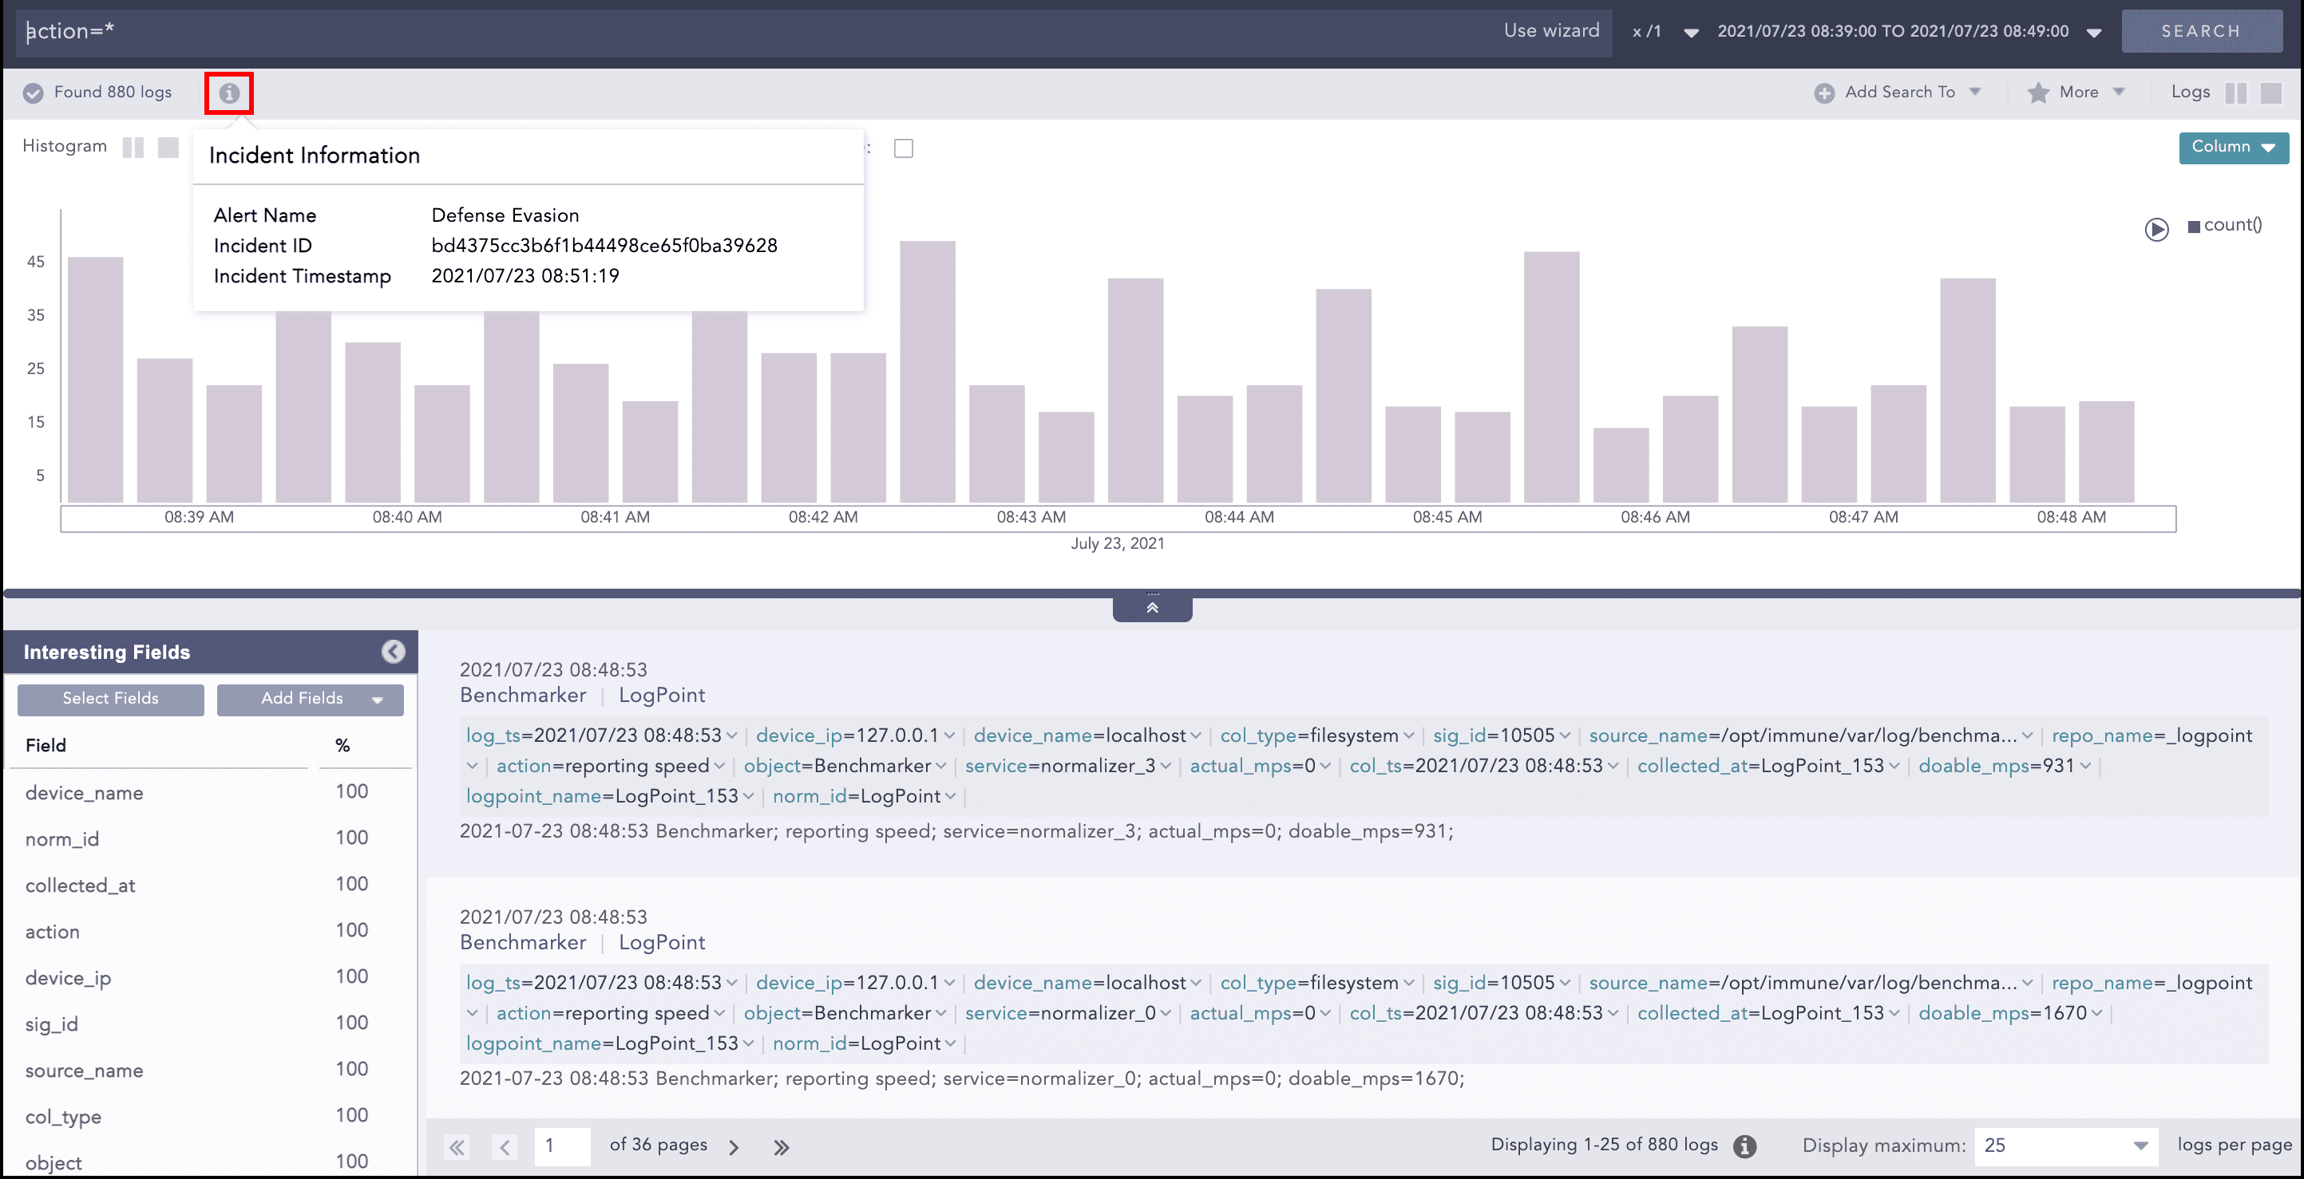
Click the information icon at the top to get the Alert Rule, Incident ID and timestamp.
Incident Investigation
When an alert triggers an incident, Logpoint notifies users based on the configured Alert Notifications. If notifications are not configured or are set to manual, users can still access and investigate the incident directly in Logpoint. To send email notifications, you must first configure SMTP settings.
During an investigation, you can assign the incident to yourself to take ownership and track responsibility. As the investigation progresses, you and other Logpoint users can add comments to document findings, assumptions, and next steps. These comments are shared and visible to all users, ensuring transparency and effective collaboration throughout the incident response process.
Sending an Incident for Investigation
In the navigation bar, click Incidents Cases and select Incidents.
Find the incident in the list to investigate. Select it by clicking the small checkbox on the left.
Click More.
Click Send Selected for Investigation or Re-Send For Investigation, depending on whether the incident was sent already.
Enter the email address of the user and an email subject.
Select Disable Search Link to disable a Logpoint-based link that directs the user to the incident.
Click Enable Logo to add one, then browse to the logo file location.
Click Submit.
Assigning an Incident to Yourself
In the navigation bar, click Incidents Cases and select Incidents.
Find the incident in the list to investigate. Select it by clicking the small checkbox on the left.
Click Assign to Me.
Add Comment to Incident
In the navigation bar, click Incidents Cases and select Incidents.
Find the incident in the list to investigate. Select it by clicking the small checkbox on the left.
Click Comment.
Add your comment and click Post.
Create an Incident
There are four ways to create an incident:
From the Search Interface based on a search query.
From an Alert Rule.
From Widgets in Dashboards.
From Widgets in Search Templates.
Create Incident from Search Interface
Any Logpoint user can create an incident. However, only users who are already part of an Incident User Group can assign an incident to other users. When you are assigned to an incident you are responsible for managing it.
If you are not part of the Incident User Group and you create an incident, you are automatically assigned to the incident yourself.
Create Incident and Assign to Yourself
Go to Search from the navigation bar.
Execute a query to create an incident.
Click Add Search To drop-down and select Incident.
Click Next.
Select the Attack Tag from the drop-down. You can select multiple tags to categorize the incidents. Attack Category is based on the Attack Tags you select.
Enter custom Metadata as Field and Value to categorize the incidents. Metadata Field are letters or a combination of letters, numbers, or underscores (_), and must start with a letter. You cannot duplicate Metadata or use the fields and values more than once. You must use both Field and Value, one can't be blank.
To add new fields and values, click ADD NEW VALUE.
Select Log Sources from the drop-down or provide new log sources associated with the alert rule. New log sources are also updated in the drop-down after submission.
Click Finish. A new incident is generated and is added to the Incident list. To view the list, in the navigation bar, click on the Incidents icon.
Create Incident and Assign to Other Users
You must be part of the Incident User Group to assign an incident to other users.
Go to Search from the navigation bar.
Execute a query to create an incident.
Click Add Search To drop-down and select Incident.
Enter the Incident Name and the Description.
Select a Risk level for the incident.
Assign an incident owner from the Assigned to by selecting a name of a user who is a member of an Incident User Group. Only the assigned user can resolve the incident.
Select other users who can view, reassign, or comment on the incident in Manageable by.
Click Next.
Select the Attack Tag from the drop-down. You can select multiple tags to categorize the incidents. Attack Category is based on the Attack Tags you select.
Enter custom Metadata as Field and Value to categorize the incidents. Metadata Field are letters or a combination of letters, numbers, or underscores (_), and must start with a letter. You cannot duplicate Metadata or use the fields and values more than once. You must use both Field and Value, one can't be blank.
To add new fields and values, click ADD NEW VALUE.
Select Log Sources from the drop-down or provide new log sources associated with the alert rule. New log sources are also updated in the drop-down after submission.
Click Finish. A new incident is generated and is added to the Incident list. To view the list, in the navigation bar, click on the Incidents icon.
Create Incident from Alert Rule
Alert Rules or Detections check log events as they occur and generate an incident when the rule conditions match a defined activity. They can be based on any detector or Logpoint query and are typically used to check log events for signs of malicious activity or to monitor operational messages and thresholds. At the same time an alert is generated, an incident correlating to the alert is also created.
An alert is triggered, and an incident is generated whenever the search query meets all alerting criteria.
Create an Alert Rule
Either:
Go to Settings >> Knowledge Base from the navigation bar and click Alert Rules. Click Add.
Go to a Dashboard or Search Template widget, click the drop-down. Click Alert.
In Create New Alert, click Parameters.
Enter a Name and Description.
In Query, enter an alert query or use the following query. If you are creating an alert rule from a widget, the widget’s query is auto-filled in the alert rule.
Click Browse to select a query based on:
Search History: Recent search queries.
Saved searches: Queries you saved.
Vendor searches: Integration-specific searches that are part of a log source.
Search Labels: To select a search based on Labels.
Live Searches: Queries from other alerts.
If your query is long, click Expand. Click Collapse to return to the default view.
Click Repos to select which repos to run the query on.
In Query Time-range, select the period of time or when to run the query. For example, when the query time range is set to 3 days, Logpoint will search for logs from the last 3 days. You can set a time range in either minutes, hours, or days. The maximum time range limit is 30 days or its equivalent in hours and minutes.
In Results Limit, enter the maximum number of logs to retrieve. If you are using an aggregation query, you can't apply a result limit.
If Data Privacy is applied, Data Privacy Module: Alert Using Original data is automatically turned on, and data is encrypted. To decrypt query data, disable it.
With Data Privacy, the values for all the configured Data Privacy Module fields are encrypted. For queries that search for specific field values, an incident is not generated. However, for queries that search for all values, an incident is generated with encrypted fields. For example, if the device_name is encrypted under Data Privacy, the query device_name=localhost won't generate an incident. However, the query device_name=* will return incidents with encrypted values.
Select the Search Intervalin minutes. For example, if you set the search interval to two, Logpoint performs the search every two minutes. The search interval maximum is 1440 minutes. The search interval must be a factor of the Query Time-range. If it isn't, then the correct factor is used. For example, for a 2-day or 2880-minute time range, the maximum number of minutes is 1440, or 24 hours, so you can apply a search interval of once a day. Ensuring the search interval is a factor of the Time range improves performance.
You can't apply a search interval to a correlation query.
To ensure all relevant logs are collected before generating an incident, enter a Delay Alert in minutes. Delay Alert should be a multiple of the Search Interval. For example, if the search interval is 5 min, the delay alert should be 5, 10, or 15 minutes. The maximum value for the Delay Alert is 24 hours. You can apply a Delay Alert only to log_ts-based searches.
To ensure the next alert is triggered only by new log events, Enable Flush On Trigger.
To ensure that Logpoint does not create multiple alerts for the same log events during a specific time frame, in Alert Throttling, select the field and the period of time in minutes. When an alert is triggered based on that field, a new alert won't be triggered until the time you set has passed.
Click Criteria. Criteria specifies the exact conditions or thresholds that must be met for the alert to trigger an incident. This is typically based on log count metrics from the query in the Alert Rule. When an alert rule detects a potential threat, Logpoint uses the Alert Rule's criteria together with a device's Risk Values to determine the overall risk severity. For example, if the criteria is set to trigger an alert when the number of failed login attempts exceeds 100 in 5 minutes, an alert is only generated when that happens. Risk Calculation Function determines which severity level to select when comparing the risk level of the threat together with the risk level of the device.
In Condition, select a mathematical function and then the number of logs to apply it to.
In Risk, select how serious the risk level or severity of the detection or threat.
In Risk Calculation Function, select:
Maximum to mark the alert with the greater risk when comparing the threat with the device.
Minimum to mark the alert as having a lower risk when comparing the threat to the device.
Average to find the average between the threat and the device.
Go to or click Metadata.
In ATT&CK Techniques, select the MITRE tactics to categorize the alert. You can select more than one.
In Additional Meta-Data, enter key-value pairs to apply additional categories to the alert. You can't use reserved Jinja placeholders or leave a key or value in a key-value pair blank.
Use Log Source to link a log source to the Alert Rule.
Go to or click Ownership. Users who belong to Incident User Groups assign the Alert rule to a user, user group, or themselves. Assigned users can reassign, comment on, and view the generated incident data. They can also resolve the alert. If you do not belong to an incident user group, the alert will be assigned to you.
To assign the alert to:
An individual user, select them in the Assigned to drop-down.
A group, select the group in Manageable By.
Yourself, make sure nothing is selected or entered in Ownership. Everything should be blank.
To view the details of the incidents triggering the alert in a specific format, click Data Template.
Turn on Apply Jinja Template.
Enter Jinja Syntax code in the text field.
Alert Rules can be exported and imported. If you export an Alert Rule, the ownership is lost. If you import an Alert Rule, you get the ownership.
Click Create Alert.
Adding Notification for Incident
Click the bell-shaped Setup Notification icon in the Actions column of Incident.
Select the type of notification to configure and fill in its required parameters.
Click Save.
Creating Incident from Dashboard Widgets
Go to the dashboard or search template containing the required widget.
Click the drop-down icon at the top-right corner of the widget.
Click Incident and enter the data.
Click Submit.
Close, Reopen & Resolve Incidents
Resolve the incident when its investigation concludes. Close an incident when you decide that the incident doesn't require investigation. When you close an incident, you can reopen it. Incidents cannot be closed without being resolved first.
You can only reopen incidents one-by-one.
Resolving Incidents
In the navigation bar, click Incidents Cases and select Incidents.
Find the incident or incidents in the list to investigate or look into. Select it by clicking the small checkbox on the left.
Click More.
To resolve:
A single incident, select Resolve Selected.
Multiple incidents, select Resolve Selected.
All resolved incidents, click Resolve All.
Click Yes to confirm.
Closing Incidents
In the navigation bar, click Incidents Cases and select Incidents.
Find the incident or incidents in the list to investigate or look into. Select it by clicking the small checkbox on the left.
Click More.
To close:
A single incident, select Resolve Selected.
Multiple incidents, select Resolve Selected.
All resolved incidents, click Resolve All.
Click Yes to confirm.
Was this helpful?