System Dashboards
System Dashboards
Users with the Admin user role can monitor Logpoint based incidents and cases in addition to system health. This helps Admin users identify unusual patterns or activities, understand if Logpoint is running as it should in addition to detecting potential threats, malware, or malicious events early so you can take corrective actions.
 Security Operations
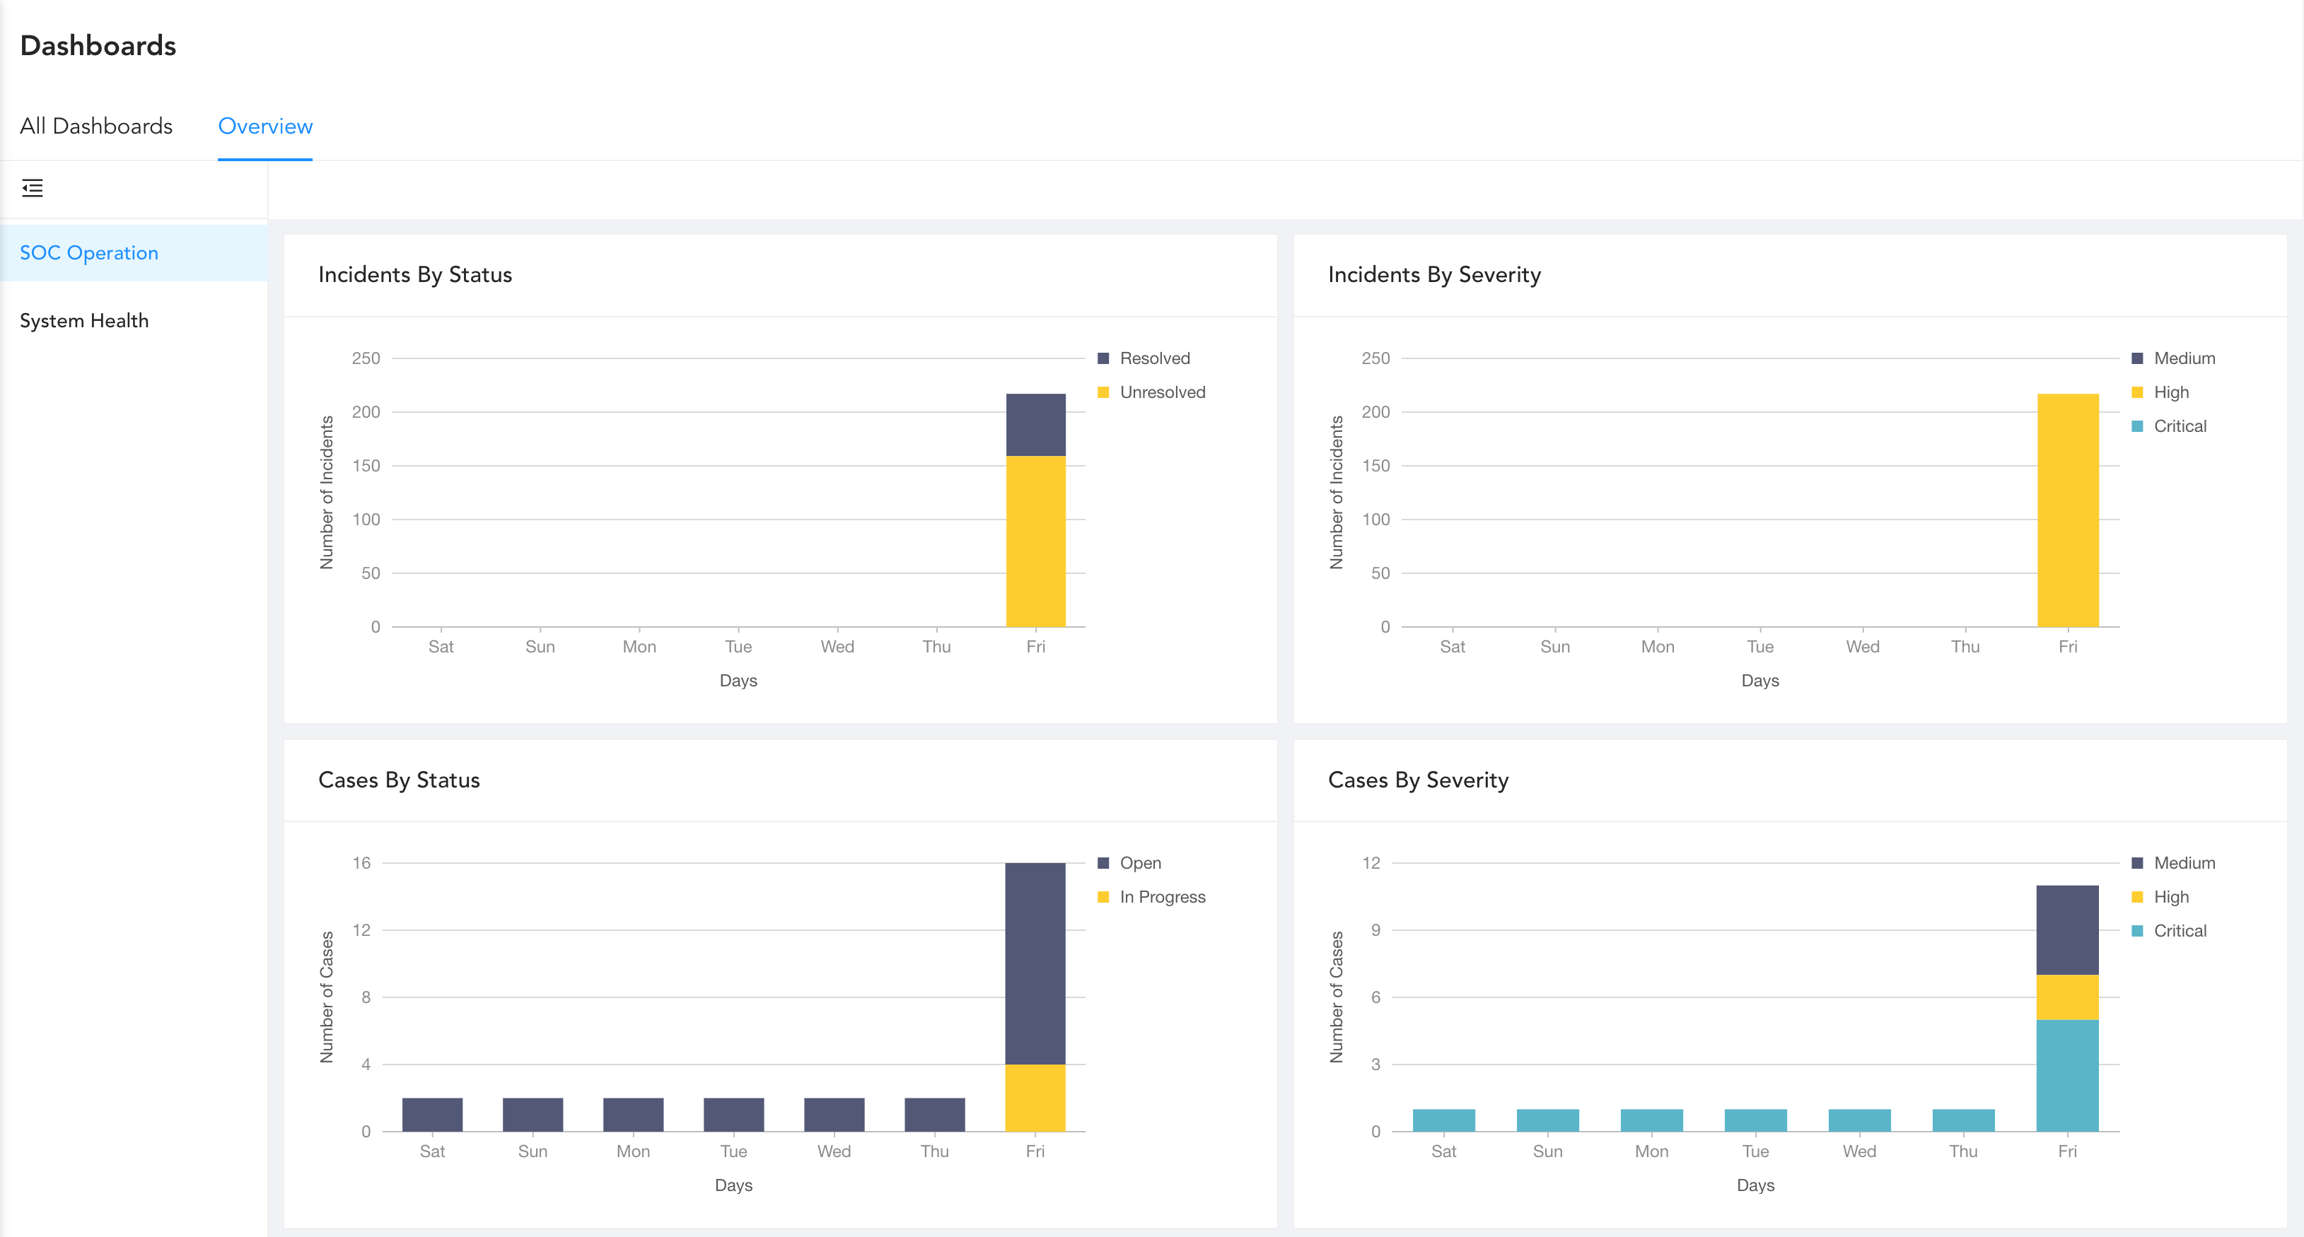
Navigate to the Security Operations dashboard
In the navigation bar, click Dashboards.
Under Dashboards, click Overview.
The incident status/severity, cases status/severity and case response event data is from daily activity during a specified period. You can use this dashboard to check whether security operations including detections, analyses, and responses are running as expected.
Widget
Description
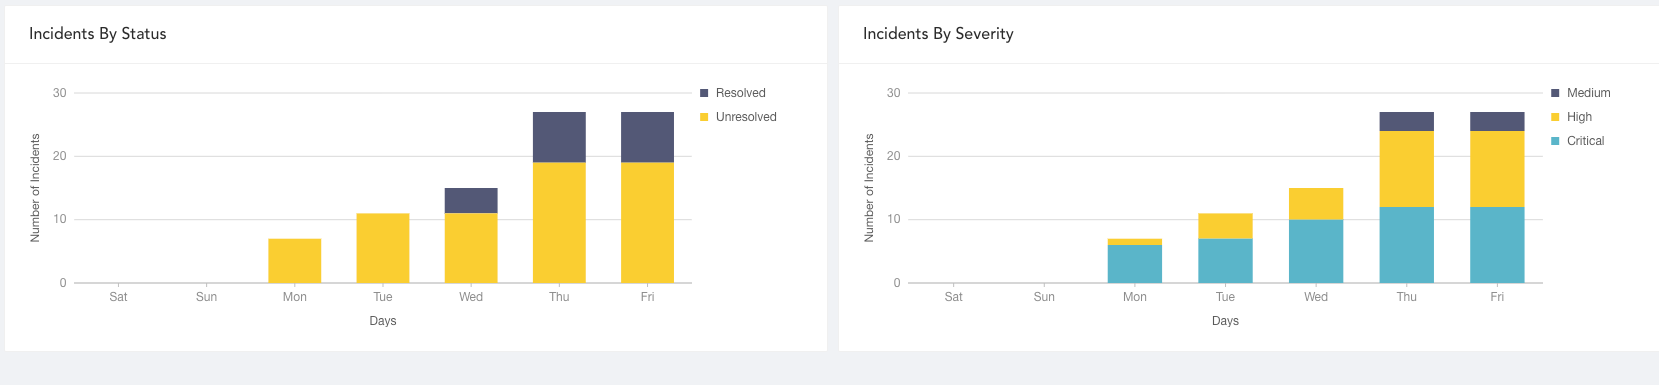
Incidents By Status
Unresolved and resolved incident data collected each day over a specified period. Use the widget to check the number of incidents with a changed status.
Incidents By Severity
Total number of open critical, high and medium severity incidents during a specified period. Use this widget to view risk trends.
Cases By Severity
Total number of open critical, high and medium severity cases during a specified period. Use this widget to view which cases to prioritize.
Cases By Status
Open and in progress cases for each day in a specified period. Use to view the number of cases whose status changed and evaluate current risk level.
Automated Response vs Manual Response
Number of SOAR cases closed by automation or playbooks compared with those manually closed by a user. Use to track the efficiency of automation.
System Health
Open the System Health dashboard
In the navigation bar, click Dashboards.
Under Dashboards, click Overview.
Click System Health.
Widget Name
Description
Disk Usage
The total number of gigabytes used to to run programs and carry out tasks during a specified period. Disk usage relates to hard disk performance.
Memory Usage
RAM capacity in use while running processes or tasks during a specified period. This helps admin users understand system capacity and make sure there is enough memory.
CPU Usage
Total percentage of processing power in use so an admin user can check system performance, health and speed.
Messages Per Second
Helps admin users identify peak message rates and assess capacity.
Was this helpful?