System Monitor
You can track what programs are running, how resources are used, and Logpoint status information. In addition, you can also test services meant to be running and automatically generate alerts for problems so you can address them quickly.
You can also set up a Logpoint-based notification for when Disk Usage reaches a specific level.
Dashboards
There are two dashboards to monitor system health and operations:
System Health
SOC Operational
System Health
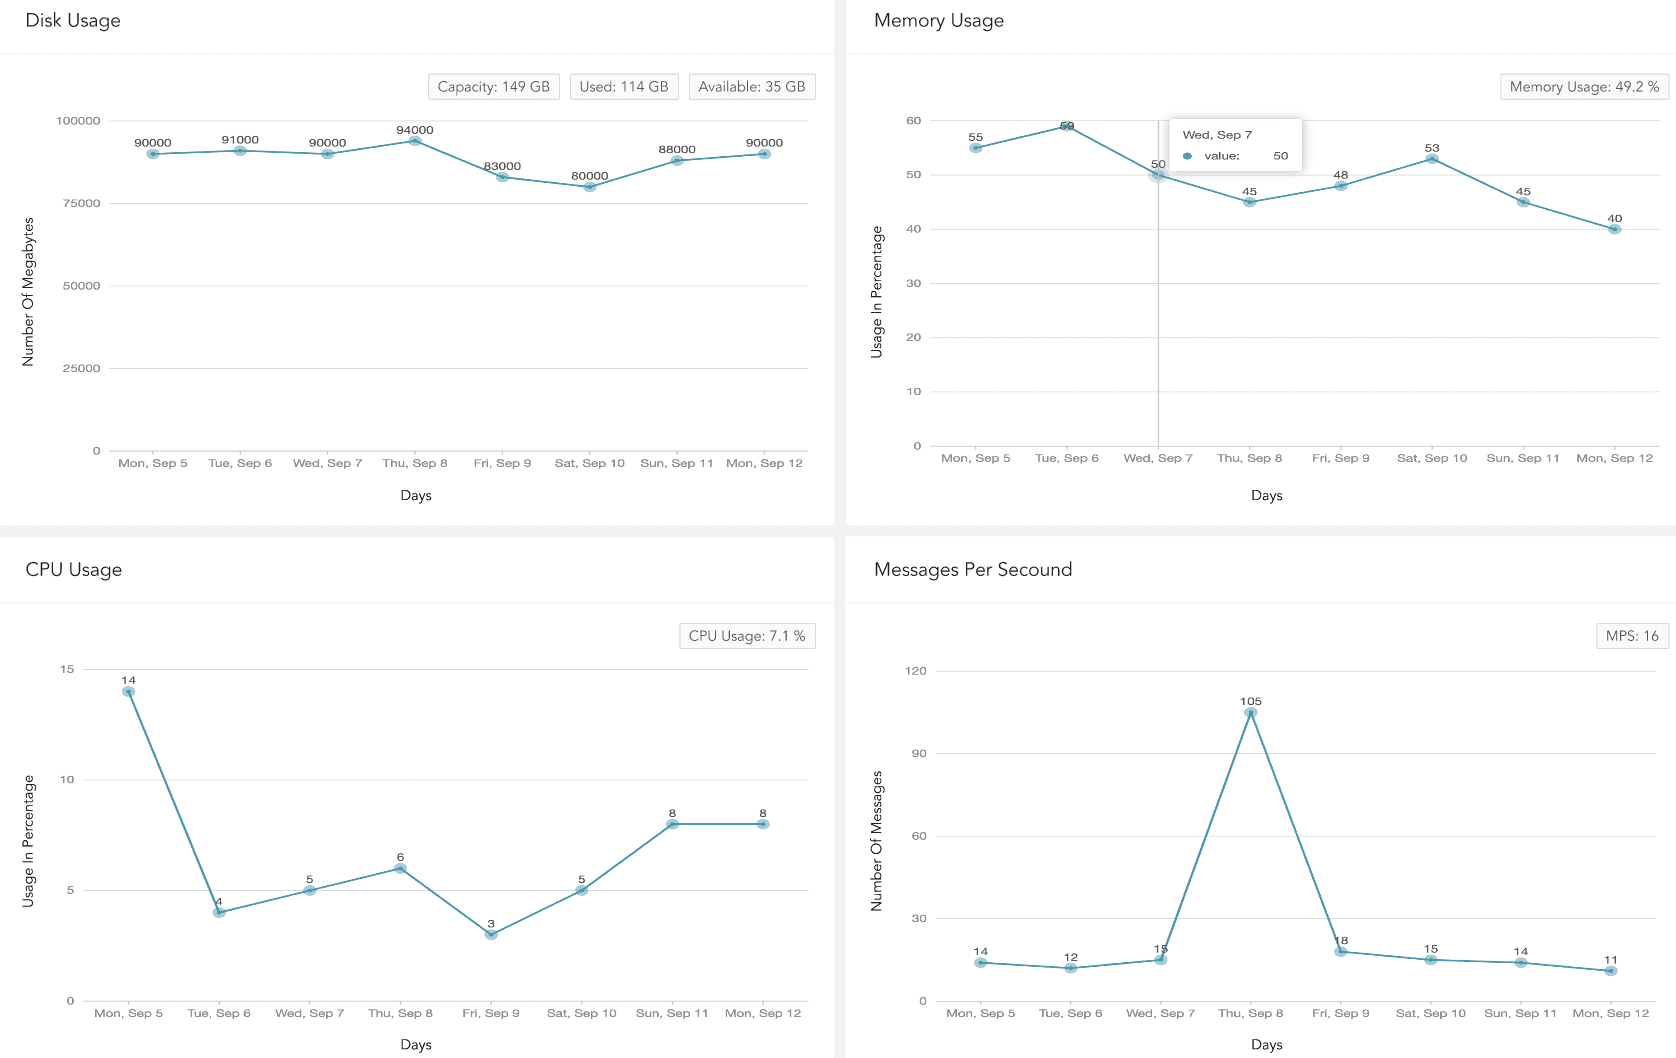
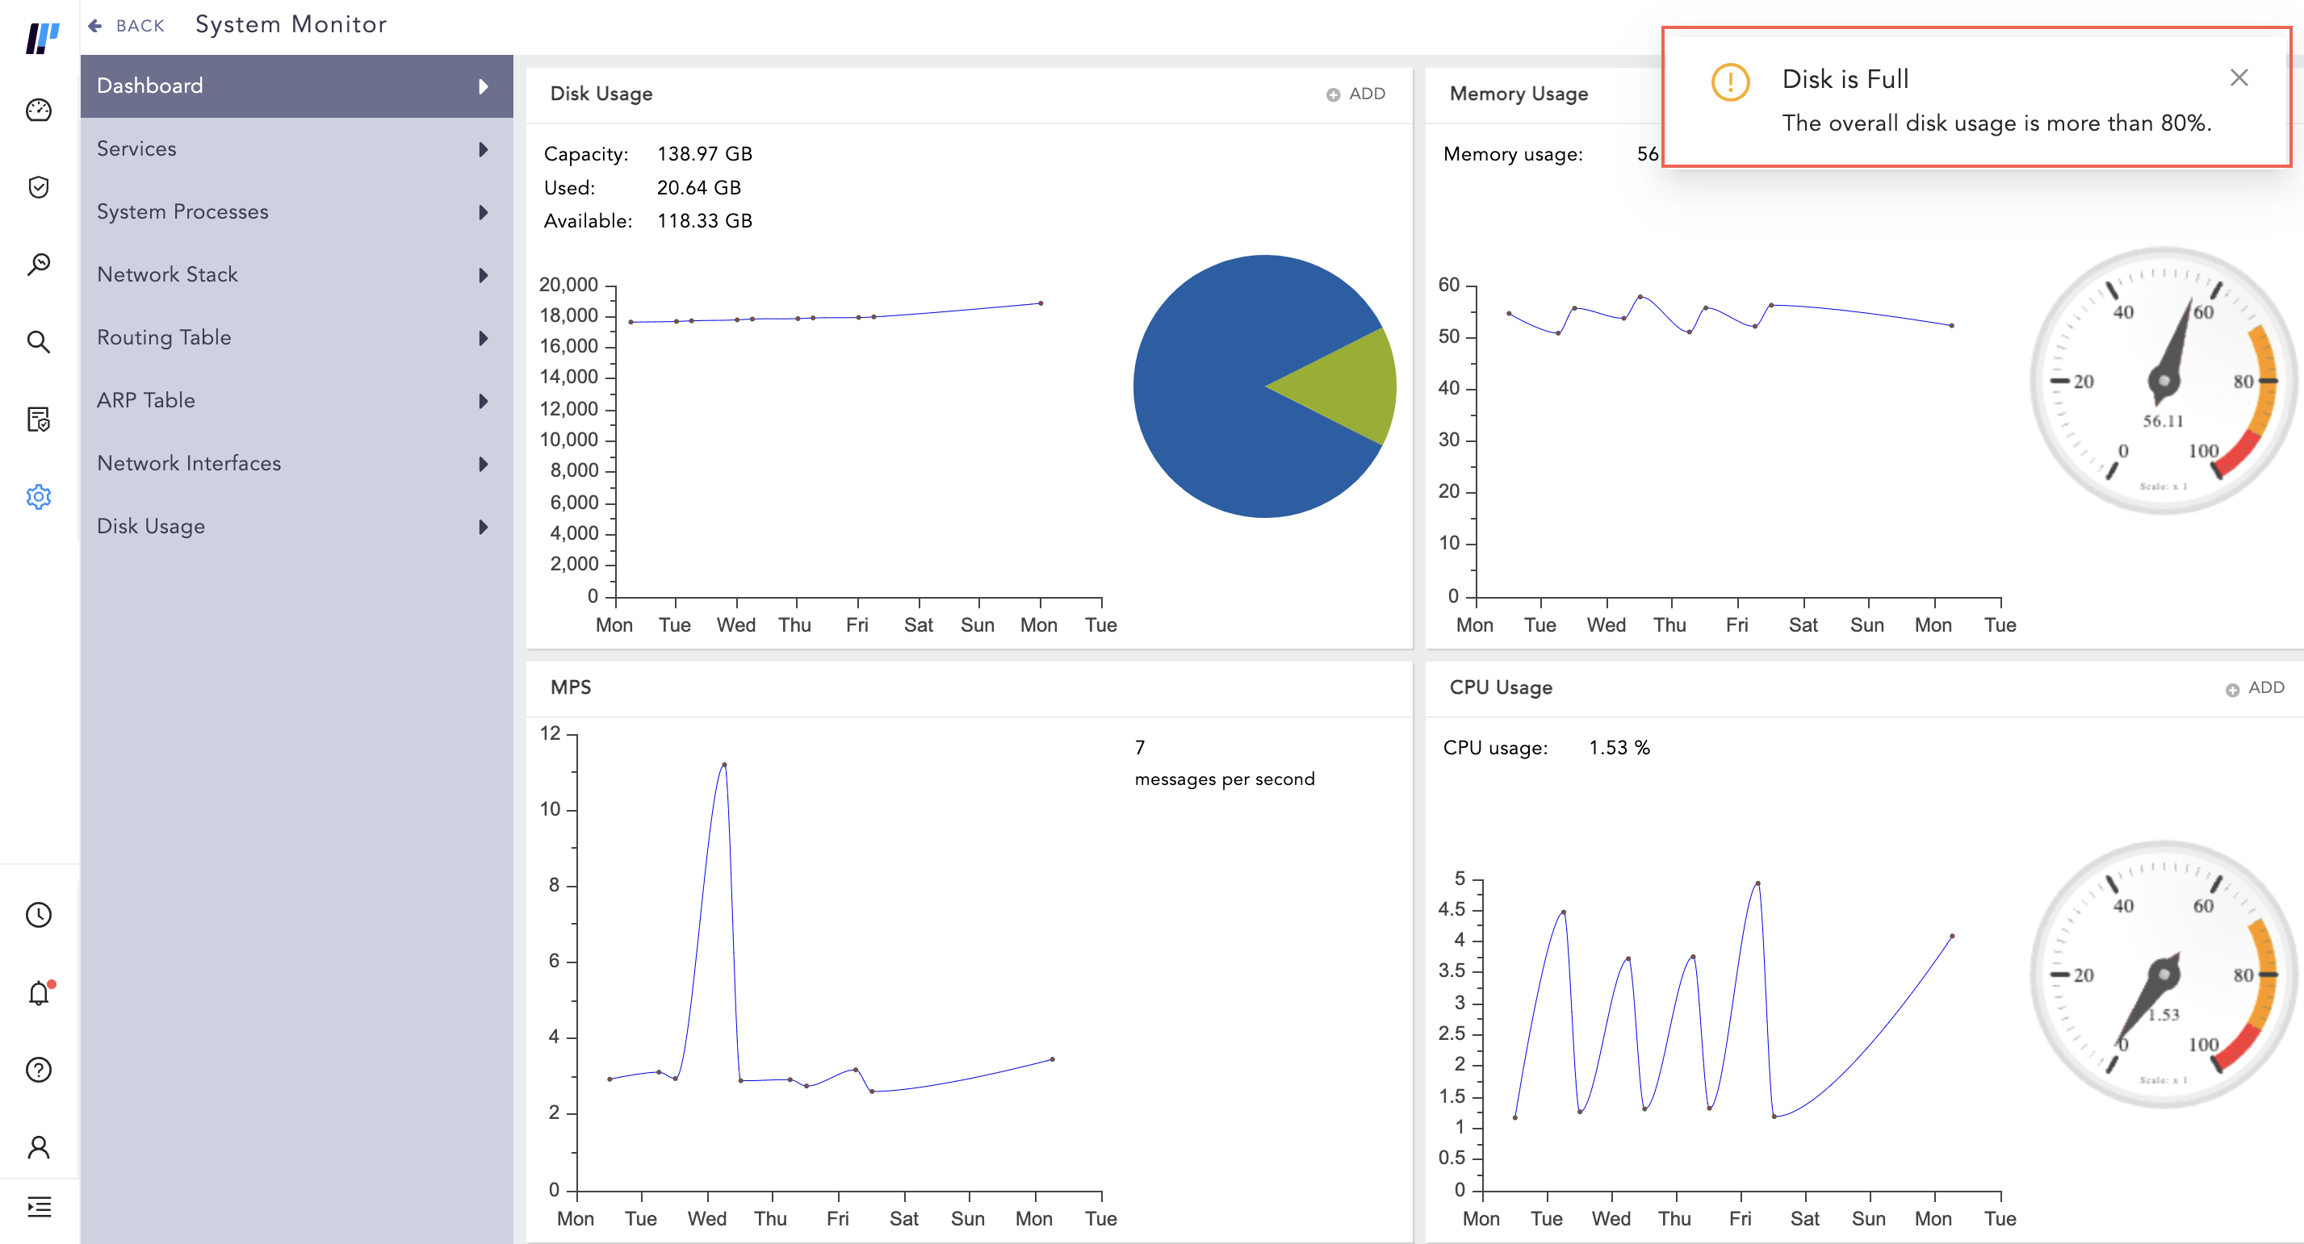
System Health dashboard is a high level system health overview. It monitors disk usage, memory usage, CPU usage, and messages per second events. These system events can help you identify unusual patterns or activities, understand whether the system is running efficiently, and detect potential threats, malware, or malicious events early so you can take corrective actions.
The dashboard’s widgets are:
Disk Usage
The total number of gigabytes Logpoint is using to run programs and carry out tasks daily in the specified period. Disk usage relates to hard disk performance.
Memory Usage
The trend of memory (RAM) capacity Logpoint uses while running processes or tasks in the specified period. This helps admin users understand system capacity and make sure there is enough memory.
CPU Usage
The total percentage of processing power in use so an admin user can check system performance, health and speed.
Messages Per Second
Logpoint’s scalability and capacity to handle a large volume of messages within a second. It can help admin users identify peak message rates and assess capacity.
SOC Operation
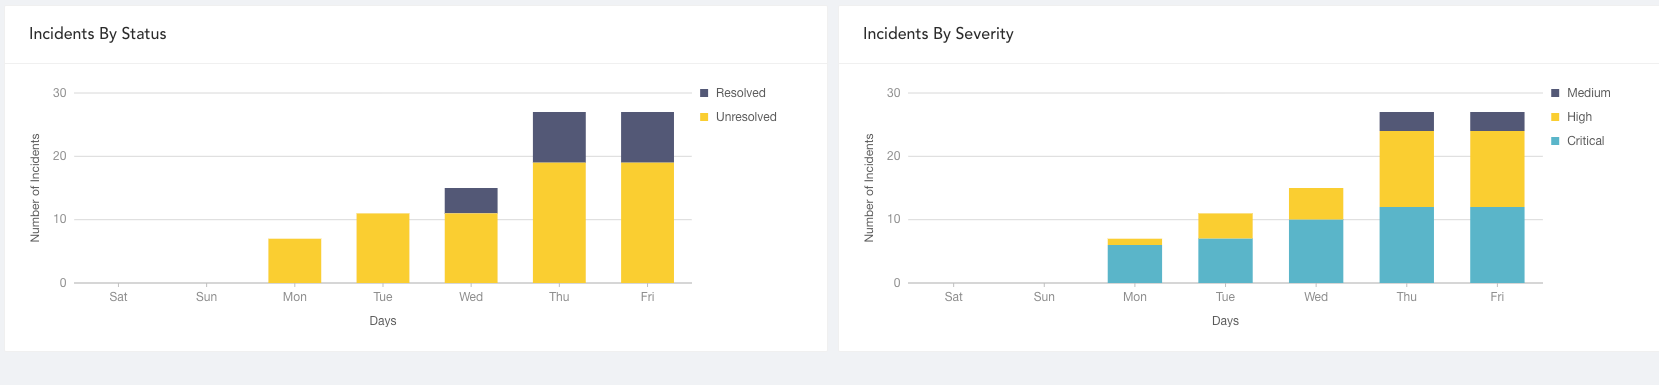
The SOC Operation dashboard is an overview of real-time cybersecurity incidents based on key measures, workflows, and behavioral patterns. The incident status/severity, cases status/severity and case response event data Logpoint provides is from daily activity during a specified period. Use this dashboard to check SOC effectiveness and ensure all security operations including detections, analyses, and responses are running effectively.
The dashboard’s widgets are:
Incidents By Status
Unresolved and resolved incident trend’s accumulated data collected each day over a specified period so SOC managers can use to find the number of changed incident states.
Incidents By Severity
The total number of accumulated incidents with severity (critical, high and medium) not closed daily in a specified period so a SOC manager can view risk trends associated with incidents and adjust the incident threshold.
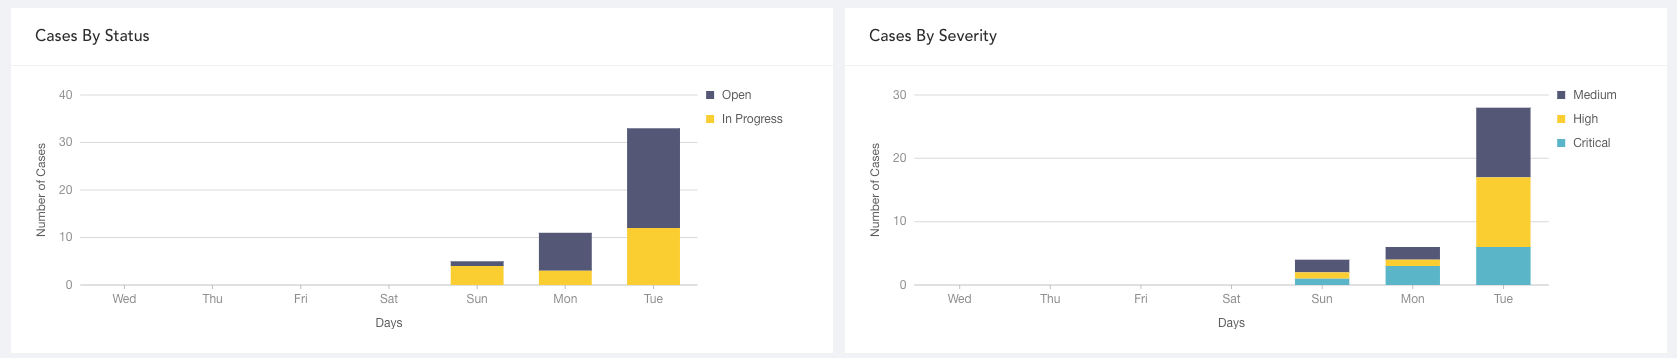
Cases By Severity
The total number of accumulated cases with severity (critical, high and medium) not closed daily in a specified period so SOC managers can see how case severity has changed and help them prioritize case work.
Cases By Status
The accumulated data on open and in progress cases trends for each day in a specified period. SOC managers can view the proportion of cases whose status changed and evaluate the current risk level.
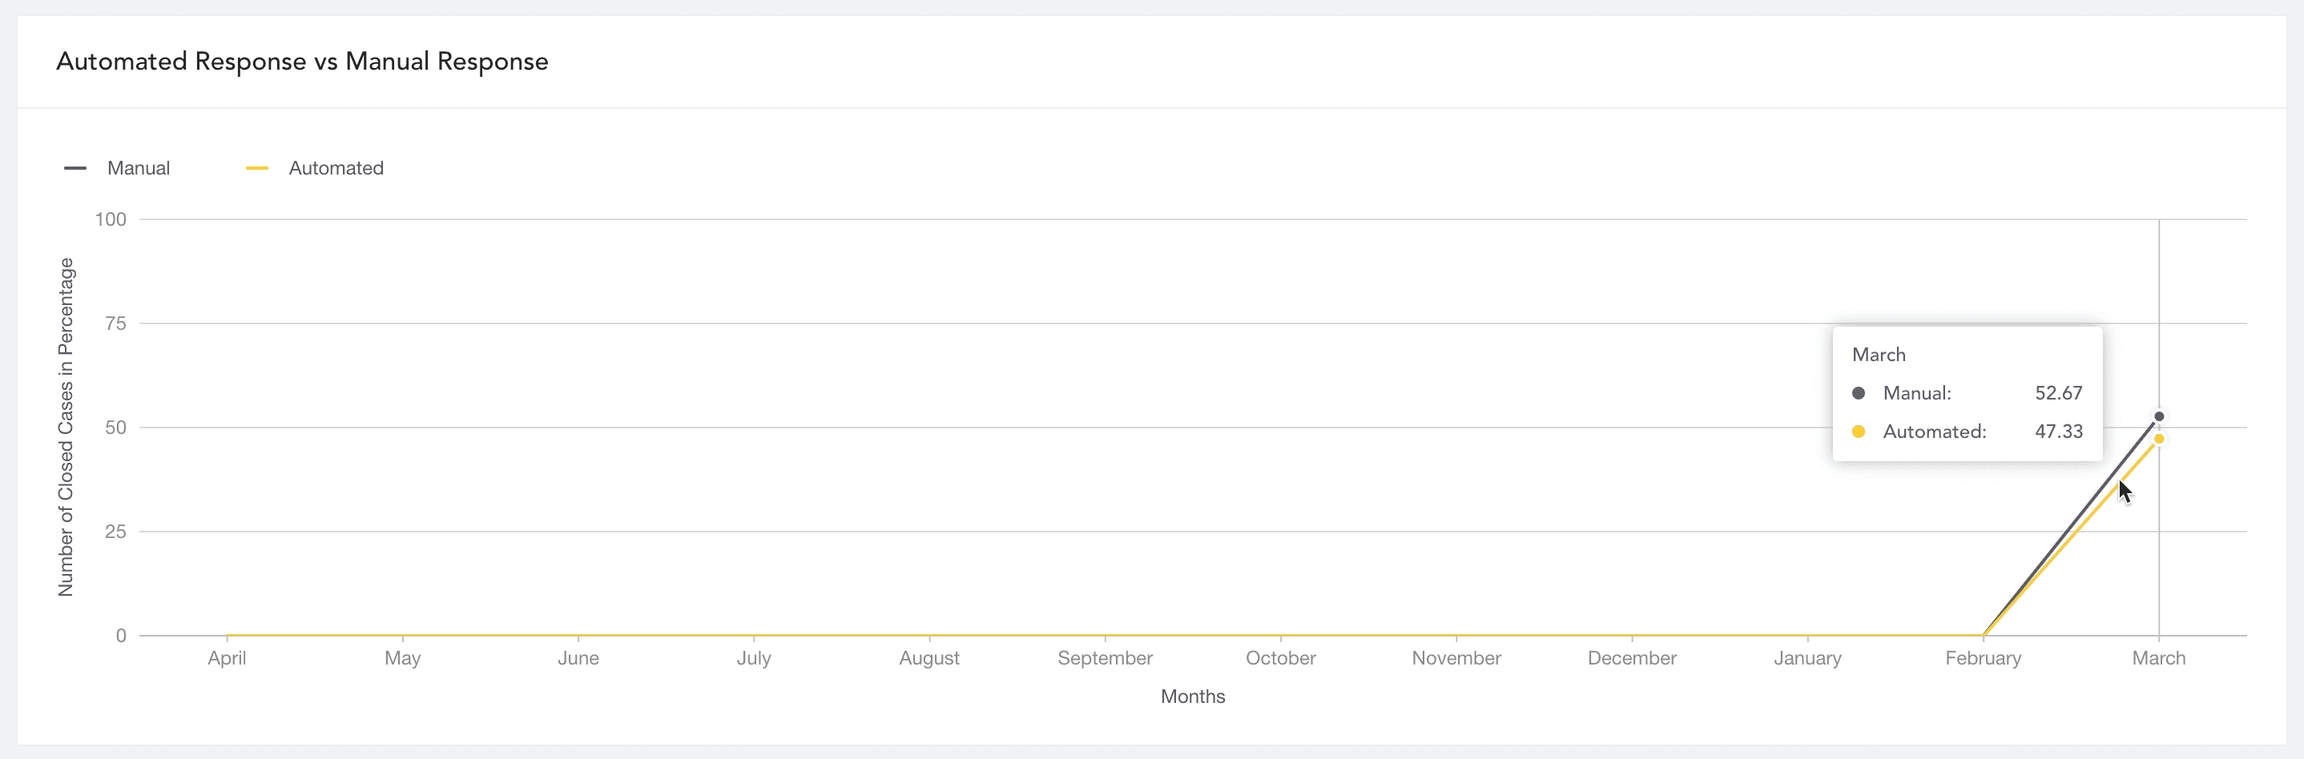
Automated Response vs Manual Response
The accumulated data of cases closed by playbooks (automated response) and cases closed by SOC analysts (manual response) monthly in the specified period to assess the case resolution reliability of the playbook so SOC managers can track the efficiency of automation.
Disk Usage
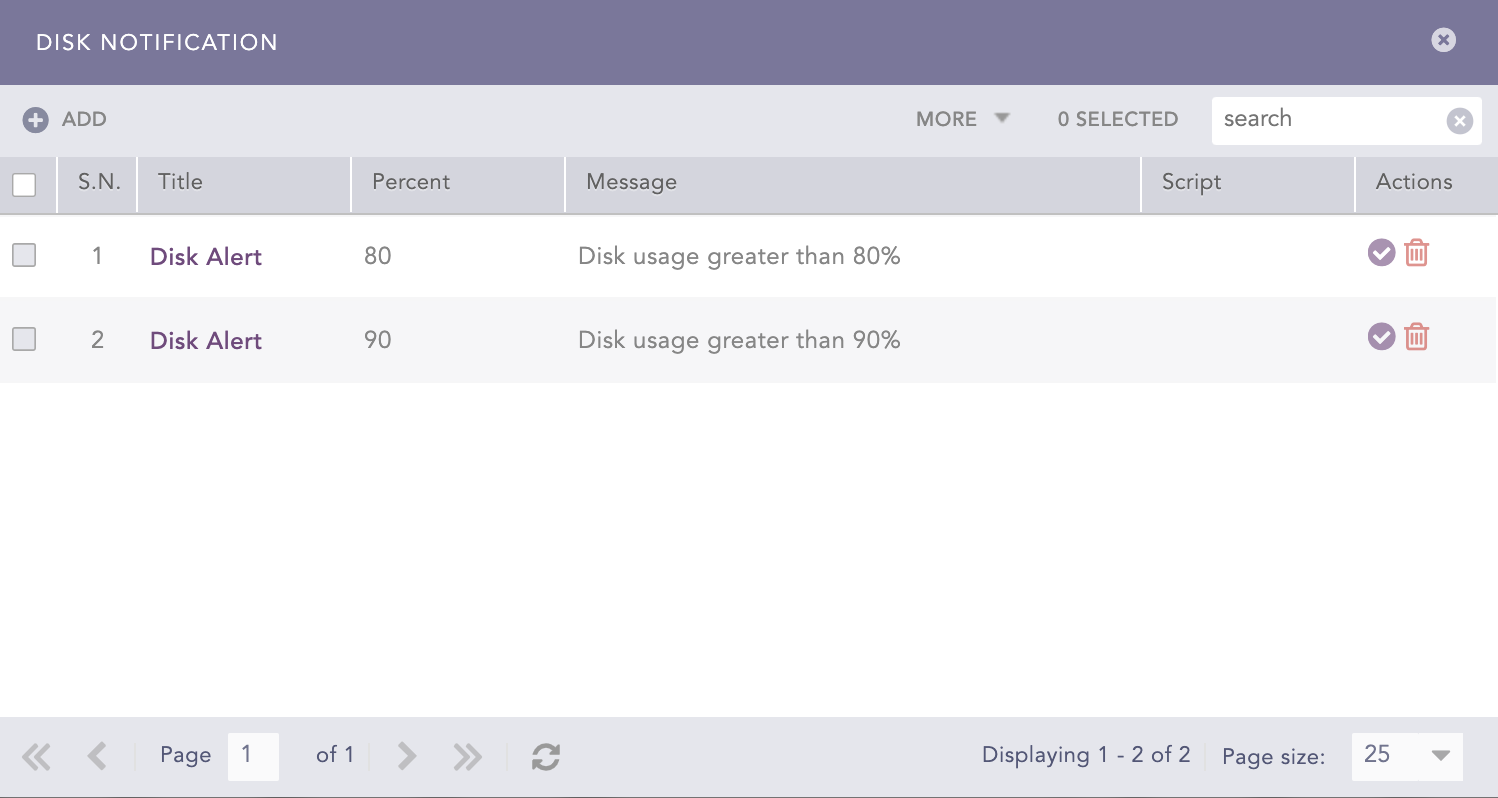
It displays the total file system disk usage. It lists available disk space, disk usage and location of the file system. By default, Logpoint generates disk notifications when disk usage reaches 80% and again when the disk usage reaches 90%.
When available disk space falls to less than 2 GB, Logpoint stops collecting or fetching any logs and resumes only when there is at least 4 GB of available space. When the available space for a partition containing a repo path is less than 250 MB, Logpoint stops storing log messages in that partition and generates an audit log specifying that there is insufficient disk space available to store logs. Logpoint resumes data storage when enough space is available.
Automatic Notification
Two notifications are set up and activated in Logpoint out-of-the-box. By default, you are notified when the total disk usage reaches 80% and 90%. The percentage of used disk space is displayed at the top-right. You can change the default 80% and 90% thresholds.
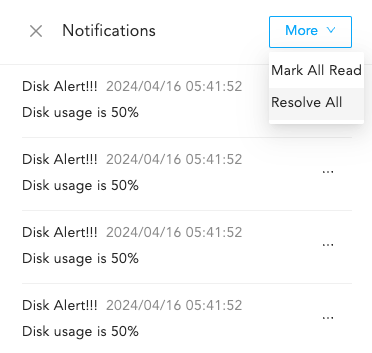
After disk usage is resolved, you need to manually resolve the disk notification. The notifications are still sent even after disk usage is reduced.
System Notifications
System Notification notifies you of Disk, CPU, and Memory usage of Logpoint. When there is a new notification, the navigation bar displays an alert. Click the Notification icon to open the Notification Center.
CPU Usage Notification
There are no CPU usage notifications set up and activated in Logpoint out-of-the-box, so you will need to set up your own.
Adding CPU Usage Notification
Go to Settings >> System Settings and click System Monitor.
Select Dashboard.
In CPU Usage, click Add.
Enter the Percent of total CPU usage that triggers a notification.
Enter the Title and Message for the notification.
(To initiate a command at the same time the notification is sent, specify a system Command. The command should be an executable bash command. Providing a Command is optional. Example command that checks for any files greater than 50MB and lists them in the terminal:
Enter the address of the remote Server and the Port number.
Select the Authentication type for the remote Server:
Password: enter a Password.
SSH Certificate: an SSH Certificate is automatically generated. The password or the SSH certificate key are required for user validation while accessing the remote server.
Click Submit.
Disk Usage Notification
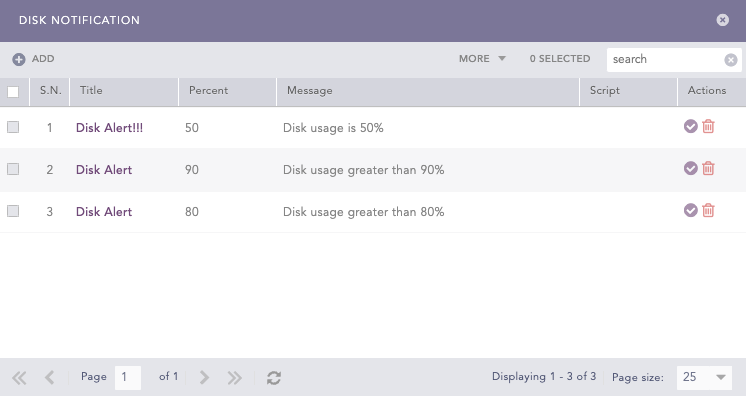
Two notifications are set up and activated in Logpoint out-of-the-box for disk usage (80% and 90%). The percentage of used disk space is displayed at the top-right. These values can be configured to trigger the notification at any threshold.
The disk usage notification is displayed even after the current disk usage no longer exceeds the configured threshold. To stop seeing or turn off the notification, see Delete Disk Usage Notification.
Configure Custom Disk Usage Notification
Go to Settings >> System Settings and click System Monitor.
Select Dashboard.
In Disk Usage, click Add.
Enter the Percent of total disk space used that triggers a notification.
Enter the Title and Message for the notification.
To initiate a command at the same time the notification is sent, specify a system Command. The command should be an executable bash command. Optional. Example Bash commands that check free disk space at /dev/sda and clean cached packages:
Enter the address of the remote Server and the Port number.
Select the Authentication type of the remote Server:
Enter a Password, or
Generate an SSH Certificate. The password or the SSH certificate key are required for user validation while accessing the remote server.
Click Submit.
When the notification is triggered, it is displayed in the Notification Center.
Delete Disk Usage Notification
Go to Settings >> System Settings and click System Monitor.
Select Dashboard.
In Disk Usage, click Add.
Click the Delete icon in Actions.
Click Yes.
Click Notifications in the navigation bar.
Click the More dropdown and click Resolve All.
Memory Usage Notification
There are no Memory usage notifications set up and activated in Logpoint out-of-the-box; you will need to set them up yourself.
Adding Memory Usage Notification
Go to Settings >> System Settings and click System Monitor.
Select Dashboard.
In Memory Usage, click Add.
Enter the Percent of memory usage that triggers a notification.
Enter the Title and Message for the notification.
If you want to initiate a command at the same time the notification is sent, specify a system Command. The command should be an executable bash command. It is optional. Example command that clears PageCaches in RAM:
Enter the address of the remote Server and the Port number.
Select the Authentication type for the remote Server:
Password: enter a Password.
SSH Certificate: an SSH Certificate is automatically generated.
The password or the SSH certificate key are required for user validation while accessing the remote server. Make sure you can remember them.
Click Submit.
Deleting Disk Usage Notification
Go to Settings >> System Settings >> System Monitor >> Dashboard.
In Disk Usage, click Add.
Click the Delete icon in Actions.
Click Yes to confirm deletion.
Click Notifications in the navigation bar.
Click the More dropdown and click Resolve All.

Services
A Service is designed to perform a specific function and works with other services to provide a fully functional Logpoint. If any service performs poorly, it can impact other dependent services, leading to issues in Logpoint’s functionalities. For that reason, it is essential for services to always function. Services lists all running services and their status. You can stop, start, or restart them if required.
Starting Services
Click the Start Service icon in Actions.
To start all the services, click START ALL.
Restarting Services
Click the Restart Service icon in Actions.
To stop all the services, click RESTART ALL.
System Processes
It shows all the processes currently running on the operating system where Logpoint is installed. The process list shows users, memory used by processes, commands on run, and process ids.
You can reload the page by clicking Reload.
Network Stack
The Network Stacks are used in communication networks.
Routing Table
Displays the routes to particular network destinations.
Address Resolution Protocol (ARP) Table
A protocol for mapping an Internet Protocol address (IP address) to a physical machine address that is recognized in the local network. This item lists all the connection statuses under this protocol.
Network Interface
Displays Logpoint's network status. It shows the state of all active interfaces, such as eth0, lo, he-ipv6, tun0, tun1, and tun10000.
SNMP Monitoring
SNMP
SNMP (Simple Network Management Protocol) is a standard protocol used to monitor and manage devices on a network, such as servers, routers, switches, firewalls, printers, and UPS systems. It allows monitoring tools to collect metrics and receive alerts from networked devices using standardized OIDs (Object Identifiers) defined in MIBs (Management Information Bases). An OID (Object Identifier) is a unique numeric identifier used in SNMP to represent specific information exposed by a device, such as CPU usage, memory usage, or disk utilization.
SNMP allows you to monitor various Logpoint metrics. If you enable SNMP, Logpoint listens for OIDs on port 161.
Enabling SNMP
Go to Settings >> System Settings and click System Settings.
Select SNMP.
Select Enable.
Enter a Community String. The SNMP community string in Logpoint is a read-only community string that authenticates Logpoint. Use this community string in your SNMP clients to query Logpoint and retrieve information.
Click Save.
In addition to the Logpoint UI, you can also monitor the status of Logpoint using SNMP walk. Use the base OID 1.3.6.1.4.1.54322.1 with the provided community string to get a list of all the exposed OIDs and their corresponding details. You can also use enterprises.54322.1 as the base OID. An MIB file with the OIDs is on the Help Center. Monitoring tools interpret OIDs using MIB files, and some OIDs must end with .0 to ensure proper data retrieval. Logpoint provides two OIDs to maintain consistency: one with .0 and one without. For example, 1.3.6.1.4.1.54322.1.1 and 1.3.6.1.4.1.54322.1.1.0 represents the normalizer’s last recorded messages per second.
Monitor Logpoint using SNMP Walk
Go to Settings >> System Settings and click System Settings.
Select SNMP and enable SNMPD Port.
Enter a Community String. Copy the passphrase to use it in the SNMPwalk command.
Run the following SNMPwalk command:
Logpoint exposes the following OIDs:
1
1.3.6.1.4.1.54322.1.1
Last recorded messages per second in the normalizer
2
1.3.6.1.4.1.54322.1.2
Average messages per second in the last 5 minutes in the normalizer
3
1.3.6.1.4.1.54322.1.3
Last recorded messages per second in the store handler
4
1.3.6.1.4.1.54322.1.4
Average messages per second in the last 5 minutes in the store handler
5
1.3.6.1.4.1.54322.1.5
Services that are currently down
6
1.3.6.1.4.1.54322.1.6
Logpoint version
7
1.3.6.1.4.1.54322.1.7
Status of the log collection services
8
1.3.6.1.4.1.54322.1.7.1
CPU consumption in collection (in %)
9
1.3.6.1.4.1.54322.1.7.2
Memory consumption in collection (in %)
10
1.3.6.1.4.1.54322.1.7.3
Queue in collection (in MB)
11
1.3.6.1.4.1.54322.1.8
Status of the normalization services
12
1.3.6.1.4.1.54322.1.8.1
CPU consumption in normalization (in %)
13
1.3.6.1.4.1.54322.1.8.2
Memory consumption in normalization (in %)
14
1.3.6.1.4.1.54322.1.8.3
Queue in normalization (in MB)
15
1.3.6.1.4.1.54322.1.9
Status of enrichment services
16
1.3.6.1.4.1.54322.1.9.1
CPU consumption in enrichment (in %)
17
1.3.6.1.4.1.54322.1.9.2
Memory consumption in enrichment (in %)
18
1.3.6.1.4.1.54322.1.9.3
Queue in enrichment (in MB)
19
1.3.6.1.4.1.54322.1.10
Status of indexing services
20
1.3.6.1.4.1.54322.1.10.1
CPU consumption in indexing (in %)
21
1.3.6.1.4.1.54322.1.10.2
Memory consumption in indexing (in %)
22
1.3.6.1.4.1.54322.1.10.3
Queue in indexing (in MB)
23
1.3.6.1.4.1.54322.1.11
Status of the dashboard and alerting service
24
1.3.6.1.4.1.54322.1.11.1
CPU consumption for dashboards and alerts (in %)
25
1.3.6.1.4.1.54322.1.11.2
Memory consumption for dashboards and alerts (in %)
26
1.3.6.1.4.1.54322.1.11.4
Disk usage by dashboards and alerts
27
1.3.6.1.4.1.54322.1.11.5
Number of active search processes (live searches)
28
1.3.6.1.4.1.54322.1.12
ZFS pool statistics
29
1.3.6.1.4.1.54322.1.12.1
Names of the ZFS pools
30
1.3.6.1.4.1.54322.1.12.2
Status of the ZFS pools
31
1.3.6.1.4.1.54322.1.12.3
Disk allocation for the ZFS pools
32
1.3.6.1.4.1.54322.1.12.4
Free disk space in the ZFS pools
33
1.3.6.1.4.1.54322.1.12.5
Read operations in the ZFS pools
34
1.3.6.1.4.1.54322.1.12.6
Write operations in the ZFS pools
35
1.3.6.1.4.1.54322.1.12.7
Read bandwidth in the ZFS pools
36
1.3.6.1.4.1.54322.1.12.8
Write bandwidth in the ZFS pools
37
1.3.6.1.4.1.54322.1.12.9
Failed disks in the pools (if any)
38
1.3.6.1.4.1.54322.1.13
Statistics for the log size in repos
39
1.3.6.1.4.1.54322.1.13.1
Names of the repos
40
1.3.6.1.4.1.54322.1.13.2
Log size of repos in the previous day
41
1.3.6.1.4.1.54322.1.13.3
Log size of repos in the previous month
42
1.3.6.1.4.1.54322.1.14
Status of LUNs in systems with multipath devices
43
1.3.6.1.4.1.54322.1.14.1
Name of the multipath
44
1.3.6.1.4.1.54322.1.14.2
UUID of the multipath
45
1.3.6.1.4.1.54322.1.14.3
SysFS device-mapper's blocked device name of the multipath
46
1.3.6.1.4.1.54322.1.14.4
Device vendor/product/revision information
47
1.3.6.1.4.1.54322.1.14.5
Total number of detected paths of the multipath
48
1.3.6.1.4.1.54322.1.14.6
Total active paths of the multipath
49
1.3.6.1.4.1.54322.1.14.7
Product information
50
1.3.6.1.4.1.54322.1.14.8
Status of the multipath
51
1.3.6.1.4.1.54322.1.14.9
Size of the multipath
52
1.3.6.1.4.1.54322.1.14.10
Automatic failback configuration of the multipath
53
1.3.6.1.4.1.54322.1.30
Status of the Logpoint Collector buffer
54
1.3.6.1.4.1.54322.1.30.1
The logs in the buffer not received by the main Logpoint
55
1.3.6.1.4.1.54322.1.30.2
The time (in seconds) since the last message was received by the main Logpoint.
The OIDs for ZFS pool statistics, statistics for the log size in repos, and LUN status provide information for all these entities. To retrieve the information for a single one, add an extra number corresponding to the respective pool, repo, or LUN after the provided OID.
For example, use enterprises.54322.1.12.1 to retrieve the names of all the ZFS pools and enterprises.54322.1.12.1.1 to retrieve the name of the first ZFS pool.
Additionally, the following default OIDs are useful for a Linux-based system.
General Statistics
1
1.3.6.1.4.1.2021.11
CPU and swap information
2
1.3.6.1.2.1.2.2.1
Network interfaces information
3
1.3.6.1.4.1.2021.9.1.2
Lists all mount paths available on the system along with their corresponding index values. Each index uniquely identifies a filesystem entry in the disk table (dskTable) and can be used with other OIDs listed in disk statistics table to retrieve detailed metrics such as total size, used space, and available space for a specific mount path.
4
1.3.6.1.2.1.25.1.1.0
Uptime information
CPU Load
1
1.3.6.1.4.1.2021.10.1.3.1
CPU load over the last minute
2
1.3.6.1.4.1.2021.10.1.3.2
CPU load over the last 5 minutes
3
1.3.6.1.4.1.2021.10.1.3.3
CPU load over the last 15 minutes
4
1.3.6.1.4.1.2021.11.9.0
Percentage of CPU time consumed by user
5
1.3.6.1.4.1.2021.11.50.0
Raw CPU time consumed by user
6
1.3.6.1.4.1.2021.11.10.0
Percentage of CPU time used by system
7
1.3.6.1.4.1.2021.11.52.0
Raw CPU time used by system
8
1.3.6.1.4.1.2021.11.11.0
Percentage of idle CPU time
9
1.3.6.1.4.1.2021.11.53.0
Raw idle CPU time
10
1.3.6.1.4.1.2021.11.51.0
Raw nice CPU time
Memory Statistics
1
1.3.6.1.4.1.2021.4.3.0
Total swap size
2
1.3.6.1.4.1.2021.4.4.0
Available swap space
3
1.3.6.1.4.1.2021.4.5.0
Total RAM in the machine
4
1.3.6.1.4.1.2021.4.6.0
Total RAM used
5
1.3.6.1.4.1.2021.4.11.0
Total free RAM
6
1.3.6.1.4.1.2021.4.13.0
Total shared RAM
7
1.3.6.1.4.1.2021.4.14.0
Total RAM buffered
8
1.3.6.1.4.1.2021.4.15.0
Total cached memory
Disk Statistics
To query disk statistics for a specific mount path, replace X in the OID with the index corresponding to the required mount path. The index for each mount path can be obtained using the dskPath from general statistics.
SN
OID
Example Value (from snmpwalk)
Details
1
1.3.6.1.4.1.2021.9.1.6.X
48385792
Total size of the disk or partition (in KB)
2
1.3.6.1.4.1.2021.9.1.7.X
39633280
Available space on the disk
3
1.3.6.1.4.1.2021.9.1.8.X
8752512
Used space on the disk
4
1.3.6.1.4.1.2021.9.1.9.X
18
Percentage of used space on the disk
5
1.3.6.1.4.1.2021.9.1.10.X
0
Percentage of inodes used on the disk
6
1.3.6.1.2.1.1.3.0
-
System uptime
Last updated
Was this helpful?