Search Results
Enter your search in the search bar. Use a Search Template, a Search Template from a Search Package, or create your own query.
After search, use the results to:
Drill down and understand the details.
View the top fields or values found or identified in your search query in Interesting Fields.
Get search result statistics.
Save the Search for future use, either by itself or as part of a Search Package.
Visualize your search data as a dashboard, widget, or a graph.
Add a new Alert Rule based on the search results to create a detection.
Create a new Labelling Rule.
Add the search results to an Incident to respond to.
Share through a report.
Share results outside of Logpoint through a Public URL.
Export raw logs of search results.
Live searches update dashboard widgets and search results in real-time. The more dashboards you have open when performing a search, the more power is required. If you want faster search performance, turn off live searches. If you do, Logpoint will calculate and store dashboard data ahead of time and reuse the data to speed up the time it takes to perform a search. When you want to view live search results, then turn it on again.
Turning Live Search On or Off
In the Navigation bar, click My Preferences.
Click User Interface.
In Dashboard Behaviour > Pre Compute Dashboard Data:, turn on or turn off.
Results
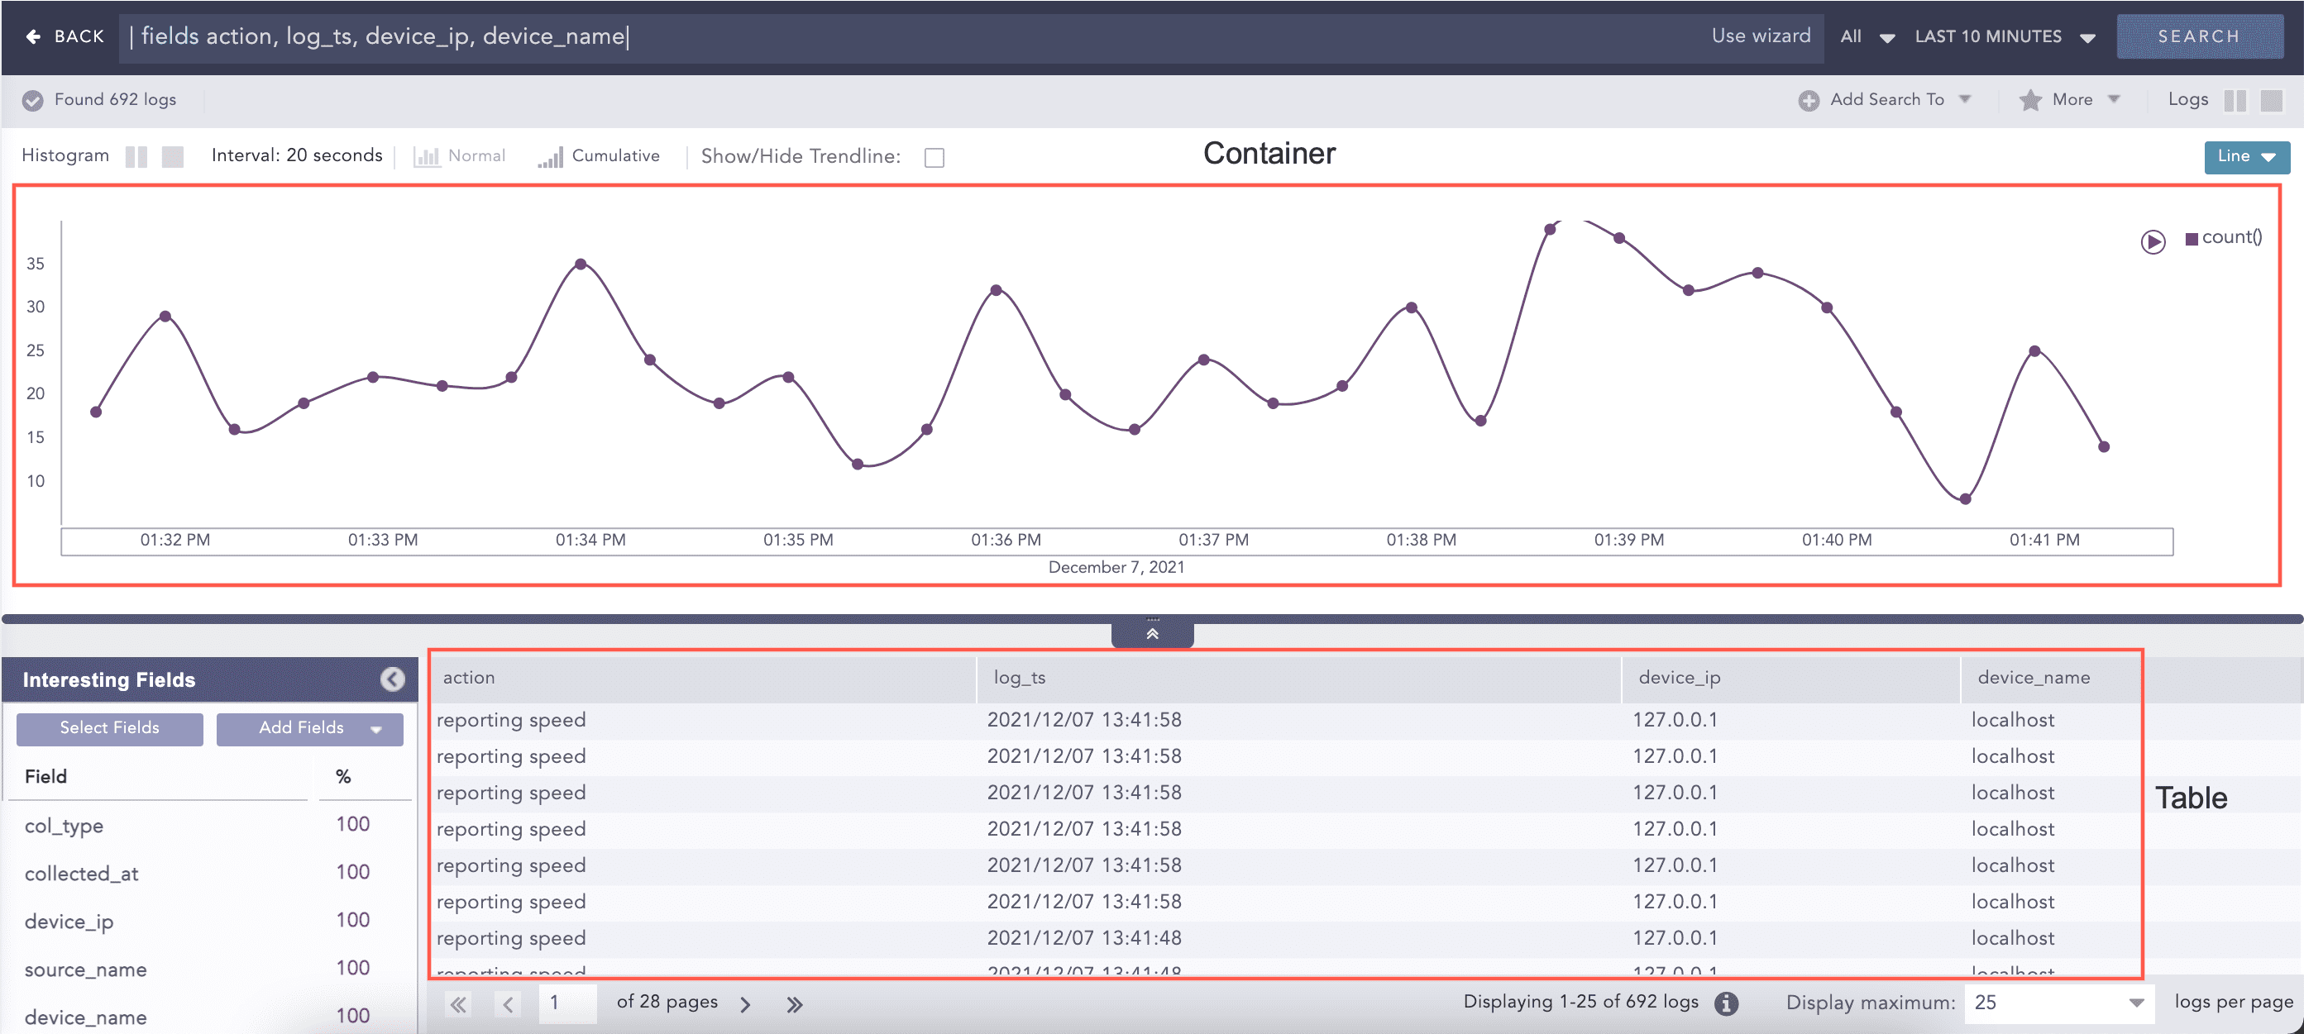
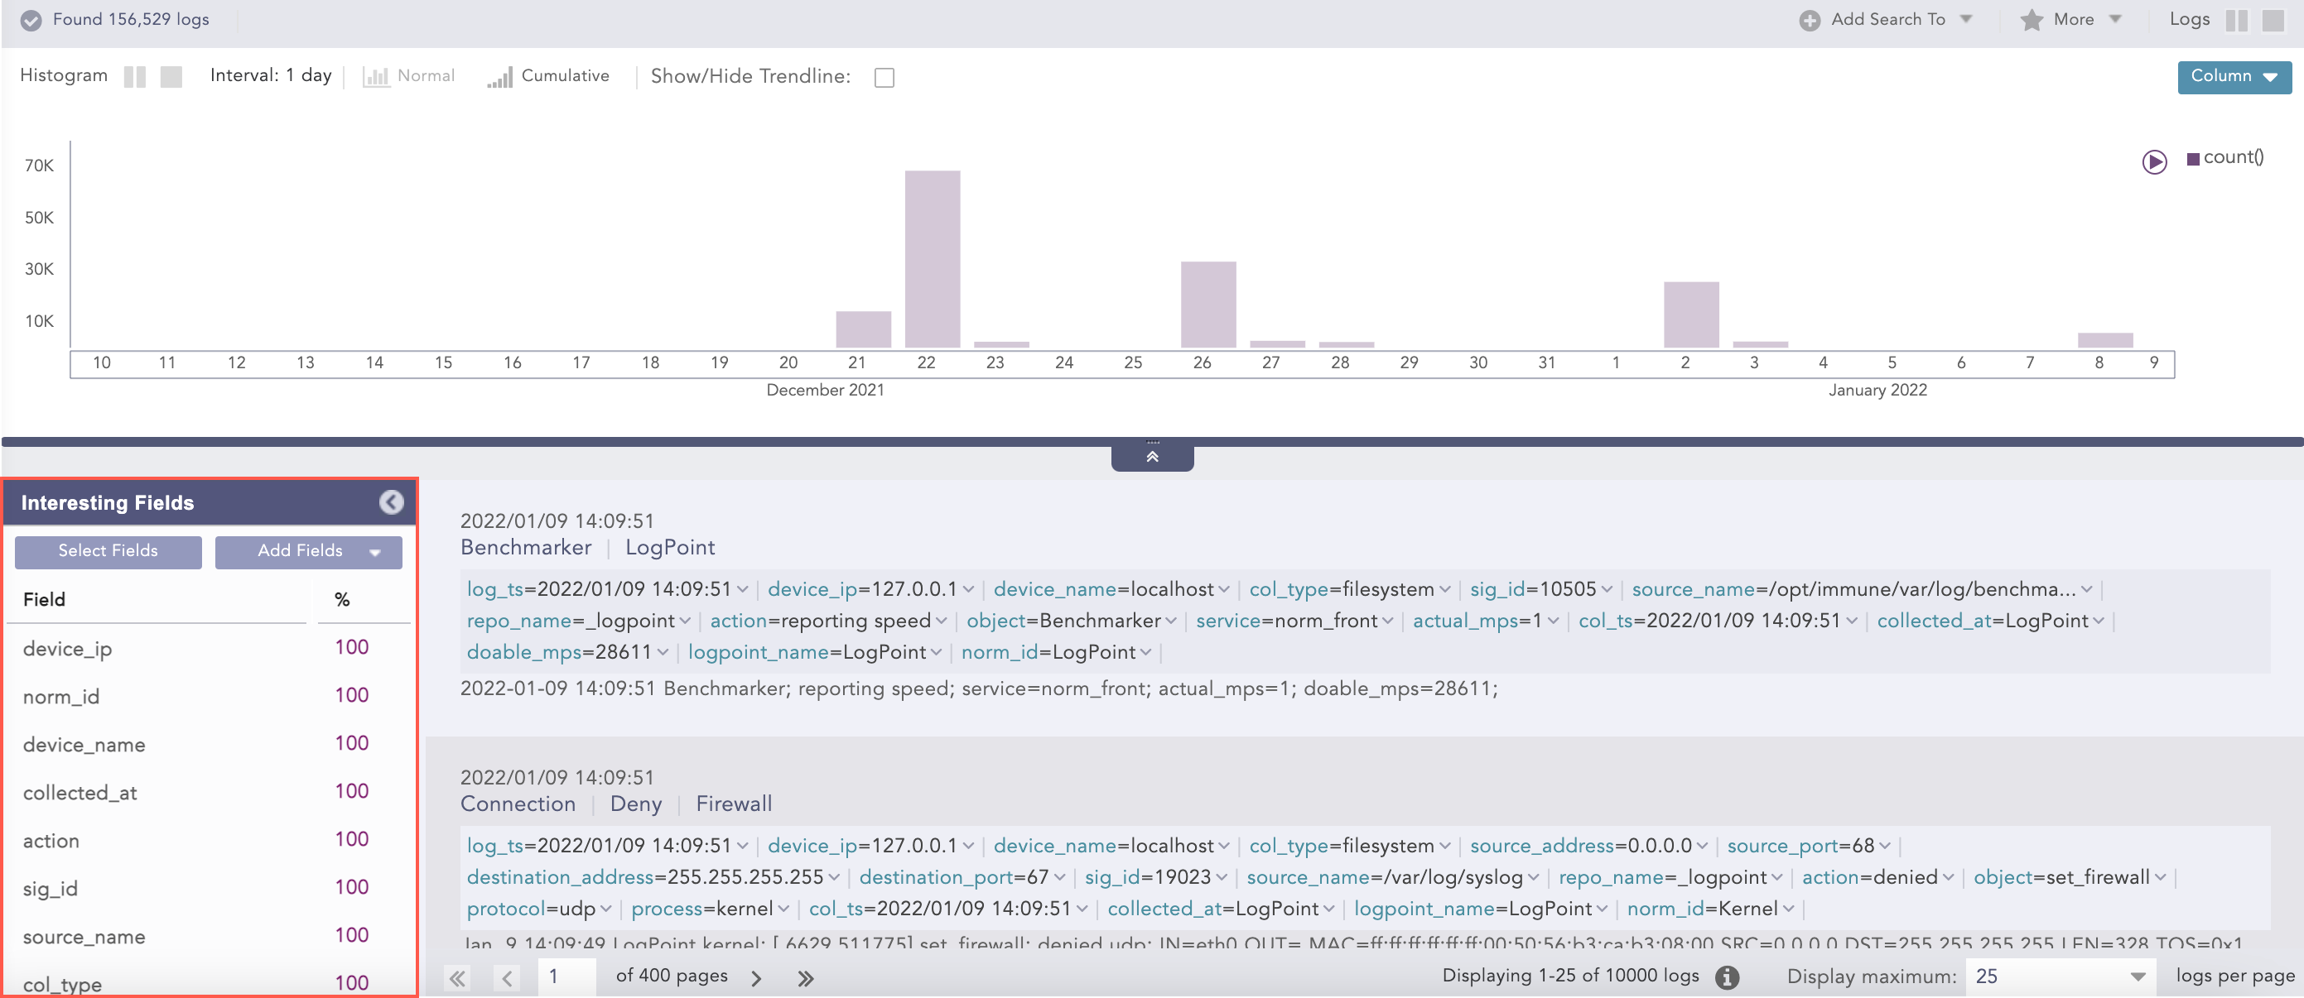
After you run your query, the total number of results is displayed under the Search Bar in Found. This number can dynamically change based on how fast the query runs. Select a value from the drop-down to view the specified number of logs per page. The default value is 25.
Histogram & Charts
The search histogram displays search data graphically. It is located at the top of Logpoint Search. When you hover the mouse over a histogram column you get the timestamp and the log count. You can hide the histogram by default, or show it. Be aware if there are a large number of logs, results are sorted into time buckets, and those time buckets will add more time for your query. If you hide it by default, you get search results much faster. The histogram is only hidden, you can always view it by clicking the arrow to expand it.
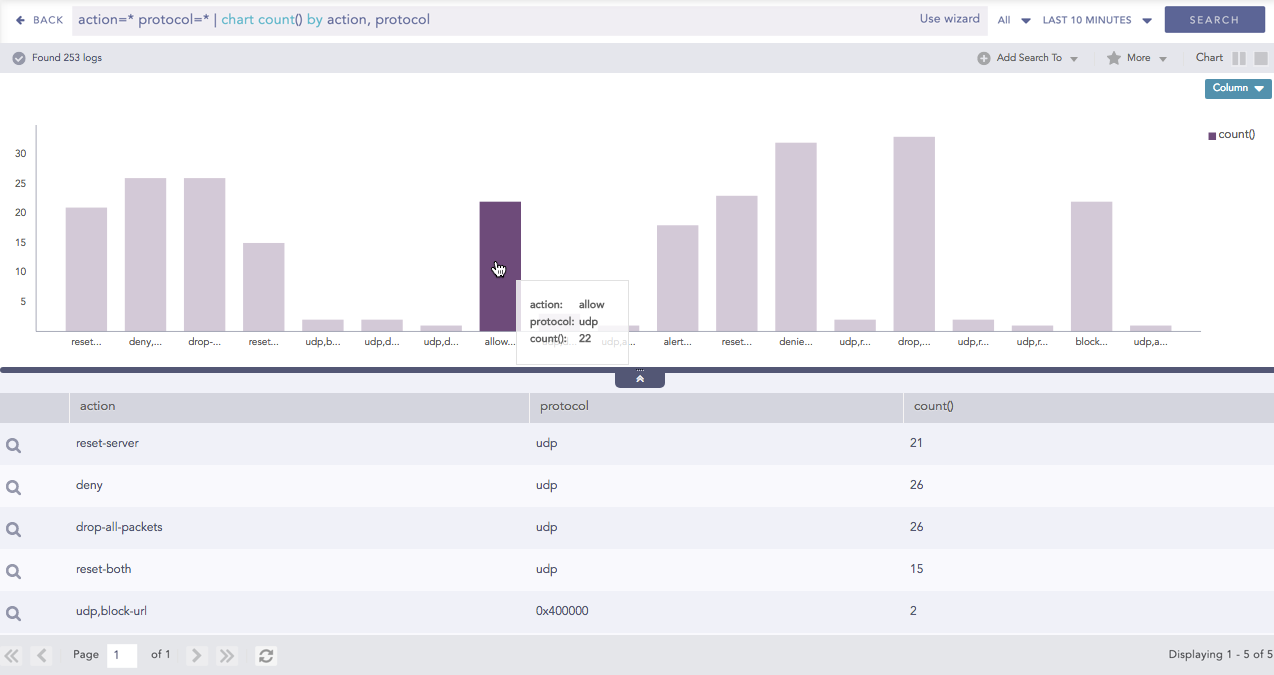
Charts
Dashboard widgets and search result visualization display log data as a chart or a time chart. The data in the widgets reflect search query results for charts and time charts, with timecharts displaying data according to time buckets. A chart also includes a list of result details, and time charts include a table with search details.
To view your data as a chart or timechart, you need to use aggregators in your search query. How you use the aggregators depends on your search and how you want to visualize the results. Which chart or timechart is displayed depends on the search itself, and you can switch between charts depending on the search data results.
After you run a search, you get the results as a chart or a histogram. Depending on the query and the aggregators used, you can change the search visualization.
Switching the Chart
Perform your search.
At the top right, the current chart type is shown. Click the drop-down arrow to change the chart type (if available).
Drilldown
After performing a search, you can drill down on the results. Click:
Histogram or chart data to drill data.
Key in the Key-Value pair add the key as a filter to the original query. Query results are updated.
Value in the Key-Value pair to add the value as a filter to the original query. Query results are updated.
Arrow next to the Value in the Key value Pair to view.
Raw Log message to add the value to the original query. Query results are updated.
Histogram & Chart Drilldown
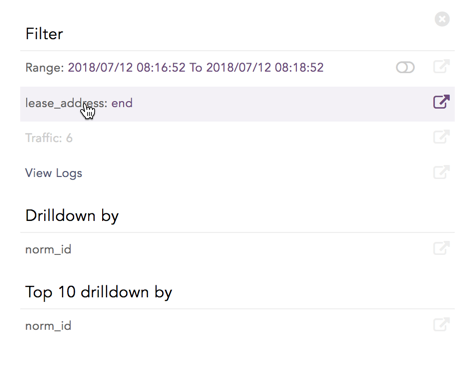
When you click on one of the Histogram columns, you get:
Filter that contains:
Range, or the drilldown data's period of time. Range is only displayed when the query contains the
timechart.count() or total number of logs.
View Logs: to view the logs searched. View them in the drilldown or click the open in new window icon to open a new browser window with the logs.
Drilldown by is the field used in the search.
Top 10 drilldown by the labels used in the search.
You can combine multiple key-value pairs or raw logs highlighted in the results and apply them as filters.
Example: To view successful login events for user [email protected] from IP 192.168.2.20
Click the successful login in the action field
Click the user [email protected].
Click IP: 192.168.2.20. The selected value(s) are added to the query bar.
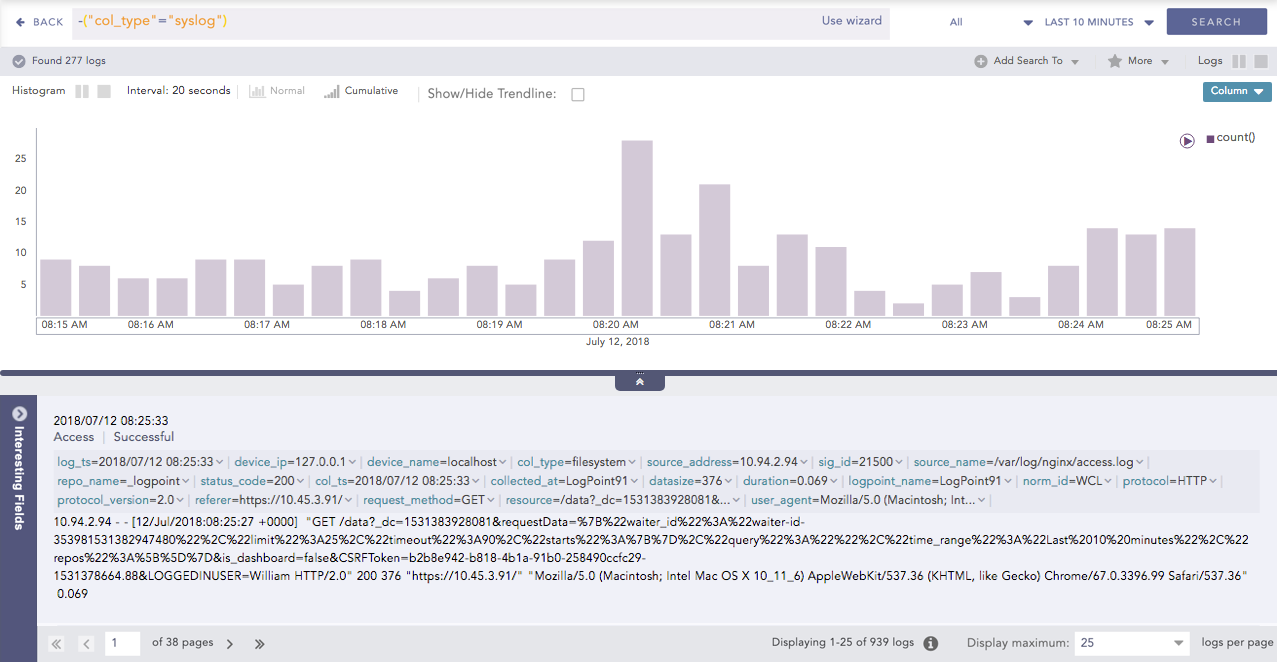
The drill-down for search applies to the filesystem, Logpoint, and localhost, all of which are included in the search.
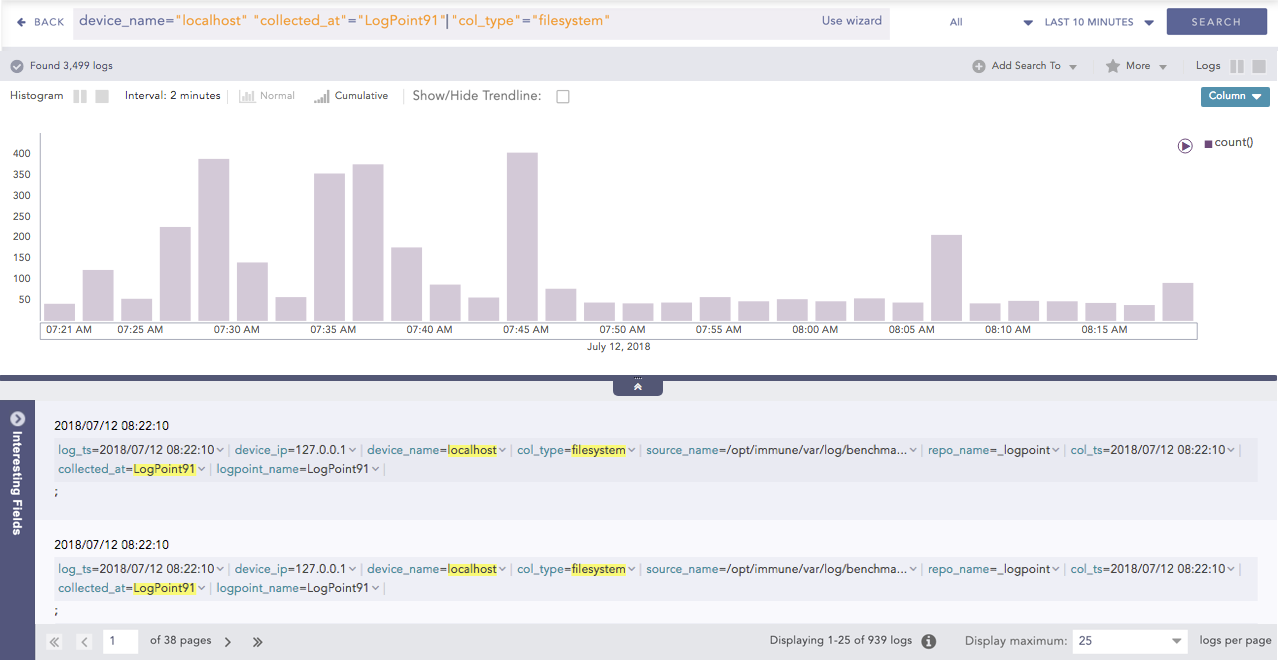
You can also remove a key value pair or raw log from a search drilldown. Select the key value pair or raw log and then press the Shiftkey. For example, deselecting the filesystem field for the query “col_type” = “filesystem” removes filesystem from the search results.
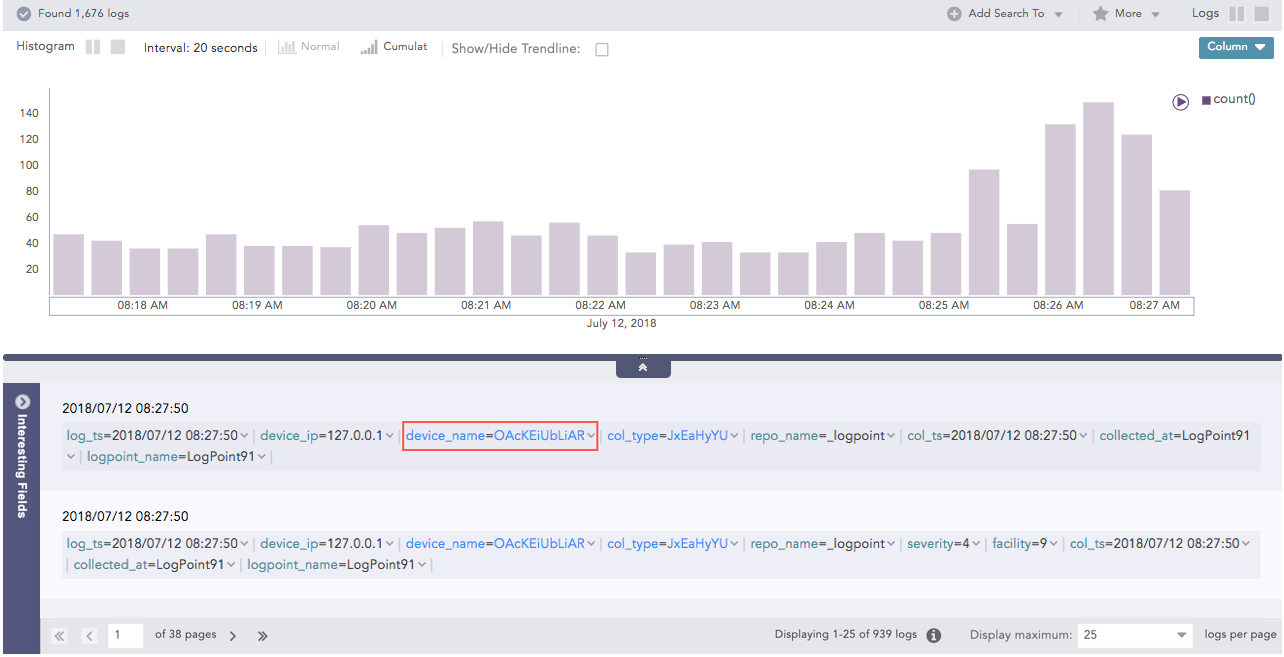
You can apply filters to view specific details of the search data results or the entire database. Click the drop-down next to the key value pair to view:
Top 10 Fields
Time Trend for Fields
Time Trend for Full Resultset or the collection of data retrieved from the search query.
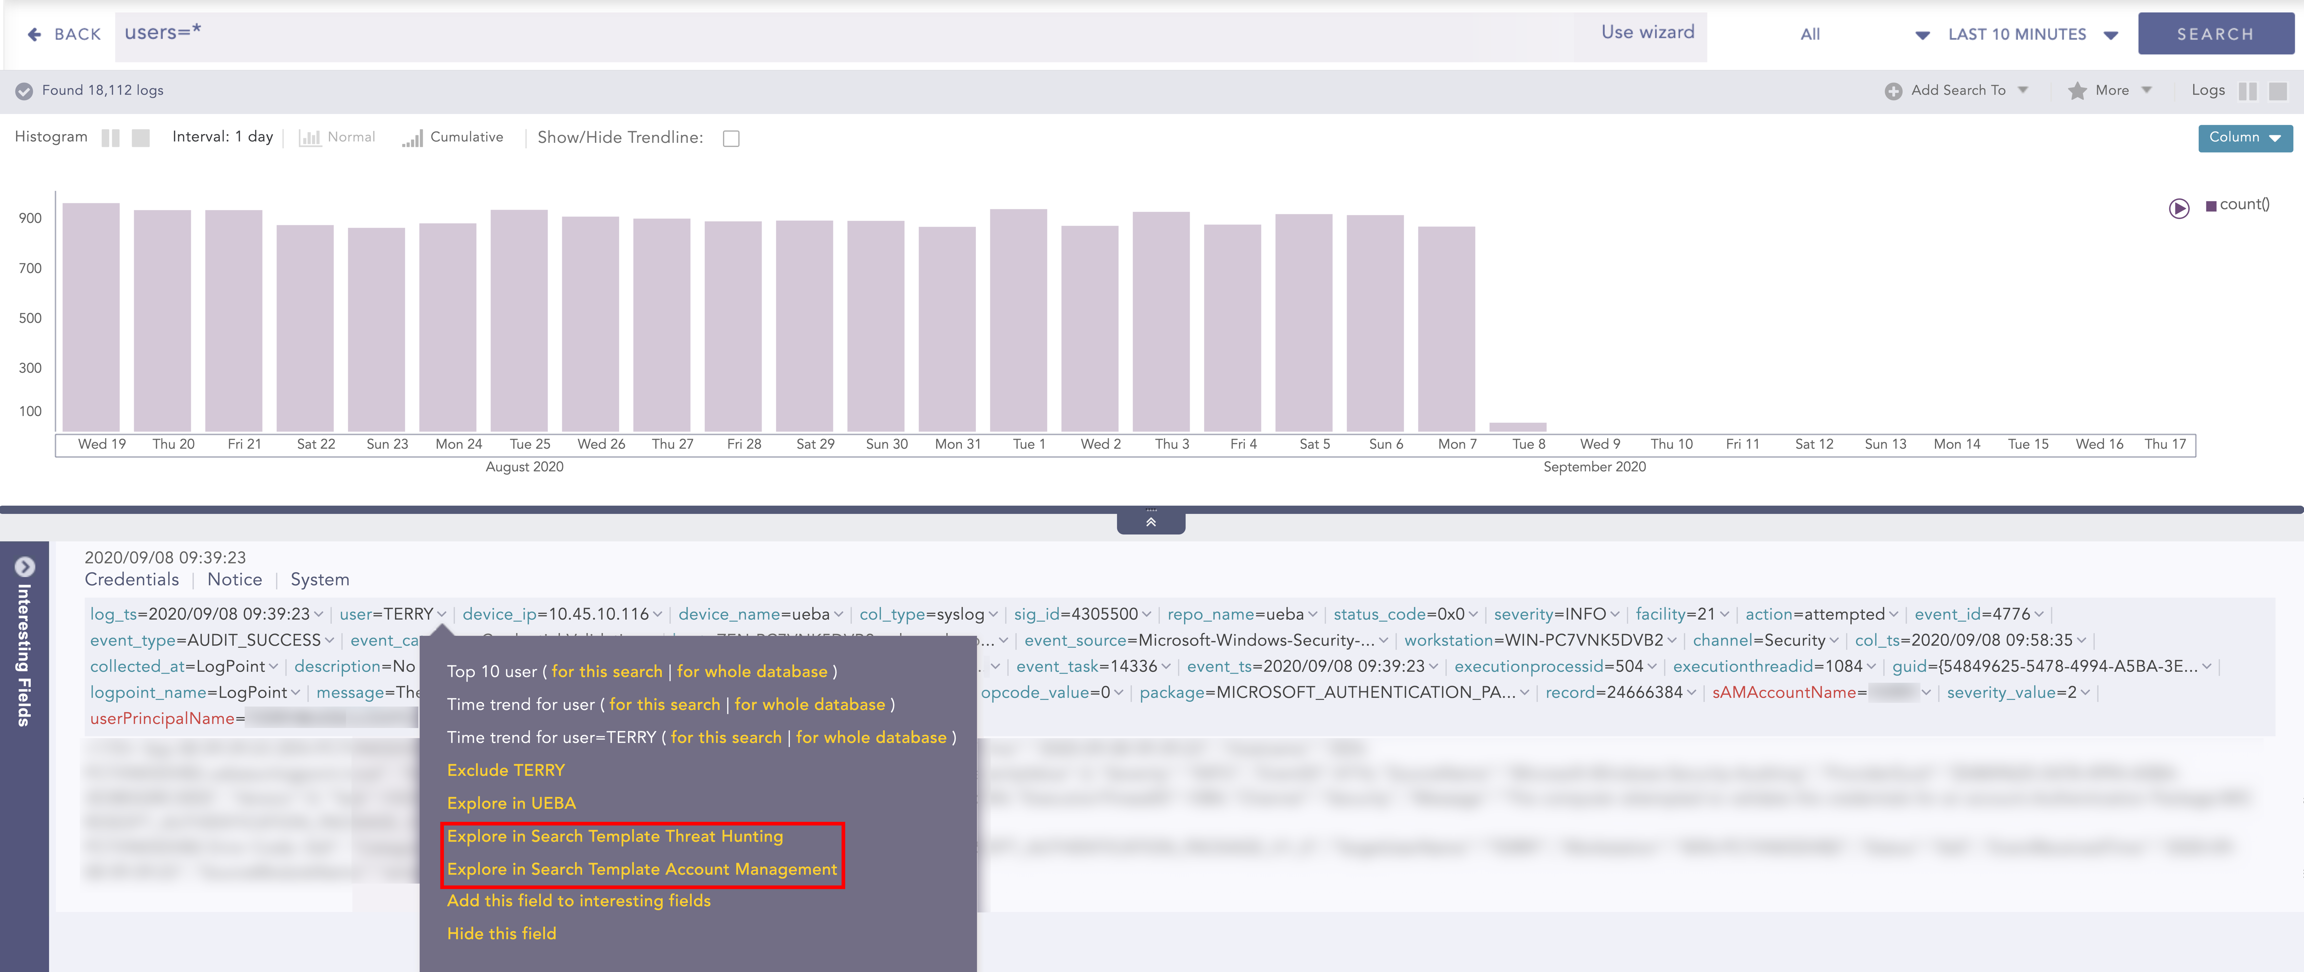
You can also use drilldown in a search template, or move from your search results and view more details in the search template. Click the arrow next to the key value pair to expand, and then click Explore in Search Template. You are redirected to the search template with the selected value filled in.
You can also exclude a key value pair using the Exclude Fields.
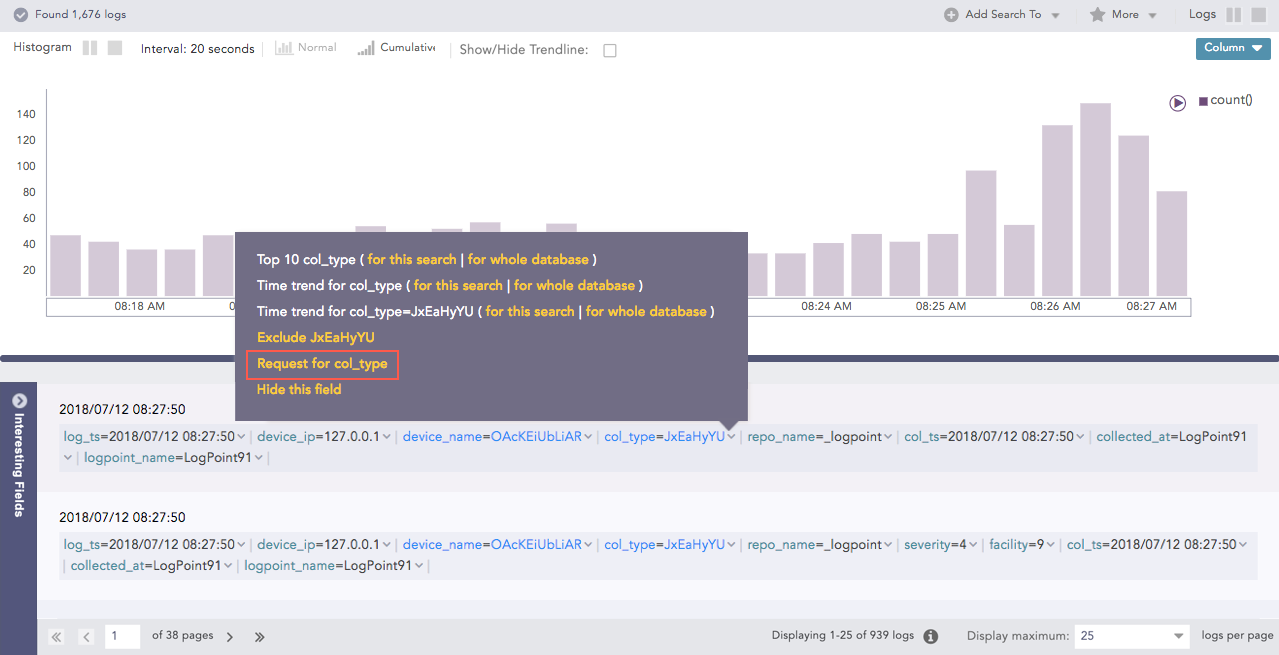
If there are key value pairs that are encrypted using Data Privacy, you can request to view them if you do not have access. If your request is granted, you can now view the fields.
View Encrypted Data Privacy Fields
Go to Settings >> Configurations in the navigation bar, thenClick the Search icon for the granted field under the My Request tab. click Data Privacy Module.
Click the Search icon for the granted field under the My Request tab.
Logpoint redirects you to the Data Privacy Search to view the decrypted values.
Interesting Fields
A field is the key in the key value pair that identifies the value in a normalized logs key value pair. They are the value identifier, or identifier names given to normalized values.
Interesting Fields are the top fields or values found or identified from your search query. After you perform a search using a Simple Search One to One and Filtering Commands, the top 15 fields found most often are listed at the bottom-left.
When you are performing a search, and it the results are taking time to load, there will be a small icon at the top that tells you loading interesting fields is taking time. When the results are completed, it will disappear.
Interesting Fields are turned on by default. You can also turn them off and then turn them on.
table, Time Functions, Aggregators, Pattern Finding and the latest and search filtering commands results are not included in Interesting Fields.
Field Statistics
You can sort the list by clicking column headers. The list contains the Fields and their Percentage (%), or the ratio of the field within the overall results. This is the default view. If the percentage of a field is less than 0.005, the number is rounded to 0.
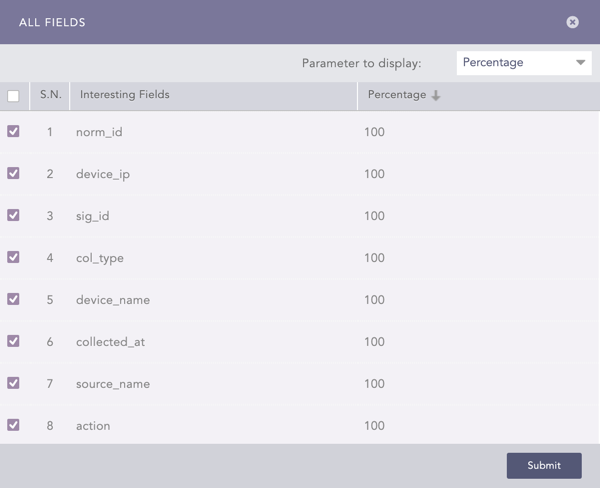
The default is a percentage that you can change using the drop-down.
Percentage — (Total field count / Total number of logs found) * 100
Mean Deviation — absolute value of (total field count - mean count)
Median Deviation — absolute value of (total field count - median count)
Distinct Count — number of times the field shows up in the search results. If the total number of fields or the distinct count exceeds 100, the results are rounded.
Fields log_ts, col_ts, msg, logpoint_name, repo-name, and label are not included in Interesting Fields.
Fields log_ts, col_ts, msg, logpoint_name, repo-nameand label are not included in Interesting Fields.
Change Interesting Fields Statistic
Run a search.
In Interesting Fields, click Select Fields.
In Parameter to display, select the desired statistic. The results appear in the right column next to Interesting Fields.
Add Fields
If you don't see a field you want to work with in Interesting Fields, you can add up to 20 additional ones. You cannot use special or Unicode characters. These fields will be in the list even if there are 0 search results. If you add new fields to the search, you will need to run the search again to include those fields.
Adding New Interesting Fields
In Interesting Fields, click Add Fields.
Enter or type the fields to add. You can add up to 20.
Click Submit.
These fields are added, and you can see them the next time you run your search. If you want to see these fields immediately, rerun the search.
The Interesting Fields feature is enabled by default unless you are using Data Privacy. You can also turn it off.
Turning off Interesting Fields
In the Navigation Bar, go to My Preferences.
Click User Interface.
In Search Help, turn off Disable Interesting Fields In Search Page.
Hide Fields
You can select Hide this field from the drop-down on the key-value pairs to hide them. You can also hide fields in user preferences. You can always go back to your user preferences and change your settings to view these fields again.
Hide Log field
In the navigation bar, go to My Preferences >> Search >> Search Log Fields.
In Search Log Fields, enter fields to hide under Hide These Fields.
Save a Search
After you perform a search, you can save it and use it again. Add it to a search package to group it with other searches.
Save a Search
Under the Search button on the right, click More.
Click Save Search.
Give your search a Name and a unique Identifier.
Add it to a Search Package.
Select Add to public URL to share the search results through a public link.
Create Dashboard Widget
Create a widget based on a search to view search results as a graph. You add the widget to an existing dashboard or create a new dashboard and add the widget to it.
Create a Widget Based on a Search
At the top left of Search, click Add Search to.
Click Dashboard.
Enter a Name for the widget.
The query is auto-filled from your search. To change it, click Select and pick a saved search or from history.
In Repos, select repos to apply the search to.
Select the number of logs to display in Limit.
Click Expose widget to public URL to share the search query data externally.
Enter a Description.
In PLACEMENT OPTIONS,
Scroll through the list to add the widget to an existing dashboard.
Click Add new dashboard to create a new dashboard to add the widget to.
Click Finish. You can view the widget in the dashboard.
In Confirmation, click Yes.
Create a New Detection (Alert Rule)
After you run a search, add it as an Alert Rule to create a new detection.
Creating an Alert Rule
Click Alert Rule.
There are two ways to start creating an alert rule.
Go to Settings >> Knowledge Base from the navigation bar and click Alert Rules. Click Add.
Go to a Dashboard or Search Template widget, click the drop-down. Click Alert.
In Create New Alert, click Parameters.
Enter a Name and Description.
In Query, enter an alert query or use.
If you are creating an alert rule from a widget, the widget’s query is auto-filled in the alert rule.
Click Browse to select a query based on:
Search History: Recent search queries.
Saved searches: Queries you saved.
Vendor searches: Integration-specific searches that are part of a log source.
Search Labels: To select a search based on Labels.
Live Searches: Queries from other alerts.
If your query is long, click Expand. Click Collapse to return to the default view.
Click in Repos to select which repos to run the query on.
In Query Time-range, select the period of time or when to run the query. For example, when the query time range is set to 3 days, Logpoint will search for logs from the last 3 days. You can set a time range in either minutes, hours or days. The maximum time range limit is 30 days or its equivalent in hours and minutes.
In Results Limit, enter the maximum number of logs to retrieve. If you are using an aggregation query, you can't apply a result limit.
If Data Privacy is applied, Data Privacy Module: Alert Using Original data is automatically turned on, and data is encrypted. To decrypt query data, disable it.
In Data Privacy, the values of all configured Data Privacy Module fields are encrypted. For queries that search for specific field values, an incident is not generated. However, for queries that search for all values, an incident is generated with encrypted fields. For example, if the device_name is encrypted using Data Privacy, then the query device_name=localhost won't generate any incident. However, the query device_name=* will result in incidents with encrypted values.
Select the Search Interval in minutes. For example, if you set the search interval to two, Logpoint performs the search every two minutes. The search interval maximum is 1440 minutes. The search interval must be a factor of the Query Time-range. If it isn't, then the correct factor is used. For example, for a 2-day (2880-minute) time range, the maximum duration is 1440 minutes (24 hours), so you can apply a search interval of once a day. Ensuring the search interval is a factor of the Time range improves performance.
You can't apply a search interval to a correlation query.
To ensure all relevant logs are collected before generating an incident, enter a Delay Alertin minutes. Delay Alert should be a multiple of the Search Interval. For example, if the search interval is 5 min, the delay alert should be 5, 10, or 15 minutes. The maximum value for the Delay Alert is 24 hours. You can only apply a Delay Alert to log_ts-based searches.
To ensure the next alert triggered is based only on new log events, turn on Enable Flush On Trigger.
To ensure that Logpoint does not create multiple alerts for the same log events during a specific time frame, in Alert Throttling, select the field and the period of time in minutes. When an alert is triggered based on that field, a new alert won't be triggered until the time you set has passed.
Click Criteria. Criteria specifies the exact conditions or thresholds that must be met for the alert to trigger an incident. This is typically based on log count metrics from the query in the Alert Rule. When an alert rule detects a potential threat, Logpoint uses the Alert Rule's criteria together with a device's Risk Values to determine the overall risk severity. For example, if the criteria is set to trigger an alert when the number of failed login attempts exceeds 100 in 5 minutes, an alert is only generated when that happens. Risk Calculation Function determines which severity level to select when comparing the risk level of the threat with the risk level of the device.
In Condition, select a mathematical function and then the number of logs to apply it to.
In Risk, select how serious the risk level or severity of the detection or threat.
In Risk Calculation Function, select:
Maximum to mark the alert with the greater risk when comparing the threat with the device.
Minimum to mark the alert as having lower risk when comparing the threat to the device.
Average to find the average between the threat and the device.
Go to or click Metadata.
In ATT&CK Techniques, select the MITRE tactics to categorize the alert. You can select more than one.
In Additional Meta-Data, enter key-value pairs to apply additional categories to the alert. You can't use reserved Jinja placeholders or leave a key or value in a key-value pair blank.
Use Log Source to link a log source to the Alert Rule.
Go to or click Ownership. Users who belong to Incident User Groups assign the Alert rule to a user, user group, or themselves. Assigned users can reassign, comment on, and view the generated incident data. They can also resolve the alert. If you do not belong to an incident user group, the alert will be assigned to you.
To assign the alert to:
An individual user, select them in the Assigned to drop-down.
A group, select the group in Manageable By.
Yourself, make sure nothing is selected or entered in Ownership. Everything should be blank.
To view the details of the incidents triggering the alert in a specific format, click Data Template.
Turn on Apply Jinja Template.
Enter Jinja Syntax code in the text field.
Alert Rules can be exported and imported. If you export an Alert Rule, the ownership is lost. If you import an Alert Rule, you get the ownership.
Click Create Alert.
Add a Labelling Rule
Adding a Search To Labelling Rule
Click Labelling Rule.
Select a Package and enter a List of Labels.
Click Submit.
Adding a Search to an Incident
At the top left of Search, click Add Search to.
Click Incident.
In Incident Information, enter an Incident Name, Description, and select the Risk level. In Ownership, set up user access rights to the incident.
In Assigned to, enter the incident owner.
In Manageable by, select the Incident User Group that can view the Alert Rule.
In CATEGORIZE ALERT,
Select the Attack Tag: from the dropdown. The attack category is automatically applied.
Use Metadata to categorize the Alert Rule. Enter the Fields and Values.
In Log Source, select the Integration or multiple Log Sources to apply the Alert Rule to.
Click Submit.
Create Report
After you run a search, generate a report of the search results and send it via email as a report.
Creating a Report from a Search Query
Go to Search and enter a query.
Click the More dropdown.
Click Report.
Enter a Name and an Email.
Click Submit.
Share Search (Public URL)
Share the search query results with people who aren't Logpoint users. Adding a search to a public URL lets other people view the search results without having to log in to Logpoint SIEM.
Adding Search To Public URL
At the top left of Search, click Add Search to.
Click Public URL.
Enter a Name, an Identifier, and a Package to add your search to a public URL.
Click Ok.
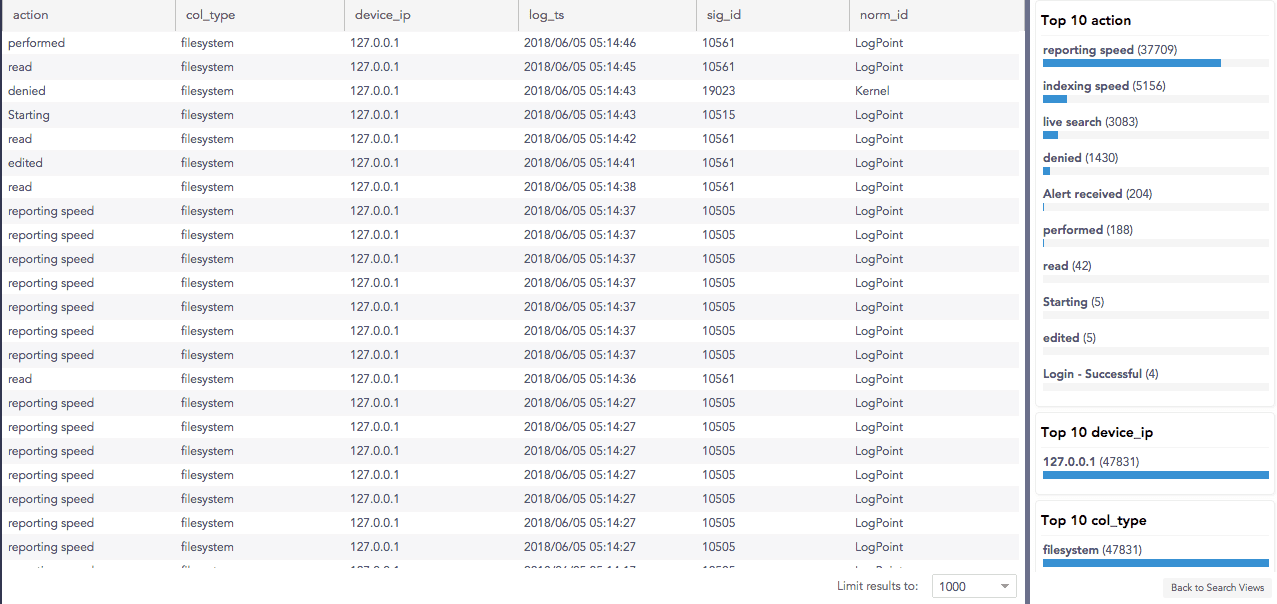
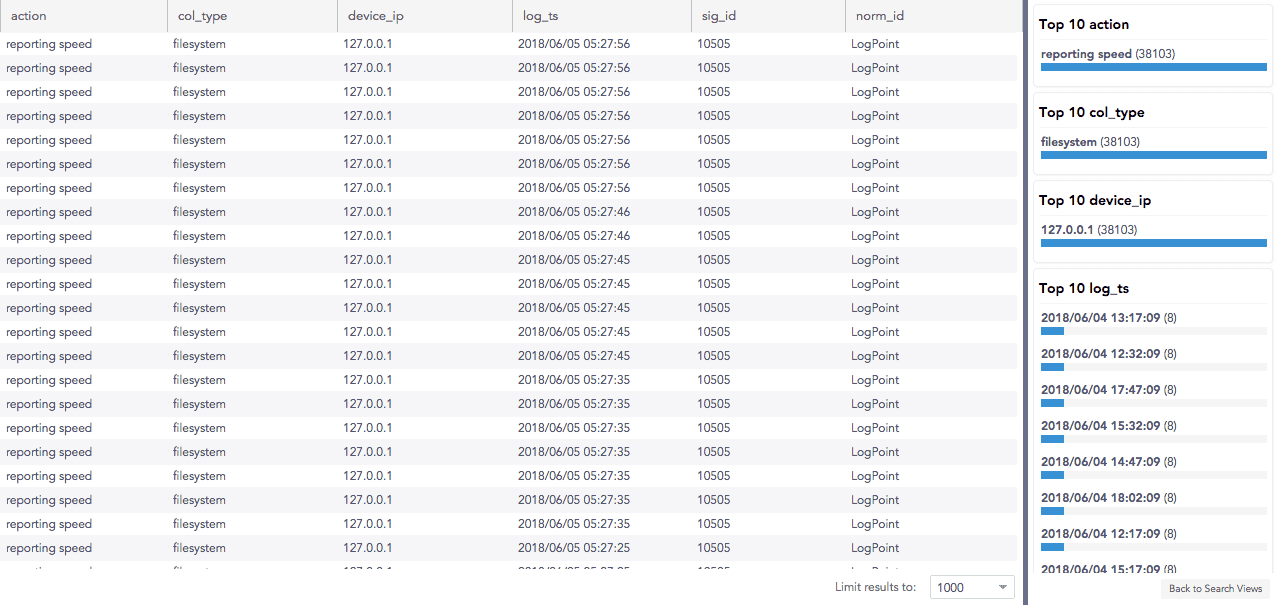
Key Values & Statistics
View search results according to normalized key-value pairs data. Log data is listed according to key value pairs and calculates the top 10 data based on the frequency or greatest number of times the value, from the key value pair, appeared or was identified from the search. Termed Search View, you setup a new view through selecting which fields to include in the top 10 list. If you aren't interested in a specific field, don't select it.
You can share Key Value views or clone one of the views and then edit to use the view as a template for a new view.
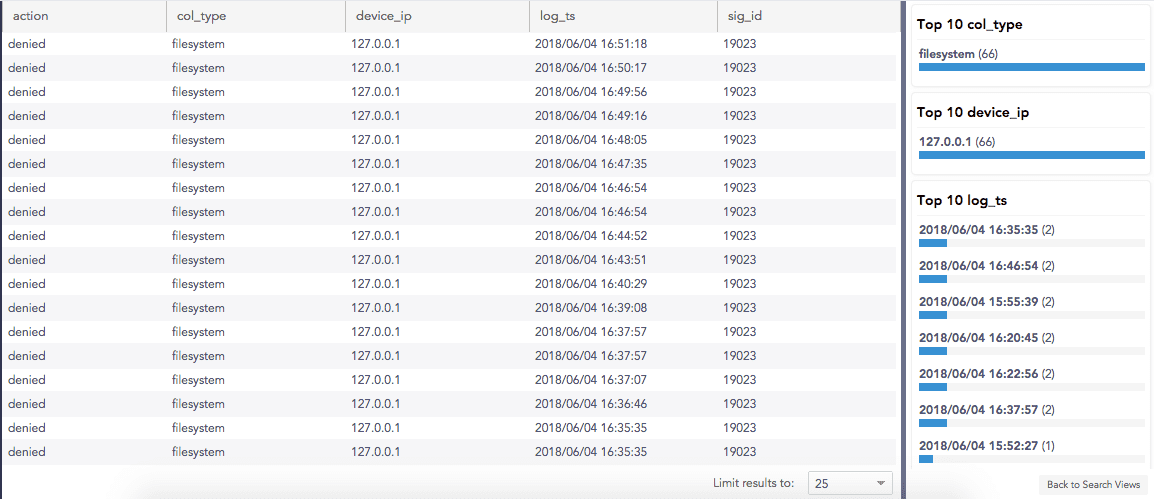
At the top is the query used to perform the search. The table lists all of the search results, based on the fields you selected for the view. On the right are the top 10 lists, sorted by the query fields.
Use your mouse to switch between the list and the Top 10 data. You filter your search data by entering a key or field in the filter.
Examples
Initial search query:
After drilling down on action = reporting speed:
Remove a field
After performing the search, you can remove fields that you don't want or need to see from Results list and the Top 10 statistics. Add the minus (-) symbol before the field you want to remove.
Example query:
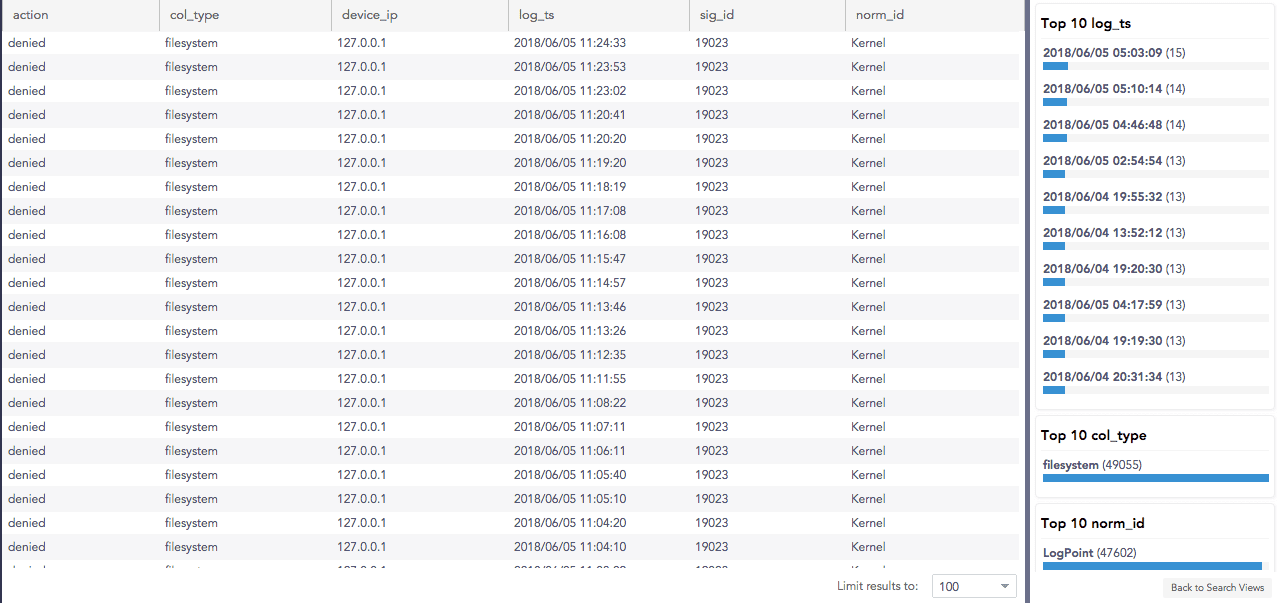
To remove the field action= denied, the query becomes:
Search Views
Search Views lets you customize how search results are displayed and analyzed. After you run a search query, Logpoint shows key value statistics (often referred to as a “search view”) that highlight the top fields and values found in your results. These views help you quickly understand the most relevant aspects of your search results and focus your investigation.
To access Search Views, use the Search Views option in the bottom-right corner of the Search page to open All Search Views or select a specific view to display its search results.
Create New Search View
Go to Settings >> Knowledge Base from the navigation bar and click Search Views.
Click Add.
Enter a Name and Description.
In FIELDS TO BE USED, enter normalized field names and reorder with arrows as required.
Click Submit.
Edit a Search View
Go to Settings >> Knowledge Base from the navigation bar and click Search Views.
Click the Name of the view to edit.
Update the information and and click Submit.
Clone a Search View
Go to Settings >> Knowledge Base from the navigation bar and click Search Views.
To clone a single view:
Click the Clone icon in the Actions column.
Select the views to clone on the left.
Click More on the right, then Clone Selected.
To clone all Search Views, click the MORE dropdown menu and choose Clone All.
Click Clone.
Share a Search View
Go to Settings >> Knowledge Base from the navigation bar and click Search Views.
To share a single view:
Click the Share icon in the Actions column.
Select the views to share on the left.
Click More on the right, then Share Selected.
To share all Search Views, click the MORE dropdown menu and choose Share All.
Click Submit.
Delete a Search View
Go to Settings >> Knowledge Base from the navigation bar and click Search Views.
To delete a single view:
Click the Delete icon in the Actions column.
Select the views to delete on the left.
Click More on the right, then Delete Selected.
To share all Search Views, click the MORE dropdown menu and choose Delete All.
Click Yes.
Create New Key-Value Search View
Go to Settings >> Knowledge Base from the navigation bar and click Search Views.
Click ADD.
Enter a Name and a Description.
Select the fields to be used and click Add. You can re-order the fields using the arrow keys in the Actions column.
Select the fields to Show on Top 10 List. You have to select them to include them.
Click Submit.
Export Raw Logs
Export Management allows you to export raw logs from Search results to a target storage location on a remote Logpoint. You can export raw logs from simple search queries, not aggregated queries. If Data Privacy is enabled, you can’t export raw data.
Export Management is not available in SaaS.
Adding a Target
You can create a target either by using Secure Copy Protocol (SCP) or File Transfer Protocol (FTP). Before configuring Export Management, you need to create a target. To create a target:
Go to Settings >> Configuration in the navigation bar, then click Export Management.
Click ADD and select either SCP protocol or FTP protocol to add the target.
For SCP:
Enter a Name.
Enter the IP address of the remote Logpoint.
Enter a Port number.
Enter the Username.
Select an Authentication protocol.
If you select Password, enter the authentication Password.
If you select SSH Certificate, copy the provided key and add it to authorized keys in the remote Logpoint.
For FTP:
Enter the Name of the export file.
Enter the IP address of the remote Logpoint.
Enter a Port number.
Enter the Username and Password recognized by the given IP address.
Enter the Path of the target Logpoint.
Click Save.
Accessing a Target
To access the created and configured target, go to Search from the navigation bar, click the More dropdown and click Export Logs. The names of the created targets are listed in the dropdown menu under Search >> More >> Export Logs >> Target. You can export search results for any query to any target as required.
If you have configured SCP Export, multiple lines of the same log are counted as different logs. Therefore, the number of logs in the search results is different from the number of exported logs.
Job Status displays the Name, Type, Status, and Remarks of the export log status with their Actions.
Deleting an Export
Go to Settings >> Configuration in the navigation bar, then click Export Management.
Click the Delete icon under Actions.
To delete multiple exports, select the exports, click the MORE dropdown, and select Delete Selected.
To delete all the exports, click the MORE dropdown and select Delete All.
Click Yes.
Was this helpful?