Search Query Language
Logpoint’s Query Language is extensive, intuitive, and user-friendly. It covers all the search commands, functions, arguments, and clauses. You can search the log messages in various formats depending on the query you use.
Logpoint also supports chaining of commands and multi-line queries. Use a pipe (|) to chain the commands and press Shift + Enter to add a new line in the query. The search keywords are not case-sensitive. You can also add comments when entering a search query to provide descriptive notes for your query.
Syntax:
/* Comment */Simple Search
You can use the following types of simple queries to familiarize yourself with the Logpoint Query Language.
The order of the words is not essential.
Single word
Single word search is the most basic search that you can run in Logpoint. Enter a single word in the Query Bar to retrieve the logs containing the word.
loginThis query searches for all logs containing the word login.
Multiple words
Searching with multiple words lets you search the original logs using a combination of words. For multi-word searches, only logs containing all the words are displayed.
account lockedThis query searches for all logs that contain both the search terms account and locked.
Phrases
Phrase Search lets you search for the exact phrase in the logs. You must enclose the words inside double-quotes (” “).
This query searches for all logs containing the exact phrase account locked.
Field values
The normalized logs contain information in key-value pairs. You can use these pairs directly in the log search. To see all the logs from the user Bob, use the following query:
This query retrieves all logs for the user Bob.
This query searches for all the logs coming from the device with the IP Address 192.168.2.1. You can combine multiple field value pairs as:
You can also combine this with a simple query as:
Values with Quotes
When searching for values that are wrapped in quotation marks (” or ‘), add extra quotes around your search term. This is necessary because the system strips away the outermost quotes during processing.
For example, if you want to find logs containing the exact phrase value, including the quotes, writing the query as follows will search for the term value, without quotes.
To search for a value including quotes, add extra quotes as shown below:
This instructs the system to treat the quotation marks as part of the value.
If the value in the normalized field contains a combination of single (‘) and double (“) quotes, the above method will not return a match. In such cases, the system cannot interpret mixed-quote patterns using the above search syntax. For example, field = ""val'ue"" won’t search for logs with "val'ue".
Logical Operators
Use the following keywords to perform logical operations in the Logpoint search query.
And
Use the logical AND operator to search for slogs that contain both specified parameters.
This query searches for all logs containing the words "login" and "successful".
The and operator can also be used for key-value search queries as follows:
Or
Use the logical operator or to search for the logs containing either of the specified parameters.
This query searches for all logs containing either the word login or the word logout.
This operator can also be used with the key-value search query as follows:
Not
Use the hyphen (-) symbol for the logical negation in your searches.
This query searches for logs containing the word login but not the word Bob.
This query returns logs that contain all device_ips except 192.168.2.243.
While searching with field-names, you can also use != and NOT to denote negation.
By default, the or operator binds strongly than the and operator. When performing the login or logout and MSWinEventLog, Logpoint returns logs containing either login or logout with MsWinEventLog.
Parentheses
In Logpoint, the or operator has a higher precedence by default. Use parentheses to override the default binding when using the logical operators in the search query.
This query returns logs containing login failed or both denied and locked.
Wildcards
Use wildcards to replace parts of the query string. Use the following characters as wildcards:
? - Replacement for a single character.
* - Replacement for multiple characters.
For logs containing the word login or logon, use:
This query also searches for the log messages containing other variations such as logan, logbn, and logcn. The following query returns the logs containing the words starting with log, such as logpoint, logout, and login.
You can also use Wildcards while forming a search query with field names. To retrieve all usernames ending in t, use:
Step
Use the step function to group numeric fields into ranges. You can also use it to group results by multiple fields.
For example, to view logs grouped by destination_port in intervals of 100:
destination_port
count
0 - 100
50
100 - 200
32
Use the following query:
This query searches for logs that contain the destination_port field and groups them into ranges of 100. The value 0 at the end of the step function defines the start of the grouping.
Lower and Upper
Change the letter case of field values using case-conversion functions. Use the lower function to convert values to lowercase, and the upper function to convert values to uppercase. These functions normalize field values, ensuring consistent results when searching, grouping, or comparing data.
Use the upper and lower functions with the chart and timechart commands.
Time Functions
Time functions extract specified values from time-based fields. The following time functions are supported in the Simple Search Query:
second
minute
hour
day
day_of_week
month
These functions take numeric arguments and parse values as Unix timestamps. Unix time is a system for describing instants in time, defined as the number of seconds that have elapsed since 00:00:00 Coordinated Universal Time (UTC), Thursday, 1 January 1970, not counting leap seconds. It is used widely in Unix-like and many other operating systems and file formats.
Example: 1384409898 is the Unix time equivalent of Thu, 14 Nov 2013 06:18:18 GMT
In Logpoint, col_ts and log_ts carry Unix timestamps. However, create your own fields containing Unix timestamps using the rex or norm commands.
Use the relational operators (>, <, =, and !=) with the time commands to create a sensible time range for your search queries.
second
Use the second function to search for logs generated or collected in seconds.
The generic syntax for second is:
The value for the second ranges from 0 to 59.
This query searches for the logs generated during the twenty-third second.
minute
Use the minute function to search for logs generated or collected in minutes. The minute values range from 0 to 59.
This query searches for the logs generated during the second minute.
Minute () can also be used in aggregation functions.
hour
Use the hour function to search for logs generated or collected in hours. The hour values range from 1 to 24.
Example:
This query displays the logs generated during the first hour.
day
You can use the day function to search for logs generated or collected in days.
Example:
This query displays the logs of the 4th day.
day of week
Use the day of week function to search logs for a specific day of the week. The day_of_week value ranges from 1 (Sunday) to 7 (Saturday).
Example:
This query displays the logs on off days, i.e, Saturday and Sunday.
month
Use the month function to search logs generated or collected in months. The value of the month ranges from 1 (January) to 12 (December).
Example:
This query displays the log activity for June.
Aggregators
Aggregators are used with the chart and timechart commands to group and aggregate field values in search results. They summarize large volumes of data into structured output, such as counts, averages, or distributions. Search results processed by aggregators are formatted using the fields, chart, or timechart commands.
Result Limits
Aggregators display 40 results by default.
Each aggregator has an internal limit of 500,000 results.
A single aggregator forwards no more than 500K results to subsequent aggregators or processes commands. Use the limit <number> command to forward more results.
Queries using an aggregator that produces large groupings can yield incomplete search results. To get complete results, use the order by to sort the search results in ascending or descending order. There are also audit logs you can use to verify the results.
Using free-text queries within an aggregator results in raw log processing, which is resource-intensive. Only use free text within an aggregator when necessary.
chart
The chart command aggregates search results and presents them in a chart format.
To group all logs containing login by device_ip, use:
This query searches for logs containing the term login, and groups them by device_ip, and displays the number of logs per device IP.
You can also count by multiple fields. The log count is then displayed for each field.
In this case, the count of the log for every combination of destination_address and destination_port is grouped, and the corresponding count is displayed.
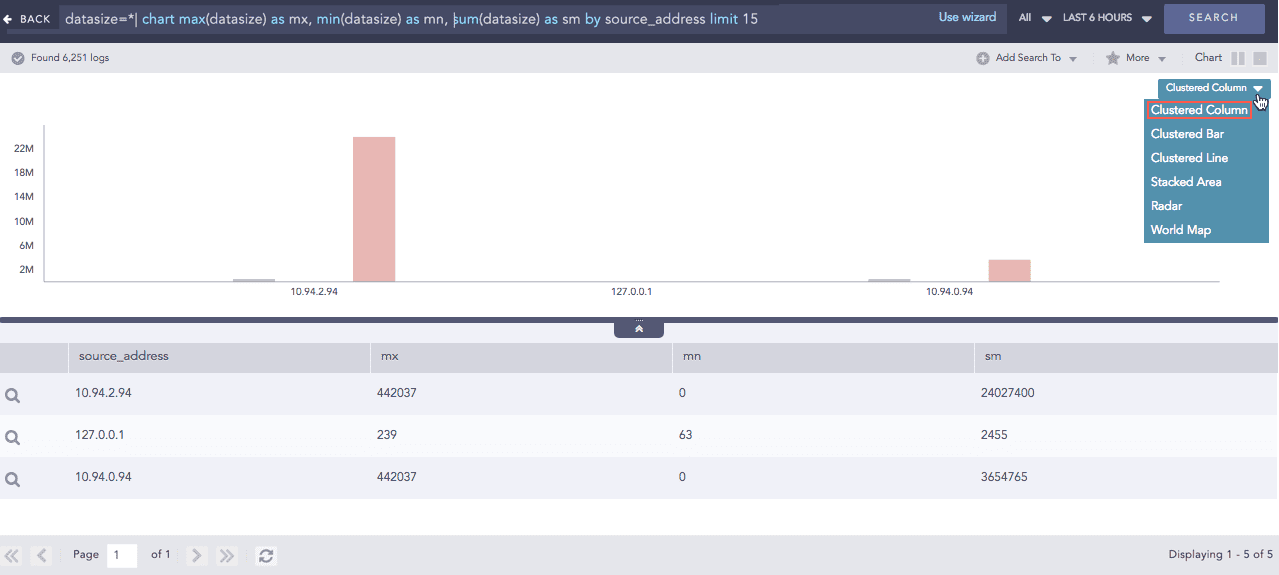
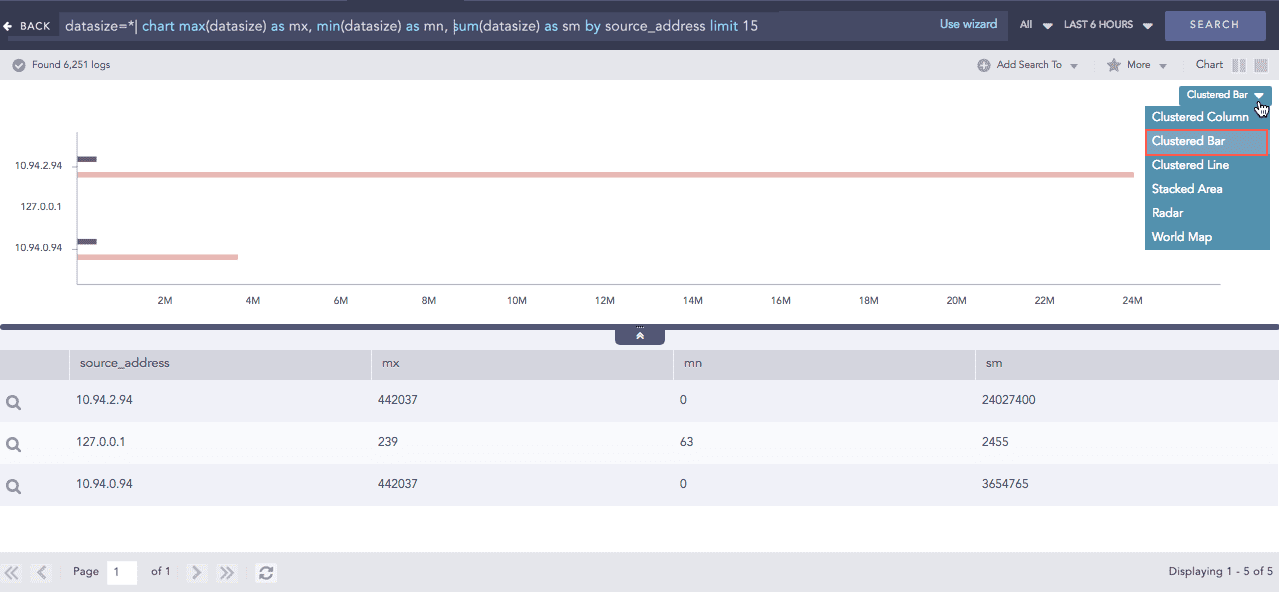
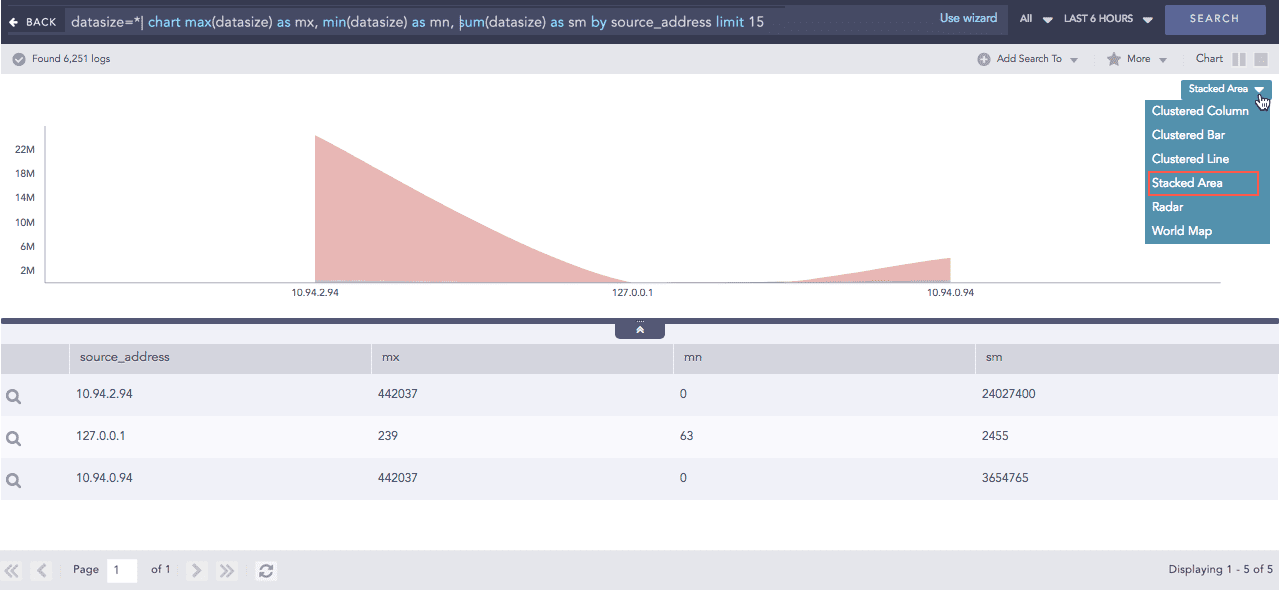
You can use other aggregation functions, such as max and min, in place of count.
You can also display the chart in different forms, such as Column, Bar, Line, and Area.

You can also modify aggregation functions as follows:
In this query, only logs containing action=permitted are counted. You can write the same query as:
Multiple counts or other aggregators can be used in a single query string.
This query displays two columns. The first is the count of the connections with the permitted action, and the second is the count of blocked actions.
Use order by to sort the search results within a single query, without separating it with a pipe (|).
timechart
You can use timechart to chart logs as a time series. It first displays logs in chronological order by the time they were collected or generated. Then it returns the log results based on the collection timestamp (col_ts) or the log generation timestamp (log_ts). You cannot use order by with timechart.
The terms log_ts and col_ts have different functions.
log_ts
col_ts
Denotes the time present in log messages.
Denotes the time when Logpoint collected the log.
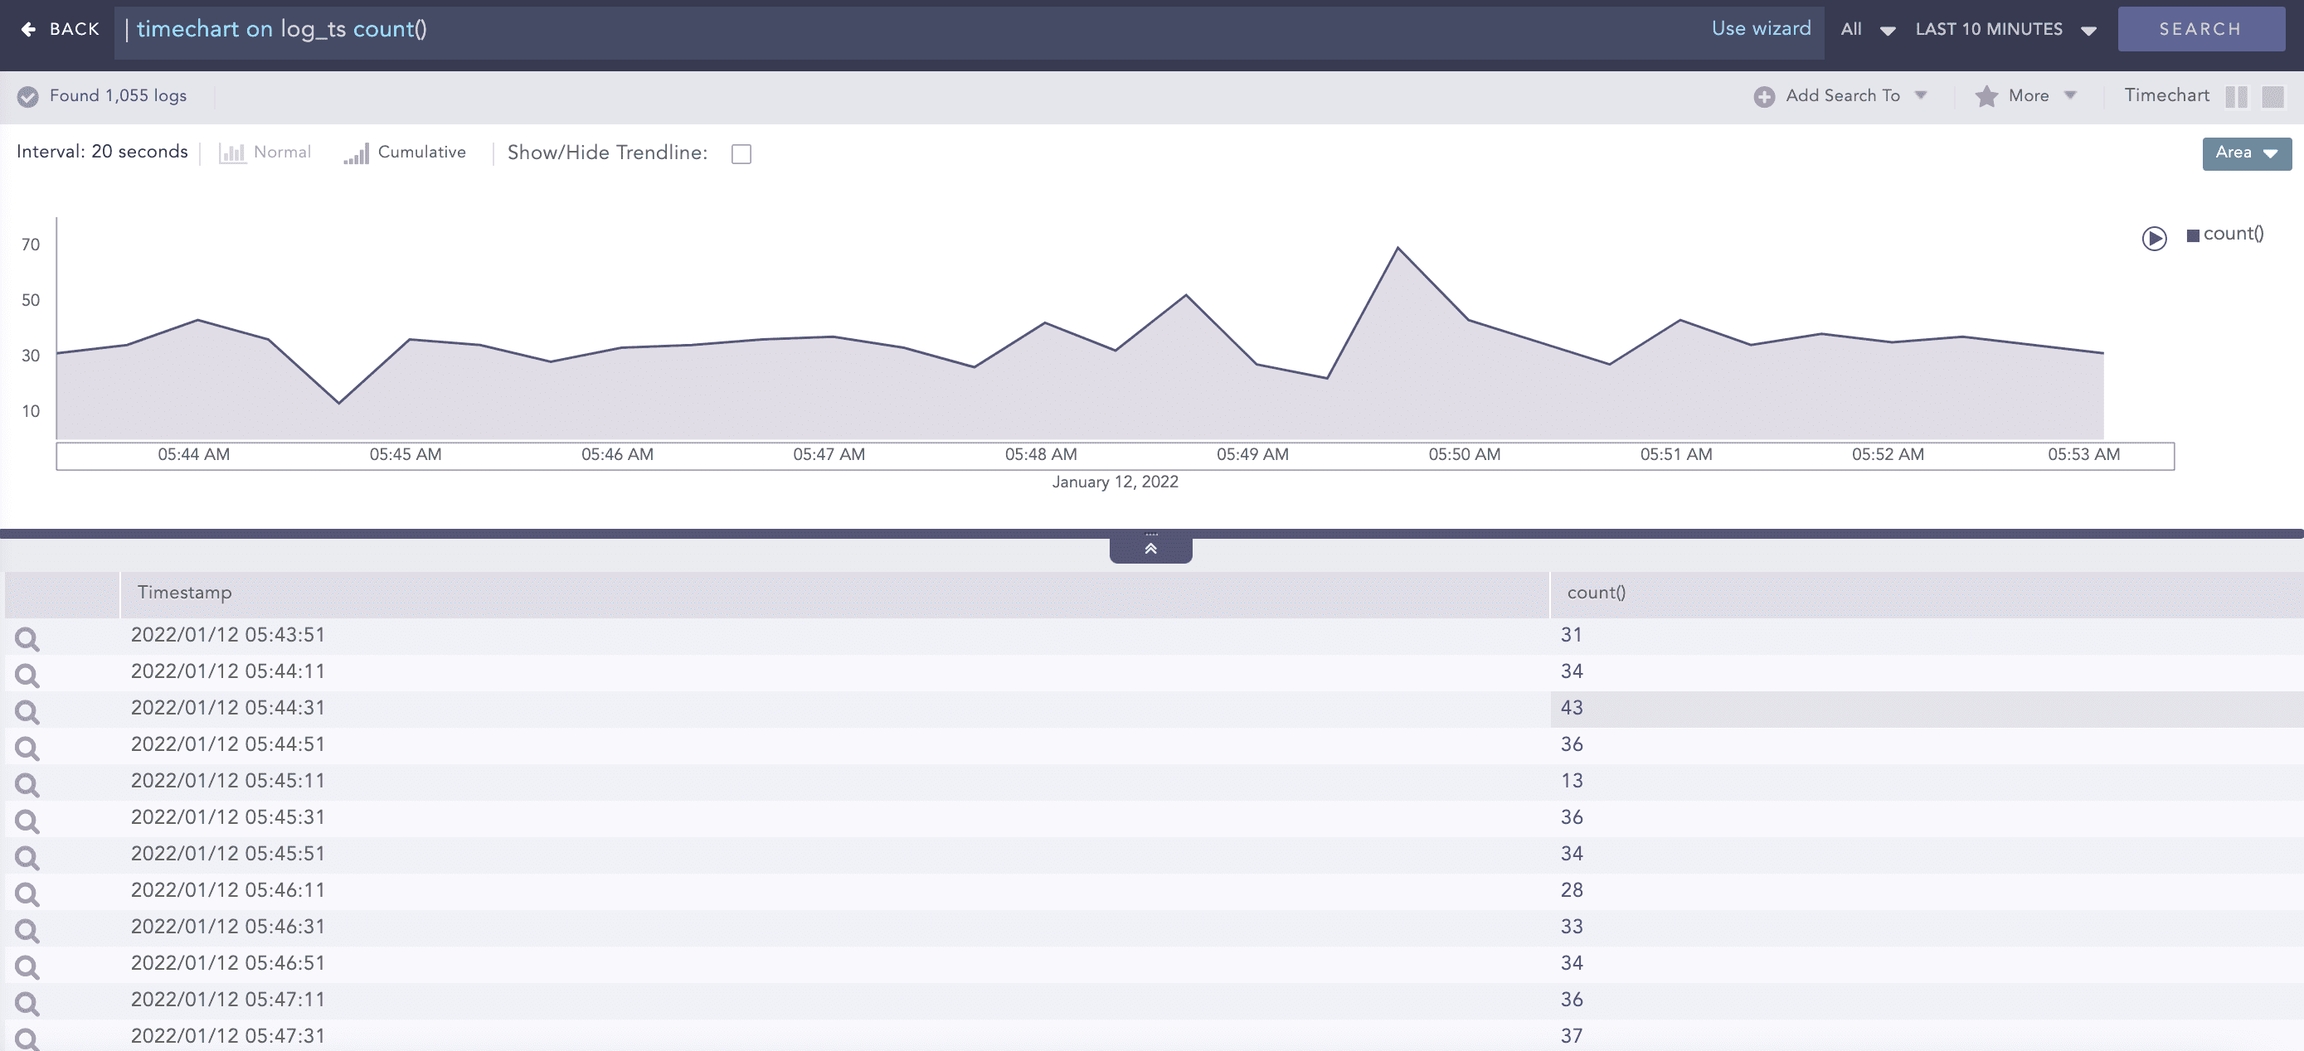
For example, you can timechart all the logs with login shown below.
This plots the count of all the logs containing the word login into a graph with the horizontal axis as time. The total time span is the time selected for the search query.
This query plots the count of logs by the log_ts field.
You can also use the timechart command to plot the data on a fixed time interval. To have a timechart with bars for every 20 minutes, use the following query:
You can use every x minutes, every x hours, or every x days with the timechart.
When the limit of the timechart() is not specified, the number of bars of the timechart depends on the nature of the query.
The number is always equal to 30 if the time range is less than 30 units. For example, if you set a 10-minute time range, Logpoint displays 30 bars over 20 seconds.
If the time range is greater than 30 units, the number of bars is equal to the time range. This holds true until the upper limit of the number of bars is reached, which is 59.
There are also some exceptional cases for the number of graphs. The number of bars is equal to the number of seconds specified, and the time span of 1 day displays 24 bars in the span of one hour.
Available Aggregators
Aggregators are used with the chart and the timechart commands by joining them with the | symbol.
The aggregators are pluggable from Logpoint 5.2.4. This means Logpoint can create such functions on request.
Use +, -, *, /, and ^ to add, subtract, multiply, divide, and to raise the power in the min(), max(), sum(), avg(), and var() functions.
avg()
Use avg() to calculate the average of all the values of the specified field.
When using avg(), apply a filter to exclude logs that do not contain the specified fields.
Example:
This query calculates the average response time.
count()
Use count to get the total number of logs in the search results.
Example:
This query displays the total number of logs in the search results.
This query searches for all logs containing the word login. It then groups the logs by device_ip and shows the count of logs for each device_ip.
You can also pass filters to count(), as:
This query searches for all logs containing the word "login". It then groups them by device IP and shows the count of logs with the event_id = 528 field value.
If logs are present in the repo but do not match the query when using chart count(), a row with a count of 0 is displayed.
If no logs are available in the repo, the page displays No results found. message.
distinct_count()
Use distinct_count () to get the number of unique values in a list or dataset. It is used to know how many unique elements there are in a particular set of data. If you have a list of users, the distinct count returns the number of unique users, regardless of how many times each user appears in the list.
It is used to identify unique unauthorized access attempts, the activities associated with those attempts, and the measures taken to prevent them.
For example, a sudden increase in the number of unique source-destination IP connections involving uncommon IP addresses might indicate security threats or unauthorized network activity.
In this case, distinct_count() returns the count of the distinct Source_destination regardless of the number of times it appears in the list.
If the search results for Source_destination include the following data, the distinct_count() result for Source_destination is 3.
If there are many unique values in the data, the search can be slow.
Source_destination
Target_destination
10.145.6.78
14.48.7.58
25.7.32.16
14.48.7.58
25.7.32.16
15.6.7.89
90.56.2.156
14.48.7.58
10.145.6.78
15.6.7.89
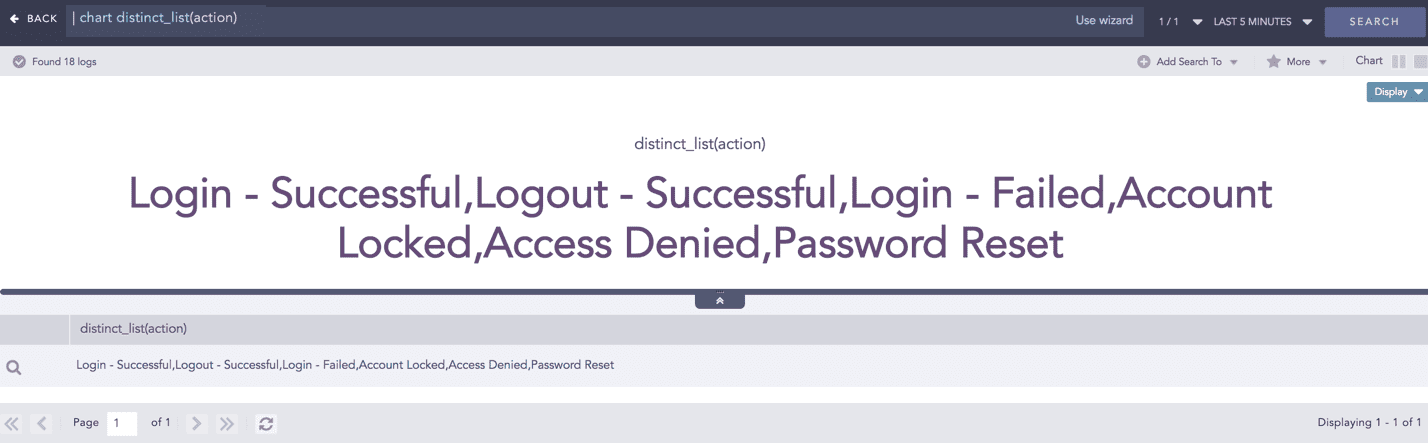
distinct_list()
Use distinct_list() to return the list of all the distinct values of the field.
Example:
To view all the distinct values of the field action in the system, use:
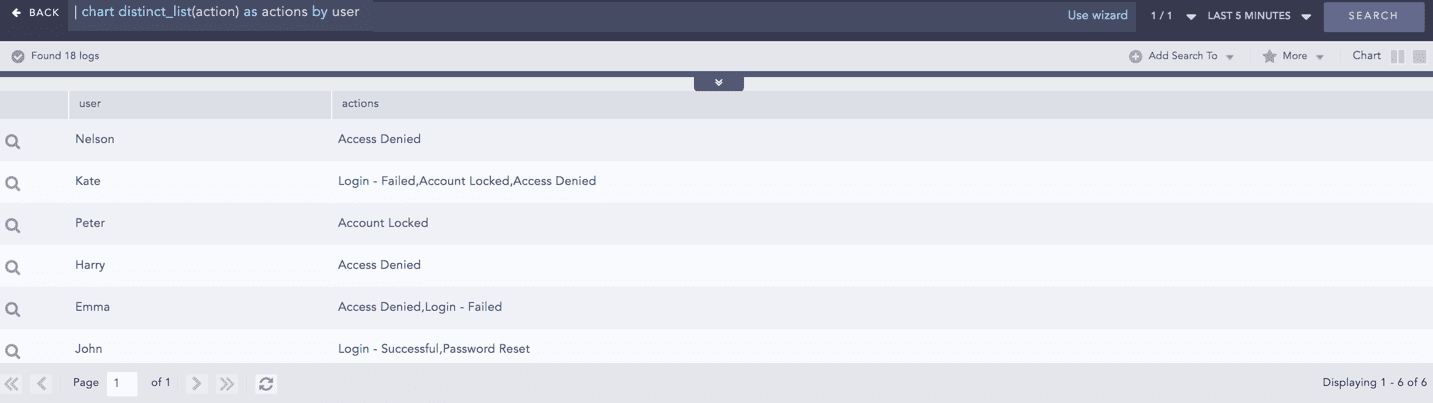
Use a grouping parameter to group the distinct list.
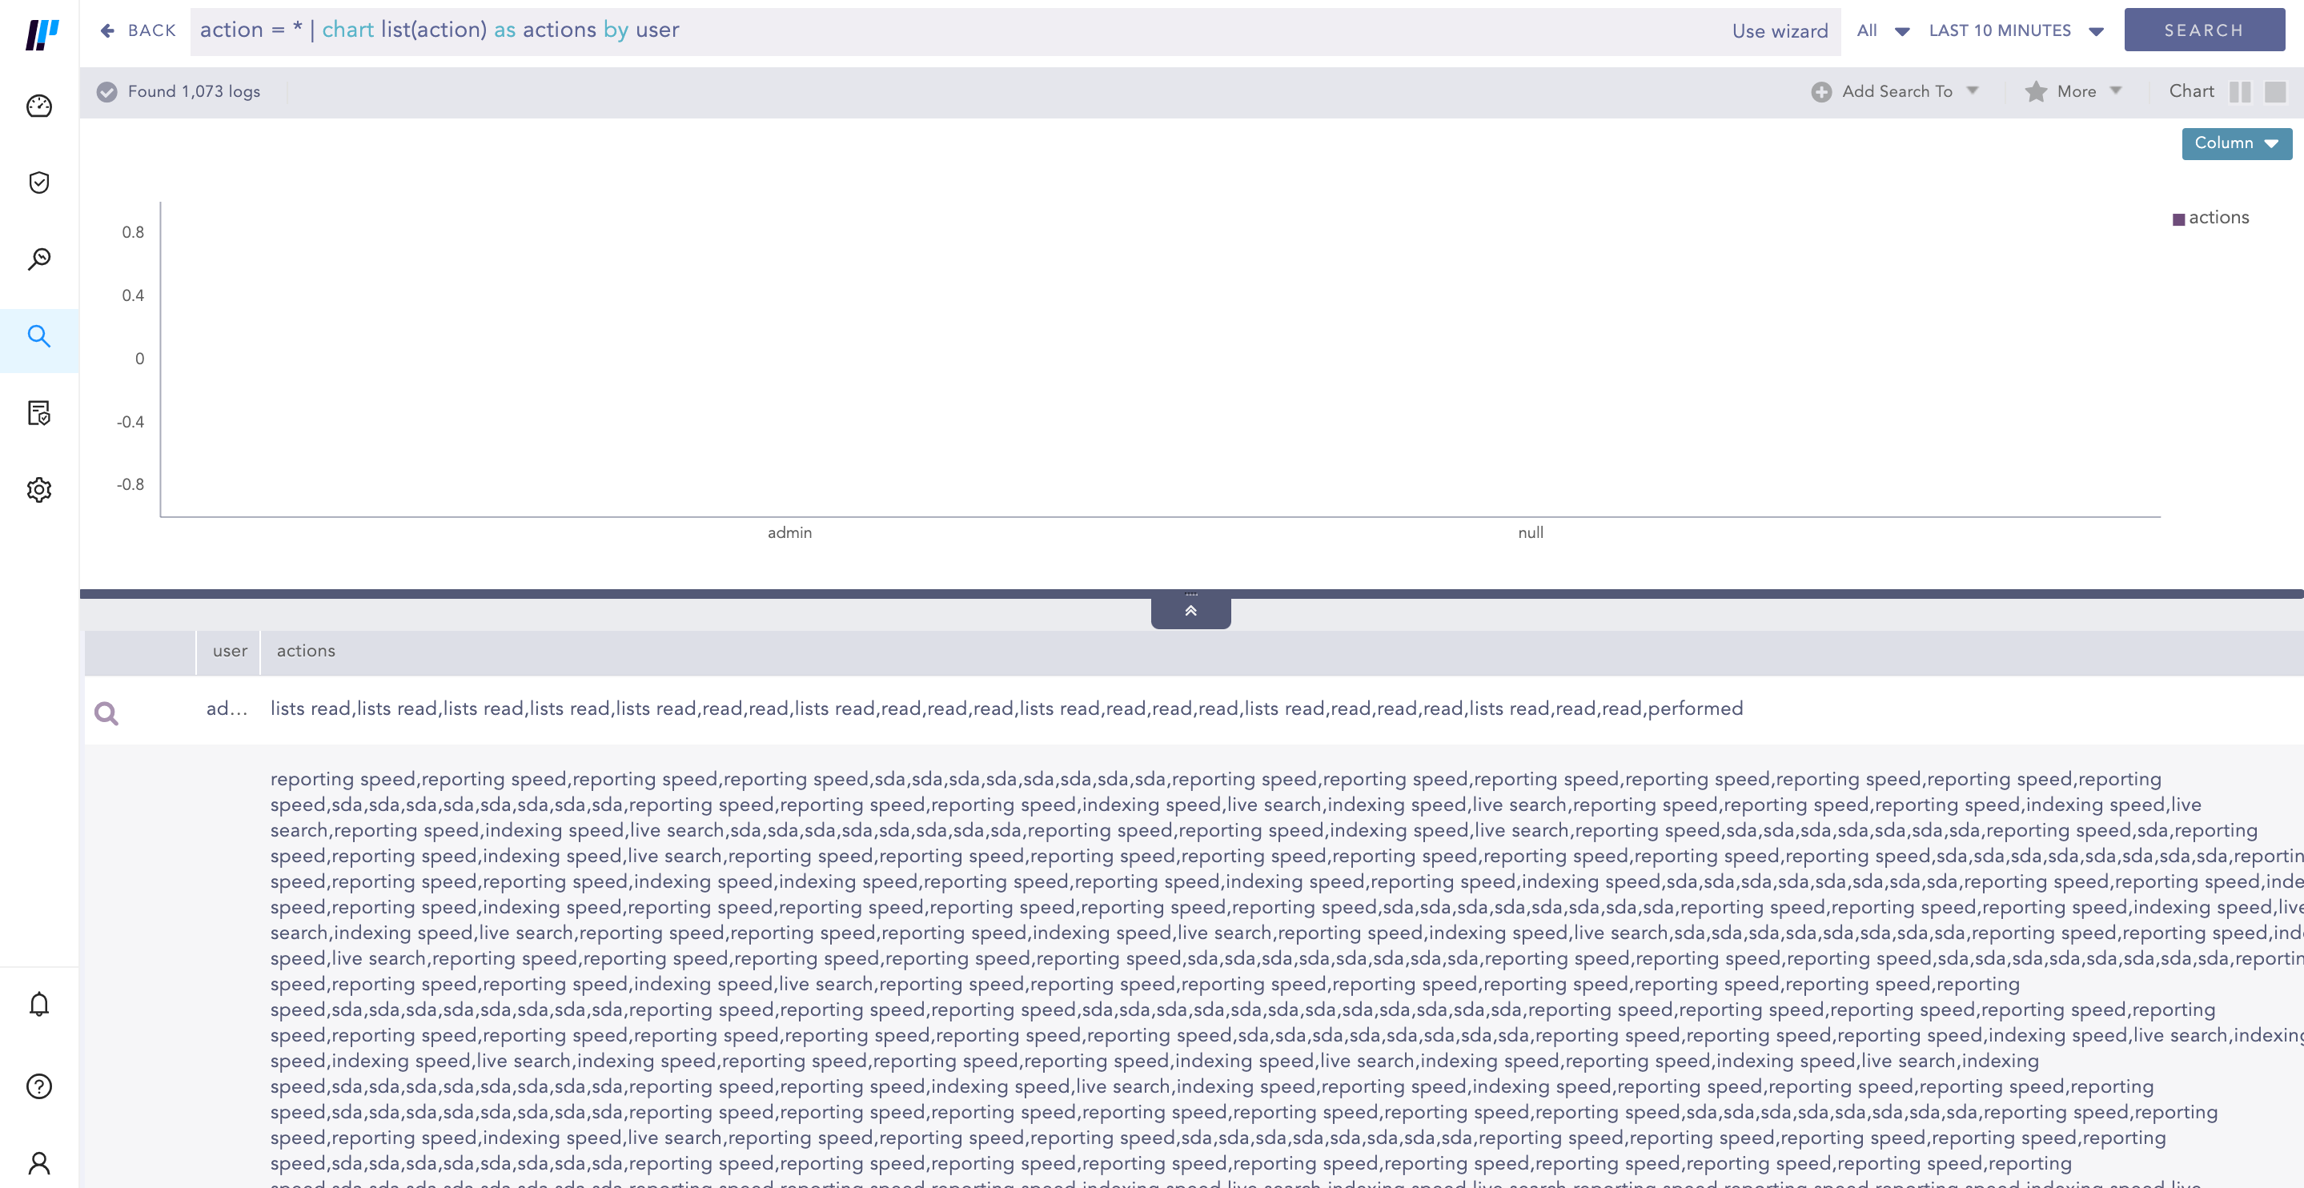
Example:
This query returns a list of all distinct values of the action field in the actions column, grouped by the user grouping parameter. You can use this example to view all the actions performed and machines used by every user in your system.
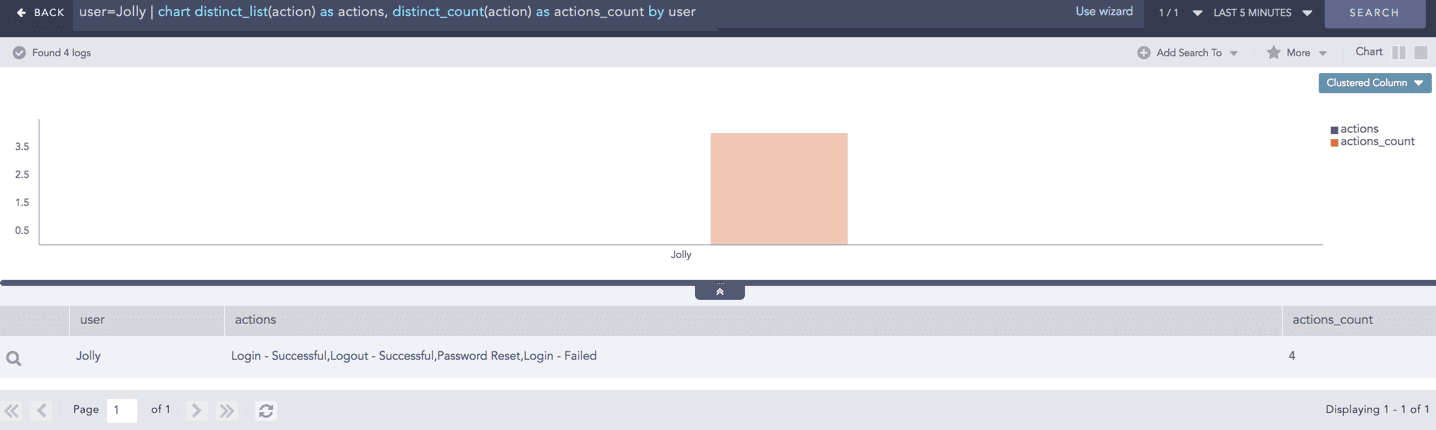
You can also use these aggregators with other aggregation commands.
Example:
This query returns a list of all distinct actions and their counts for the user Jolly.
list()
list() takes a field as a parameter and returns the field values as a list in the search result. The duplicate field values are also included in the list.
Syntax:
Example:
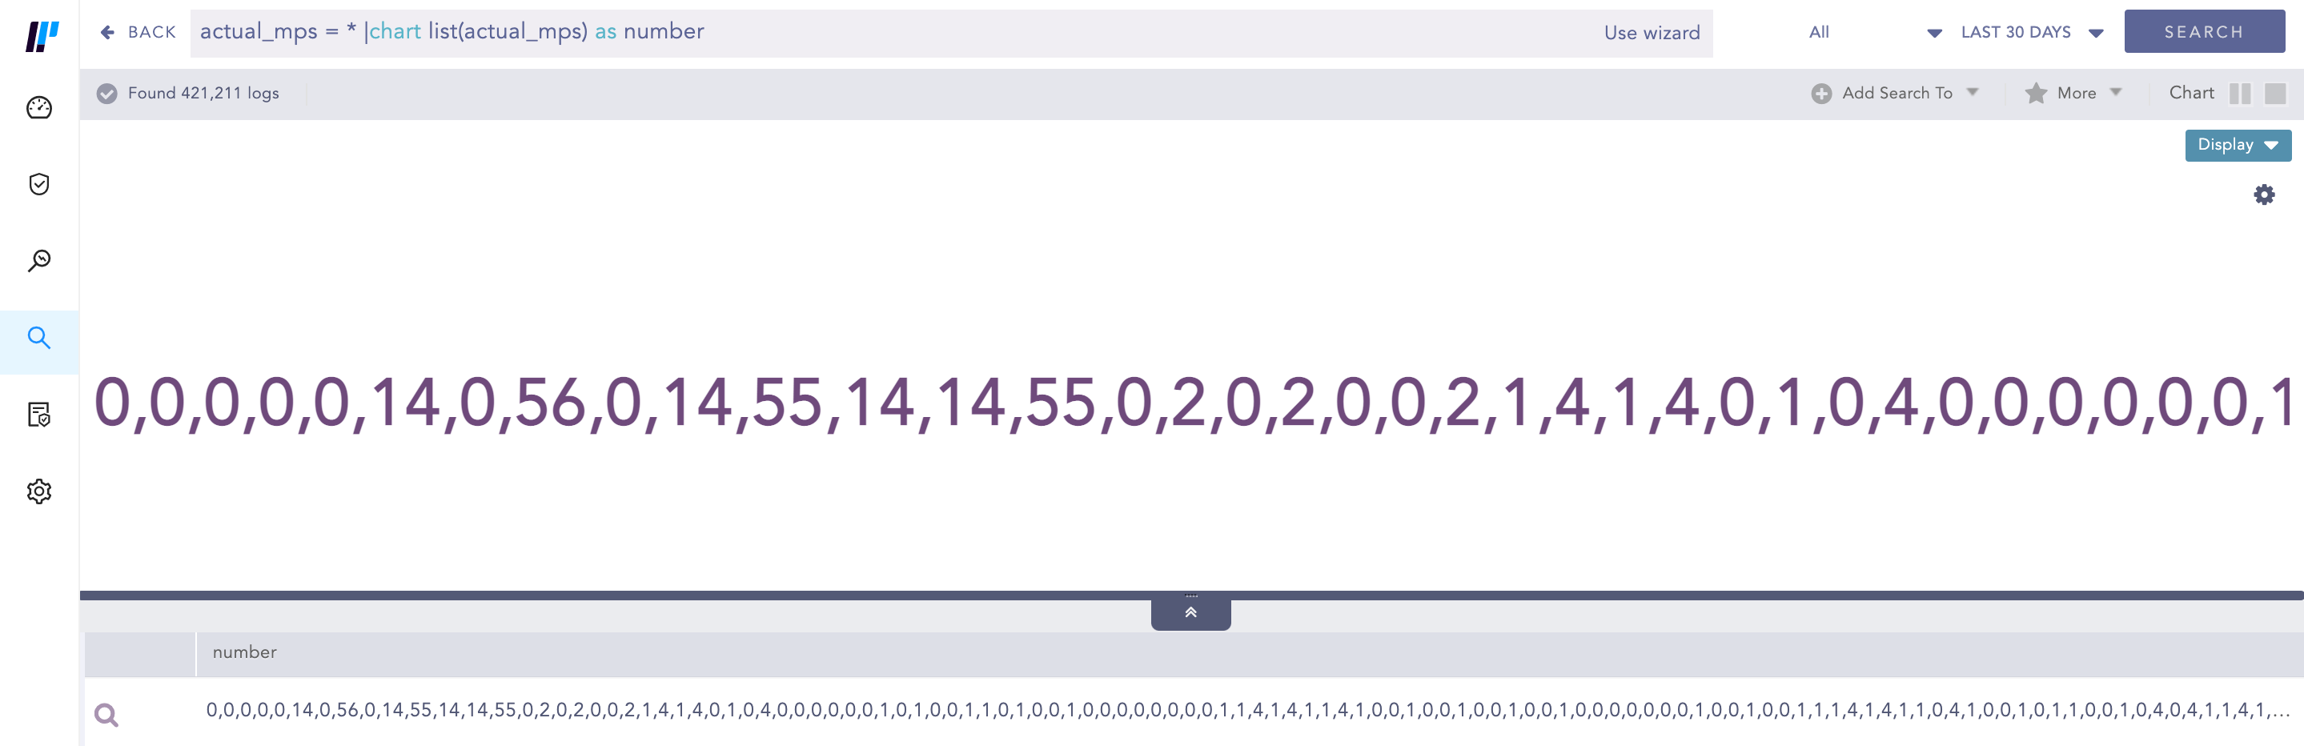
This query returns the list of actual_mps field values and stores it in the number field.
Example:
This query gives the list of the action field values grouped by the user grouping parameter and returns the list in the actions field.
max() and min()
max() and min() aggregators are used to find the maximum or minimum value of a specified field.
When using avg(), apply a filter to exclude logs that do not contain the specified fields.
Example:
This query displays the maximum severity value for each device_ip.
Example:
This query retrieves all logs containing the word "login". Then it groups the search results by device_ips and col_type and shows the log count and the latest col_ts for each group.
The max() and min() also support filter expressions as:
This query shows the maximum severity that is less than 5.
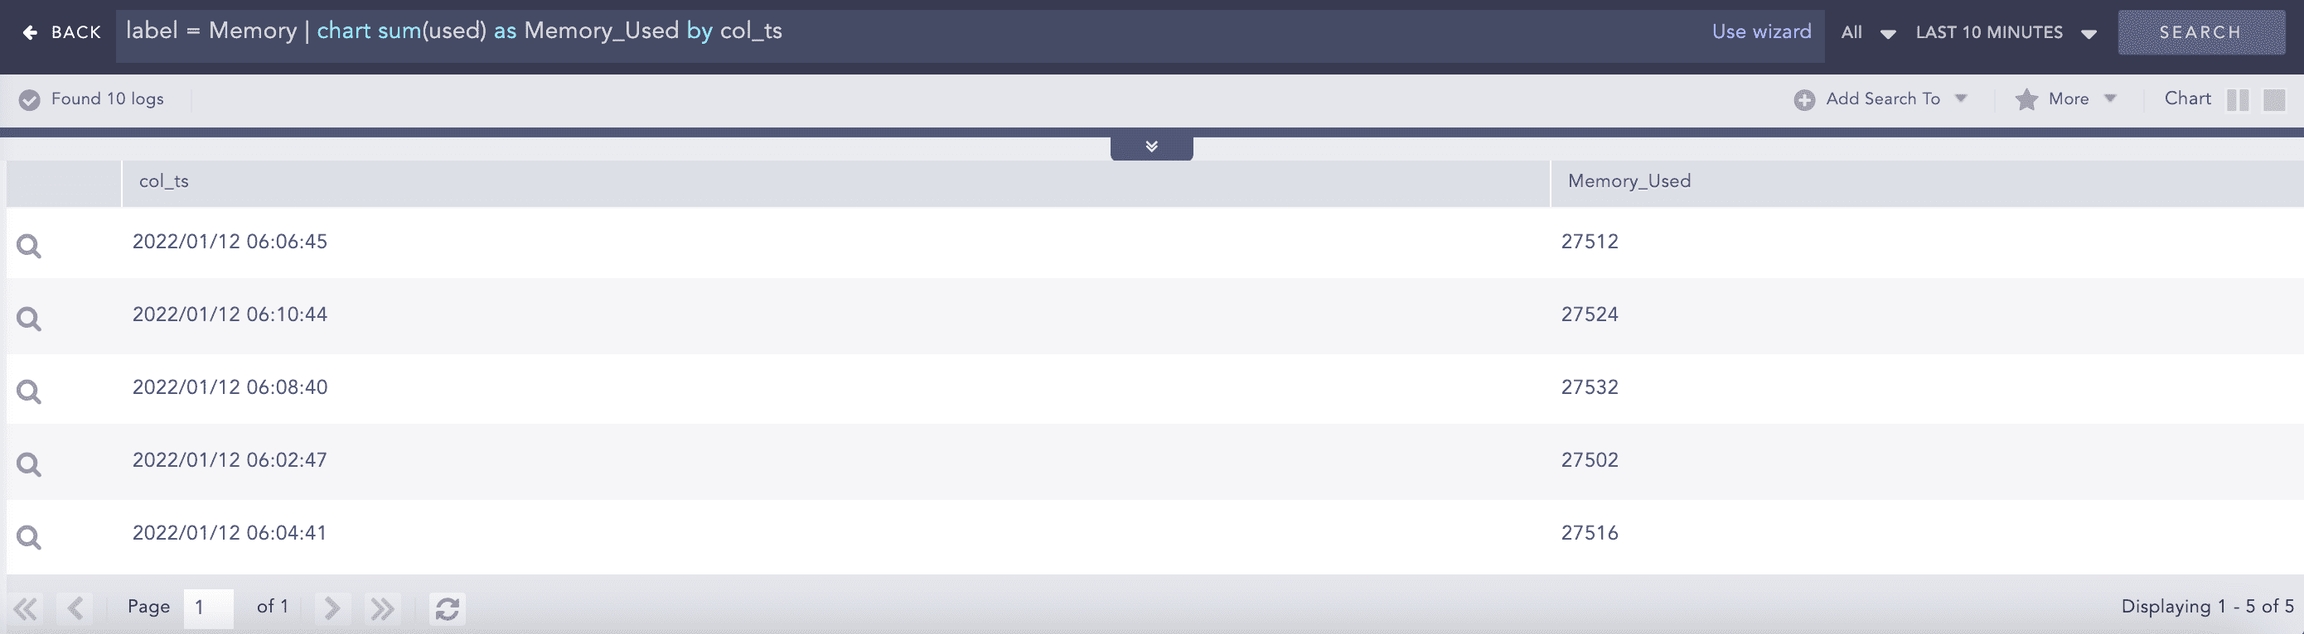
sum()
Use the sum() aggregator to sum the values of specified fields.
Example:
This query displays the sum of all the datasize fields for each device_ip.
You can also give filters to the sum() function.
Example:
This query only sums a datasize if it is greater than 500. The expression can be any valid query string, but must not contain any view modifiers.
var()
Use var() to calculate the variance of the field values. Variance quantifies how far values are spread from the mean.
Execute the following query to visualize how the data fluctuates around the average value.
One-to-One Commands
One-to-one commands take a single input value and return a single output value. They operate on individual logs without changing the number of results returned by a query.
Use one-to-one commands to extract or transform data within logs during a search. For example, the rex and norm commands extract specific parts of a log and assign them to ad-hoc field names. This enables search-time normalization, allowing you to work with structured values without modifying the underlying data. The rex and norm commands do not filter logs. They list all logs returned by the query and, if possible, add the specified ad hoc key-value pairs.
Using the rex and norm commands or the msg field on large volume of logs may severely impact system performance. If a field you are processing already contains the required information and only needs further processing, we recommend you use norm on or rex on instead.
rex
Use the rex command to recognize regex patterns in the re2 format. The extracted variable is retained only for the current search scope. The result also shows the logs that do not match the rex expression.
Example Log:
Oct 15 20:33:02 WIN-J2OVISWBB31.immuneaps.nfsserver.com MSWinEventLog 1 Security 169978 Sat Oct 15 20:33:01 2011 5156 Microsoft-Windows-Security-Auditing N/A N/A Success Audit WIN-J2OVISWBB31.immuneaps.nfsserver.com Filtering Platform Connection The Windows Filtering Platform has allowed a connection. Application Information: Process ID: 4 Application Name: System Network Information: Direction: Inbound Source Address: 192.168.2.255 Source Port: 138 Destination Address: 192.168.2.221 Destination Port: 138 Protocol: 17 Filter Information: Filter Run-Time ID: 67524 Layer Name: Receive/Accept Layer Run-Time ID: 44 169765
Use the rex command to extract the protocol ID into a field protocol_id with the following syntax:-
The query format is similar to the following:
The (?P< >) expression is part of the rex syntax to specify the field name.
You can also extract multiple fields from a single rex operation as shown below.
The extracted values can be used to chart your results. For example,
Since the rex command acts on the search results, you can add it to a query string as shown below:
norm
Use the norm command to extract variables from the search results into a field. It supports both normalization syntax and re2 syntax.
Example Log:
Dec 17 05:00:14 ubuntu sshd[7596]: Invalid user Bob from 110.44.116.194
To extract the value of the user into the field user, use:
This can also be used to chart the graph as follows:
You can also use the norm command to extract multiple key-value pairs, as:
If you are using square brackets ([,]) in a search command, wrap them in single quotes (’) to escape them, as they are reserved for stream syntax in correlation queries.
Example:
| norm on user <my_user:'['A-Z']'> | chart count() by my_user
However, to extract the literal square bracket from the log, use signatures.
Refer to the List of Definers for the built-in regex syntax available in norm commands.
fields
Use the fields command to display the search results in a tabular form. The table is constructed with headers according to the field names you specify. Logpoint returns null if the logs do not contain the specified fields.
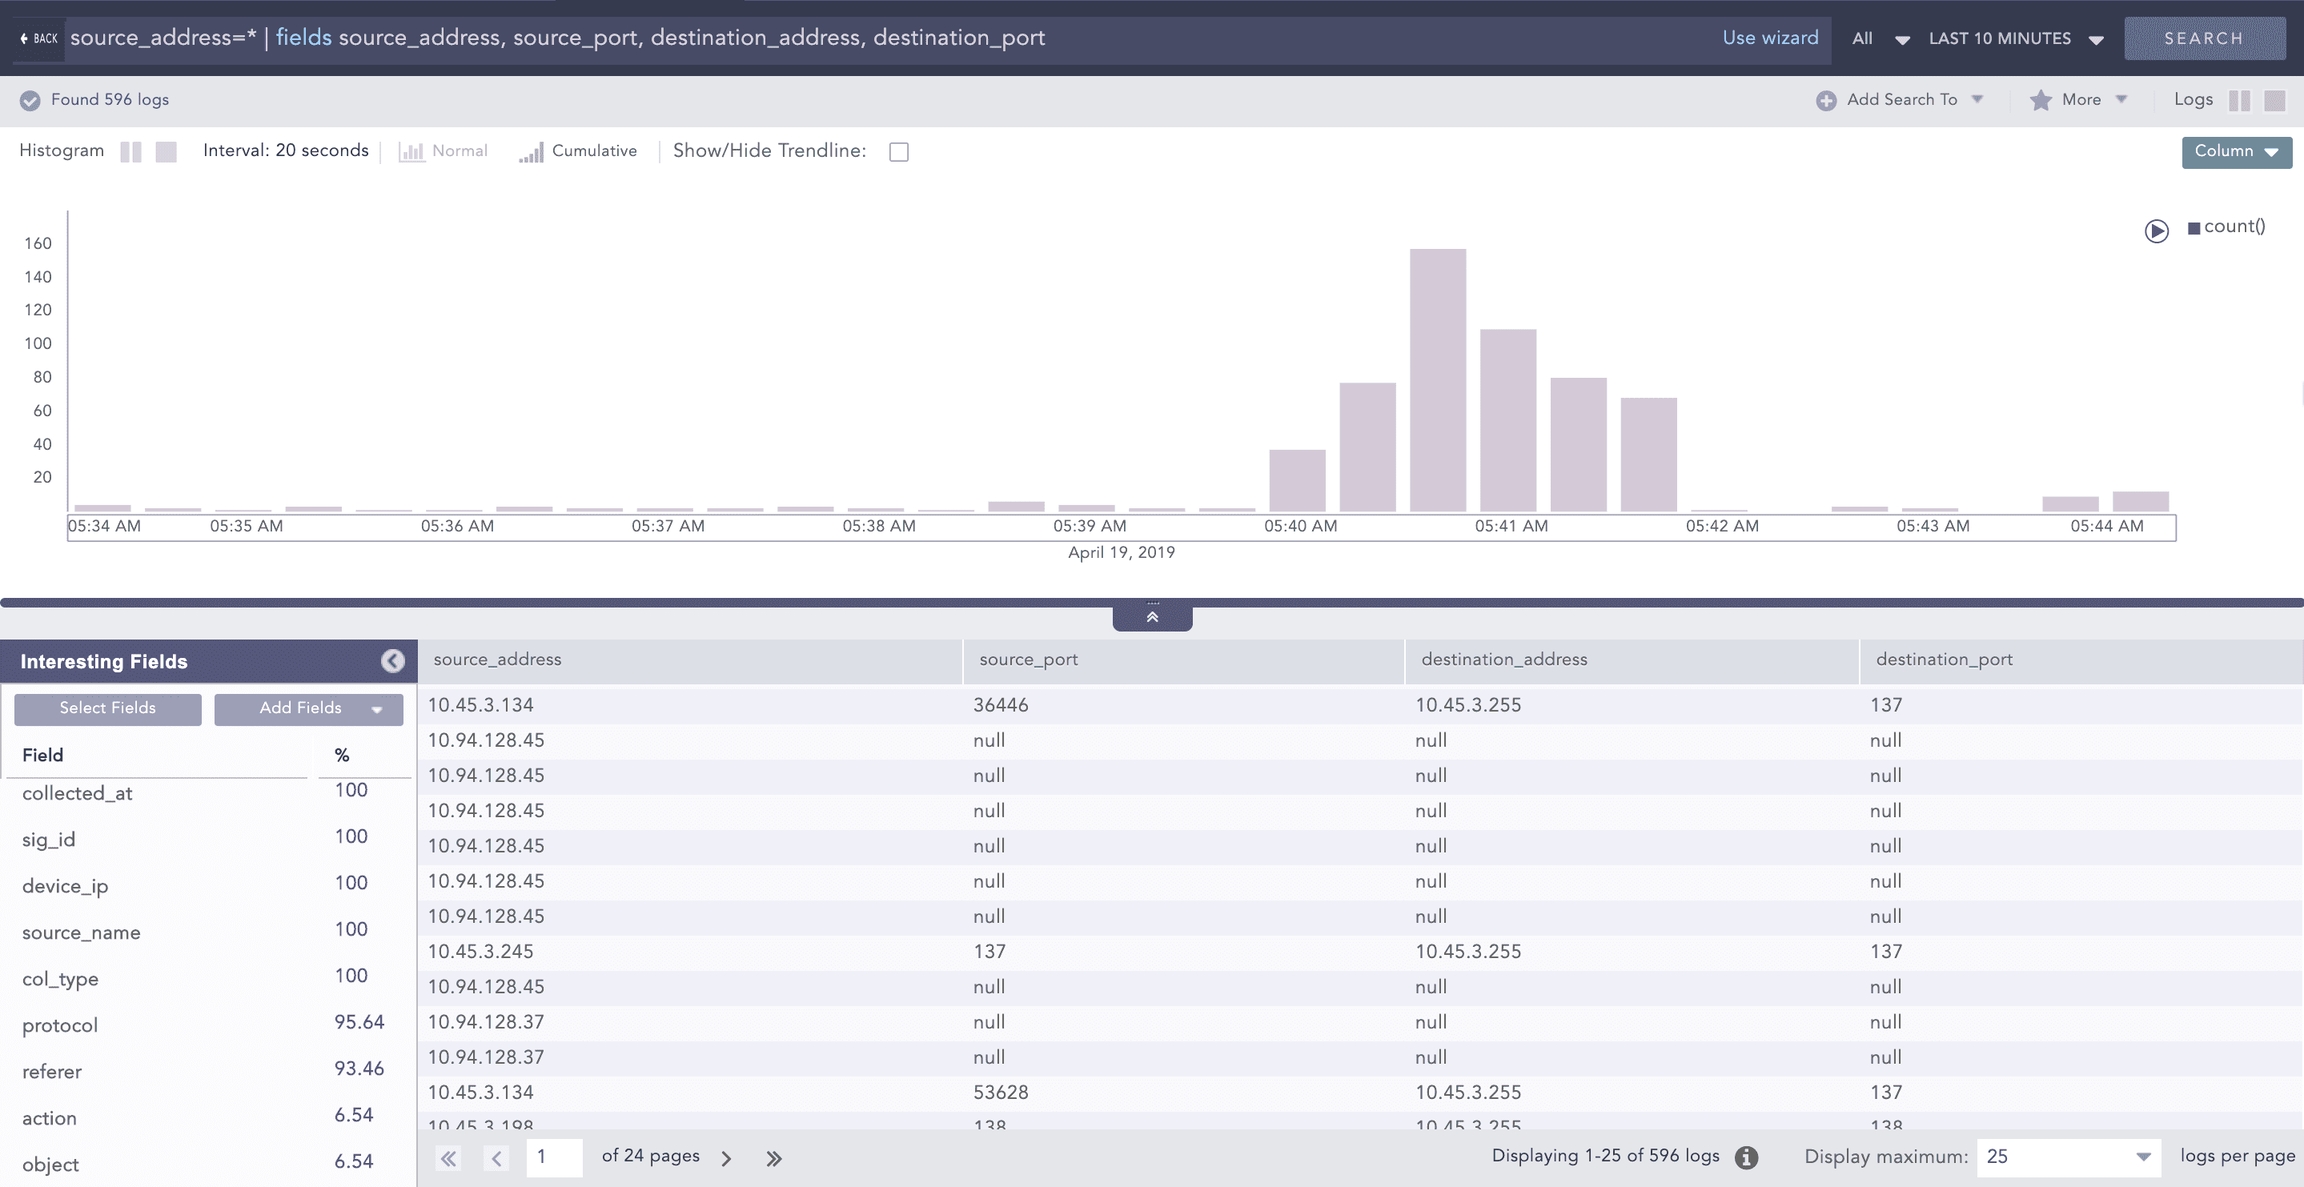
Here, the fields source_address, source_port, destination_address, and destination_port are displayed in a tabular form as shown above. Any logs without the destination_port field have a corresponding row with the destination_port column value set to -N/A-.
rename
Use the rename command to rename the original field names.
Example:
When multiple fields in a log share the same name, the rightmost field takes precedence, and only that field is renamed.
Example:
Here, if both the source_address and destination_address fields are present in a log, only the destination_address field is renamed as ip in search results.
The logs after normalization may have different field names for information that carries similar values. For example, different logs may have name, username, u_name, or user_name as keys for the same field username. To aggregate all the results and analyze them properly, you can use the rename command.
In some cases, the field names can be more informative with the use of rename command as below:
Process Commands
Use the process command to execute different one-to-one functions that produce a single output for a given input.
AsciiConverter
Converts hexadecimal (hex) value and decimal (dec) value of various keys to their corresponding readable ASCII values. It supports the Extended ASCII Table for processing decimal values.
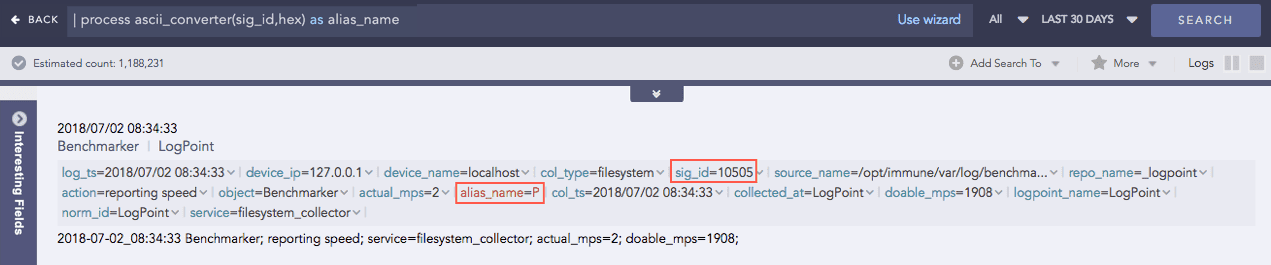
Hexadecimal to ASCII
Syntax:
Example:
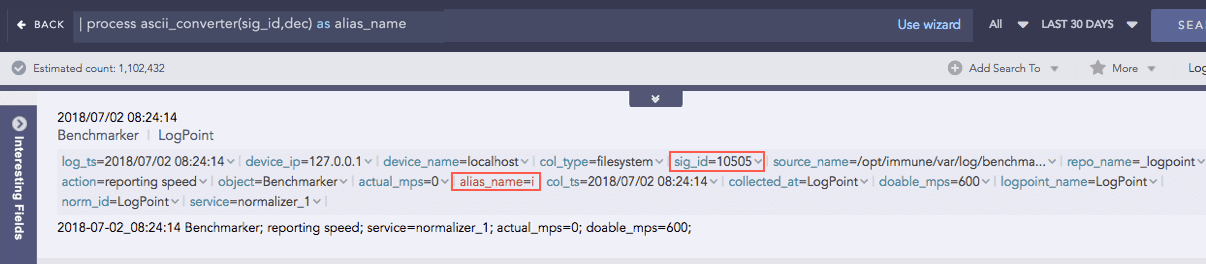
Decimal to ASCII
Syntax:
Example:
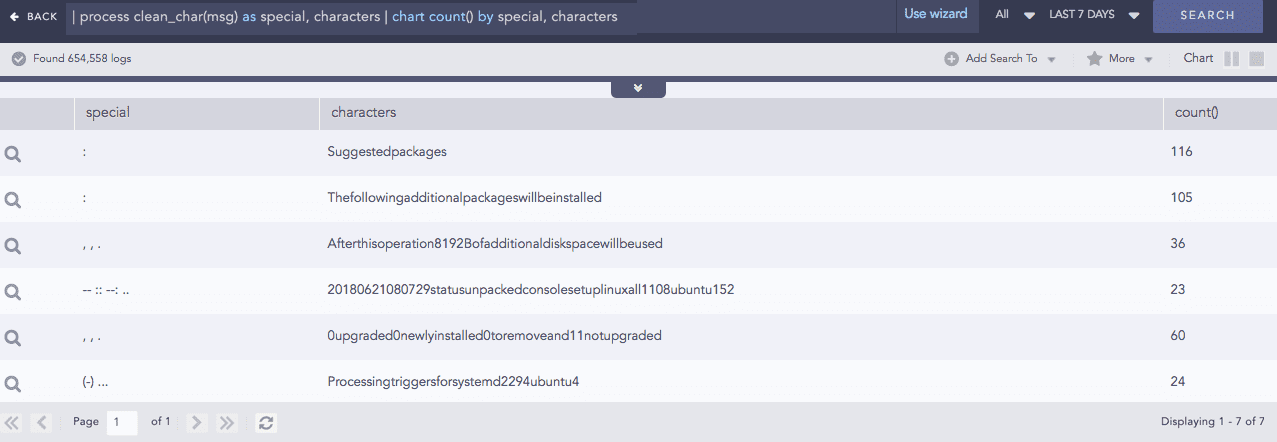
Clean Char
Removes all the alphanumeric characters present in a field-value.
Syntax:
Example:
Codec
A codec is a compression technology that includes an encoder to compress files and a decoder to decompress them. This process command encodes field values as ASCII characters or decodes ASCII characters back into their text using Base64 encoding/decoding. Base64 encoding converts binary data into text format so a user can securely handle it over a communication channel.
Syntax:
Example:
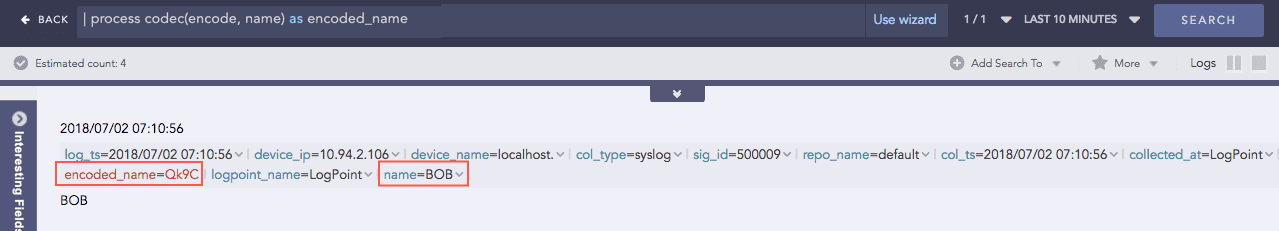
Here, the “| process codec(encode, name) as encoded_name” query encodes the value of the name field by applying the encode function and displays the encoded value in encoded_name.
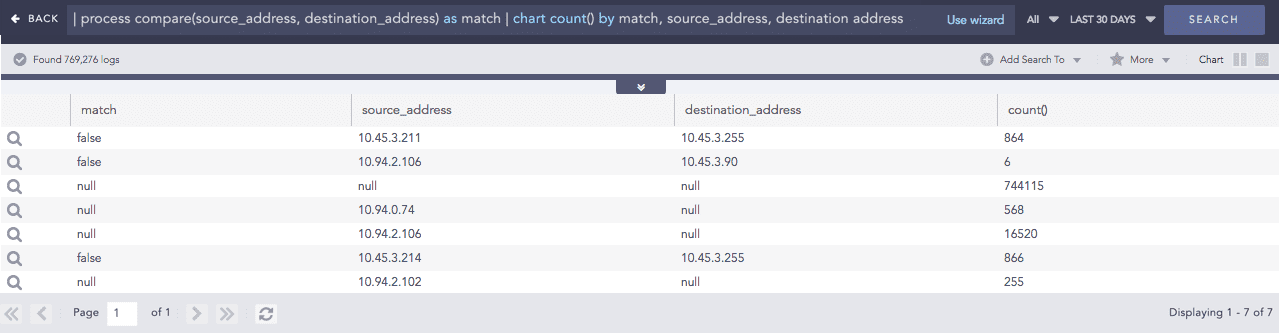
Compare
Compares two values to determine whether they match.
Syntax:
Example:
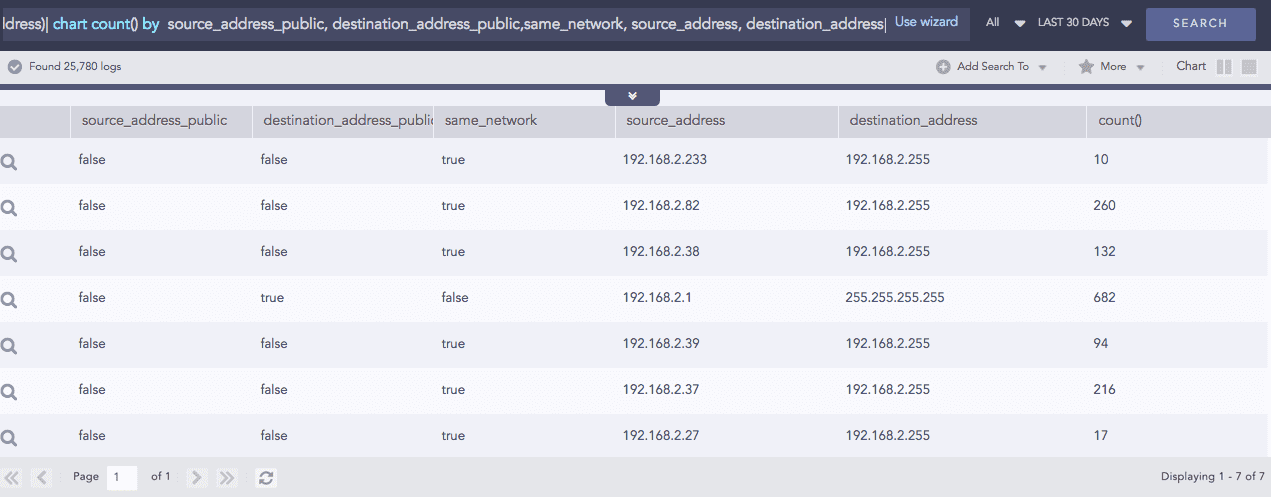
Compare Network
Takes a list of IP addresses as input and checks whether they are on the same network or on different networks. It also checks whether the networks are public or private. The comparison is performed using either the default or the custom CIDR values.
Syntax:
Example: (Using default CIDR value)
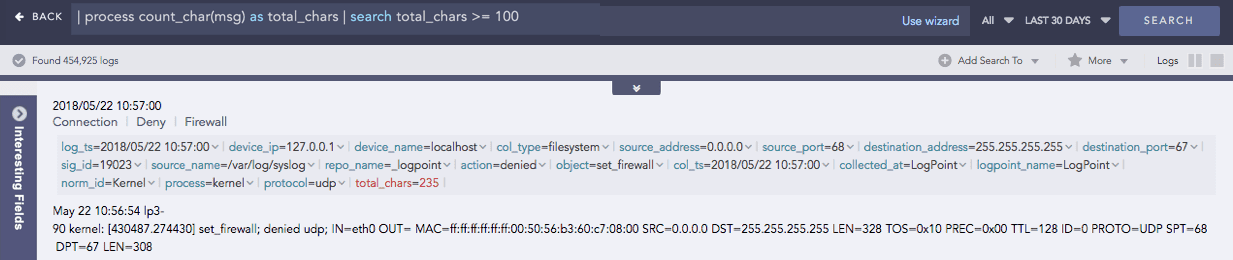
Count Char
Counts the number of characters present in a field-value.
Syntax:
Example:
CountOf
Takes a field as a parameter and counts the number of times the element(s) occurred in the field’s value.
Syntax:
Here, the source and search parameters are required.
Example:
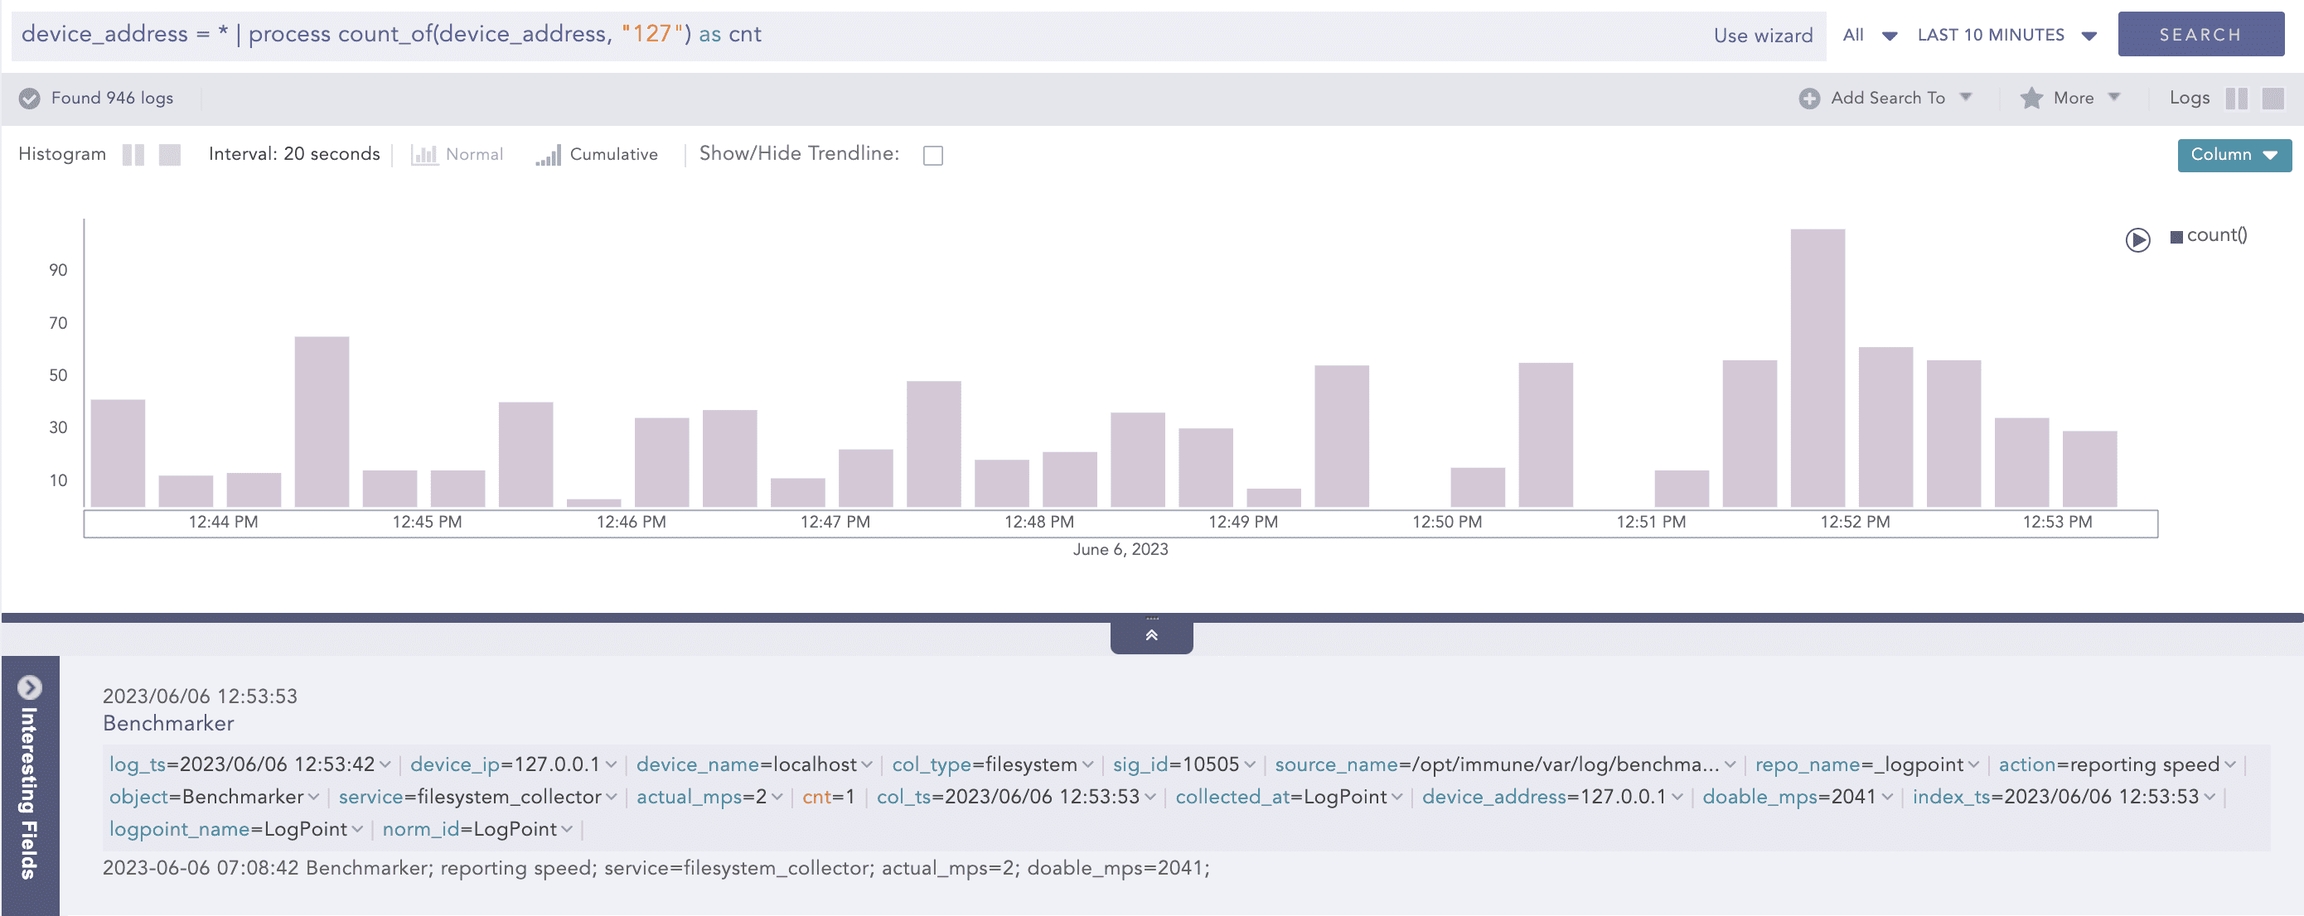
Here, the query counts the occurrences of the 127 string in the device_address field value and displays it in cnt.
Example:
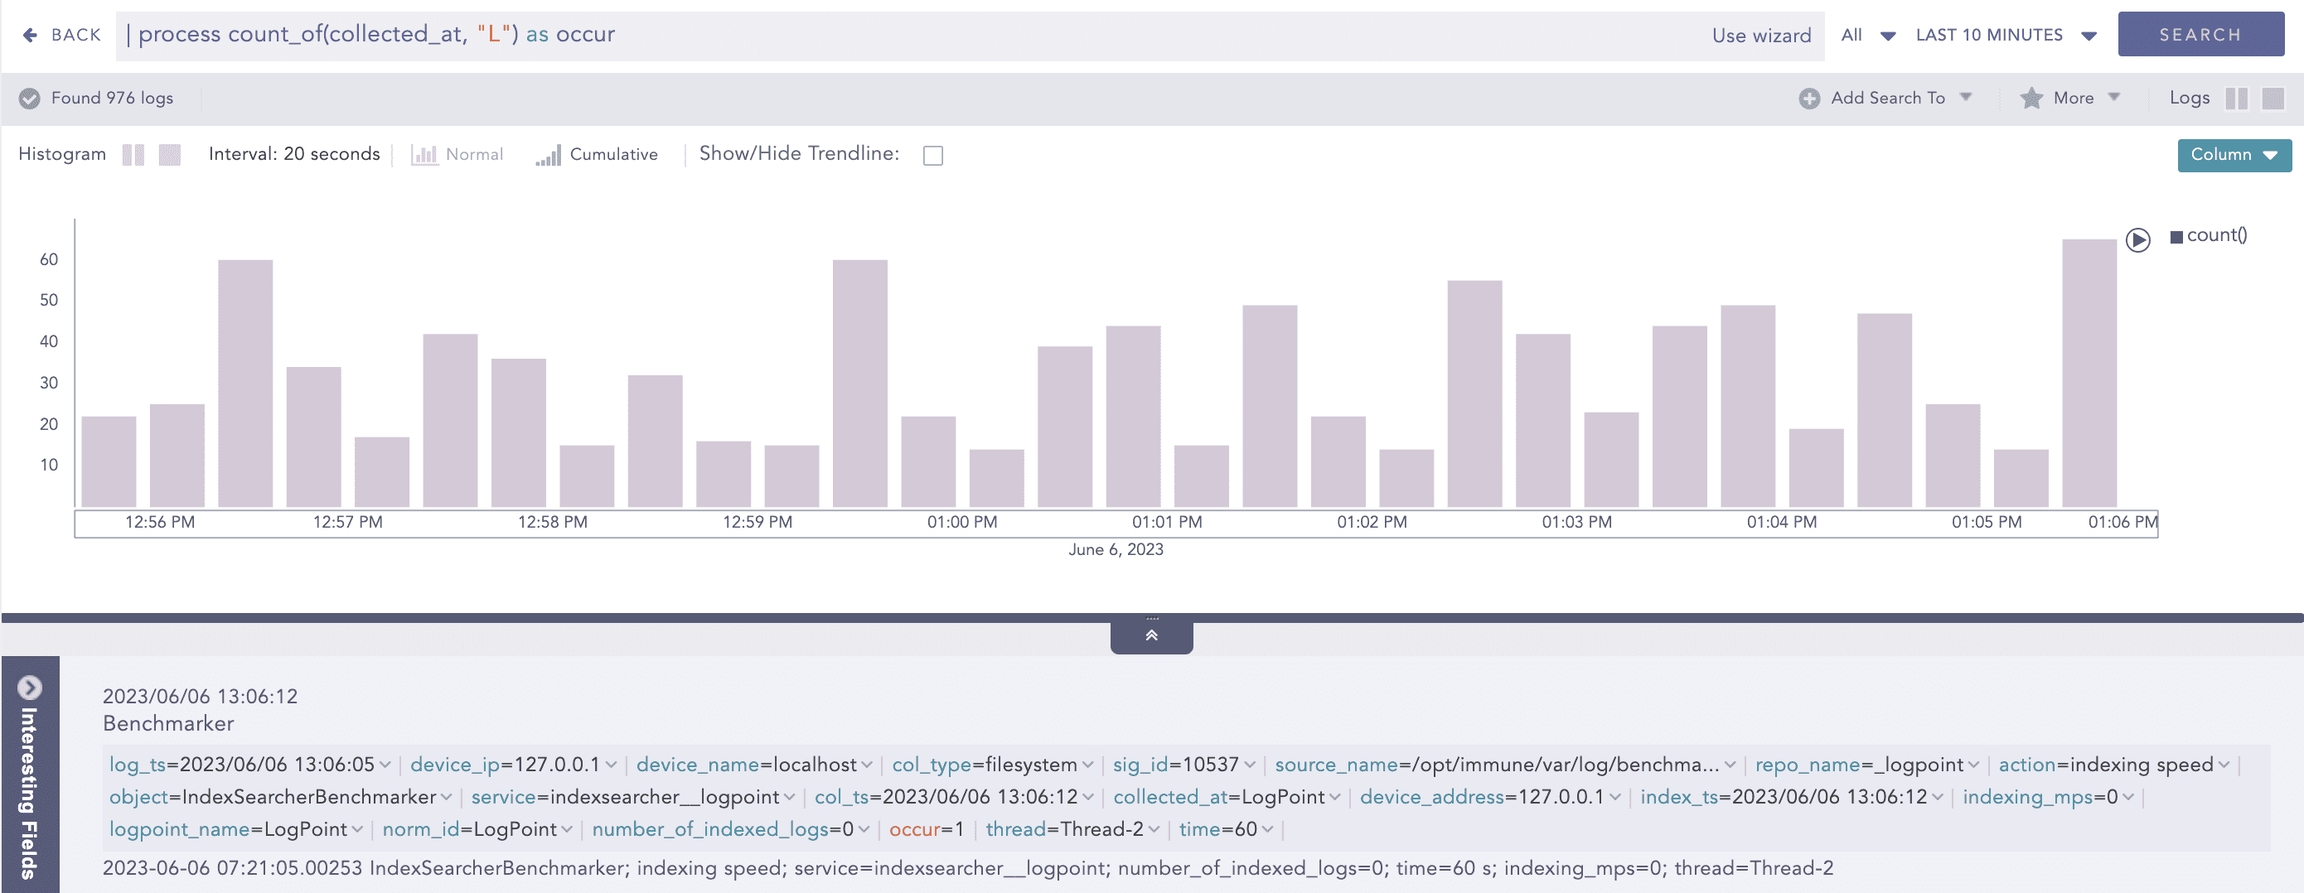
Here, the query counts the occurrences of L string in the value of collected_at field and displays it in occur.
Example:
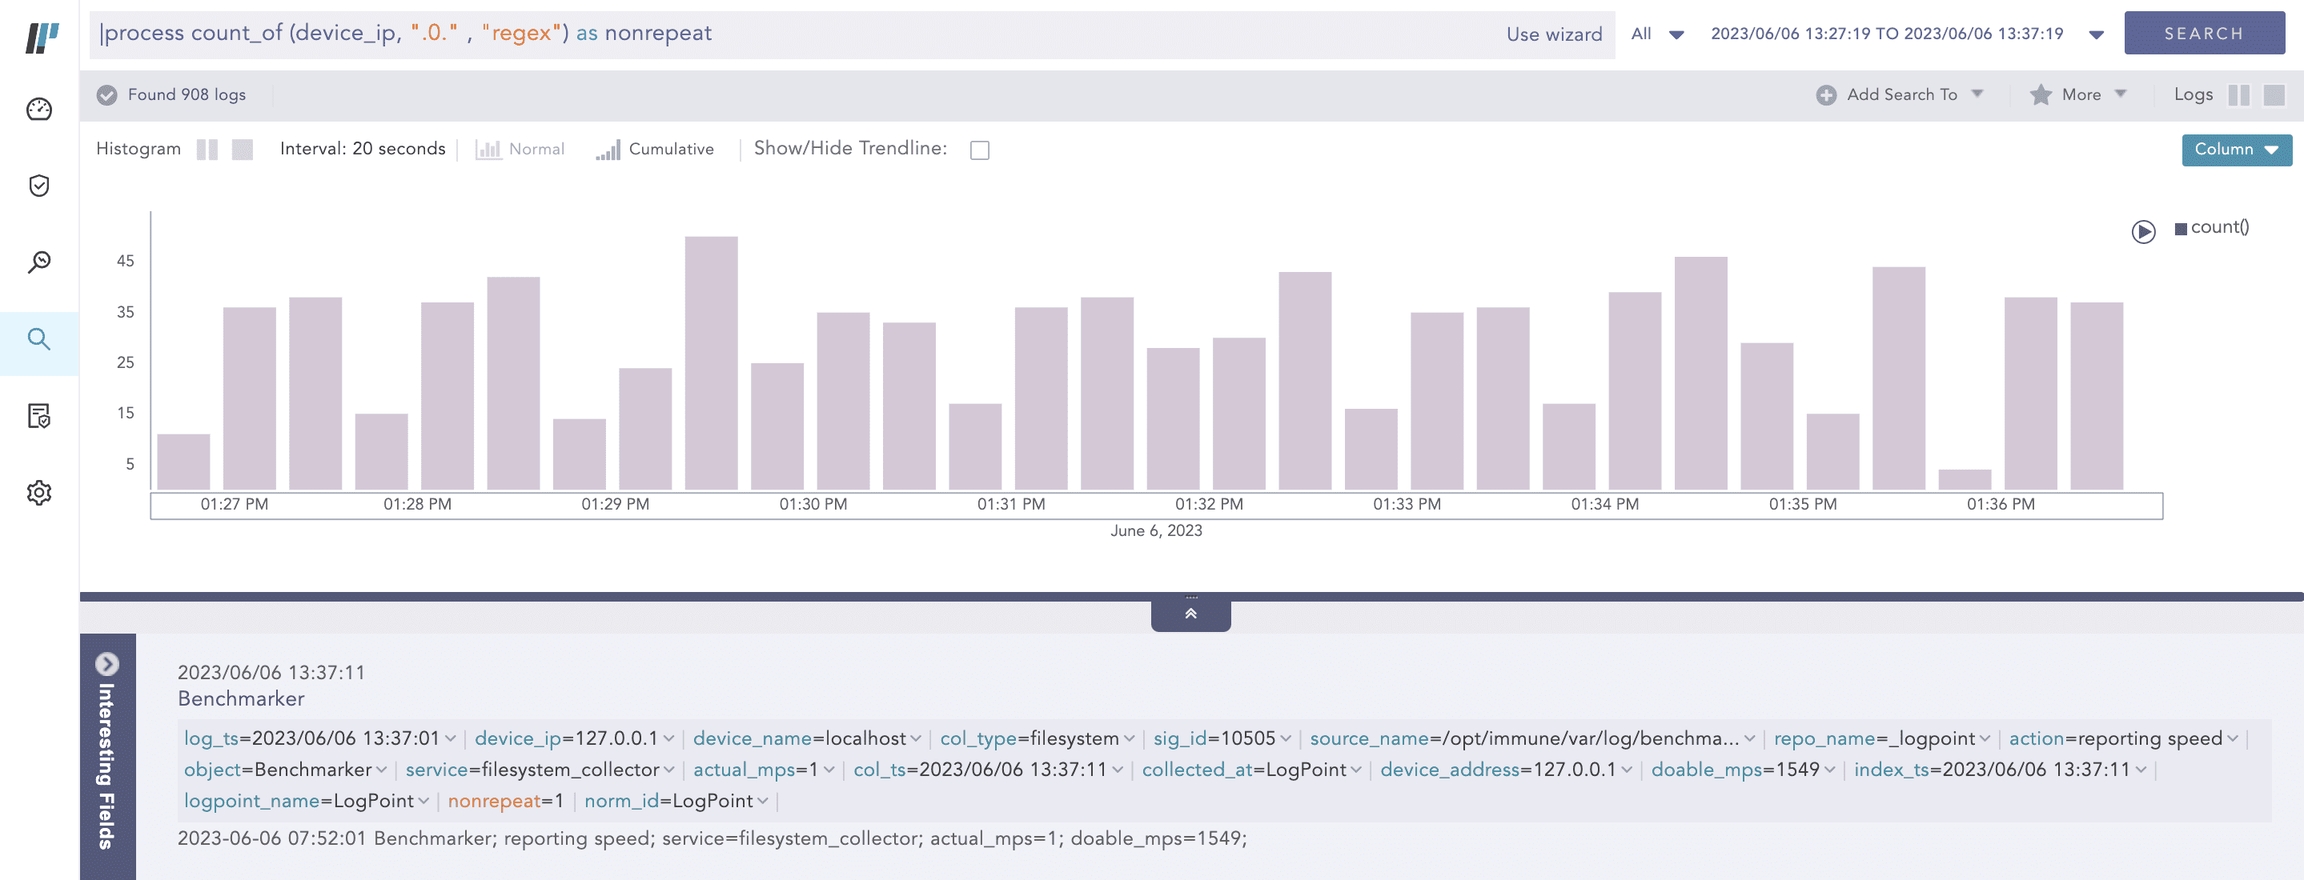
Here, the query counts the occurrence of the .0. string by applying a regex pattern in the value of the device_ip field and displays it in nonrepeat.
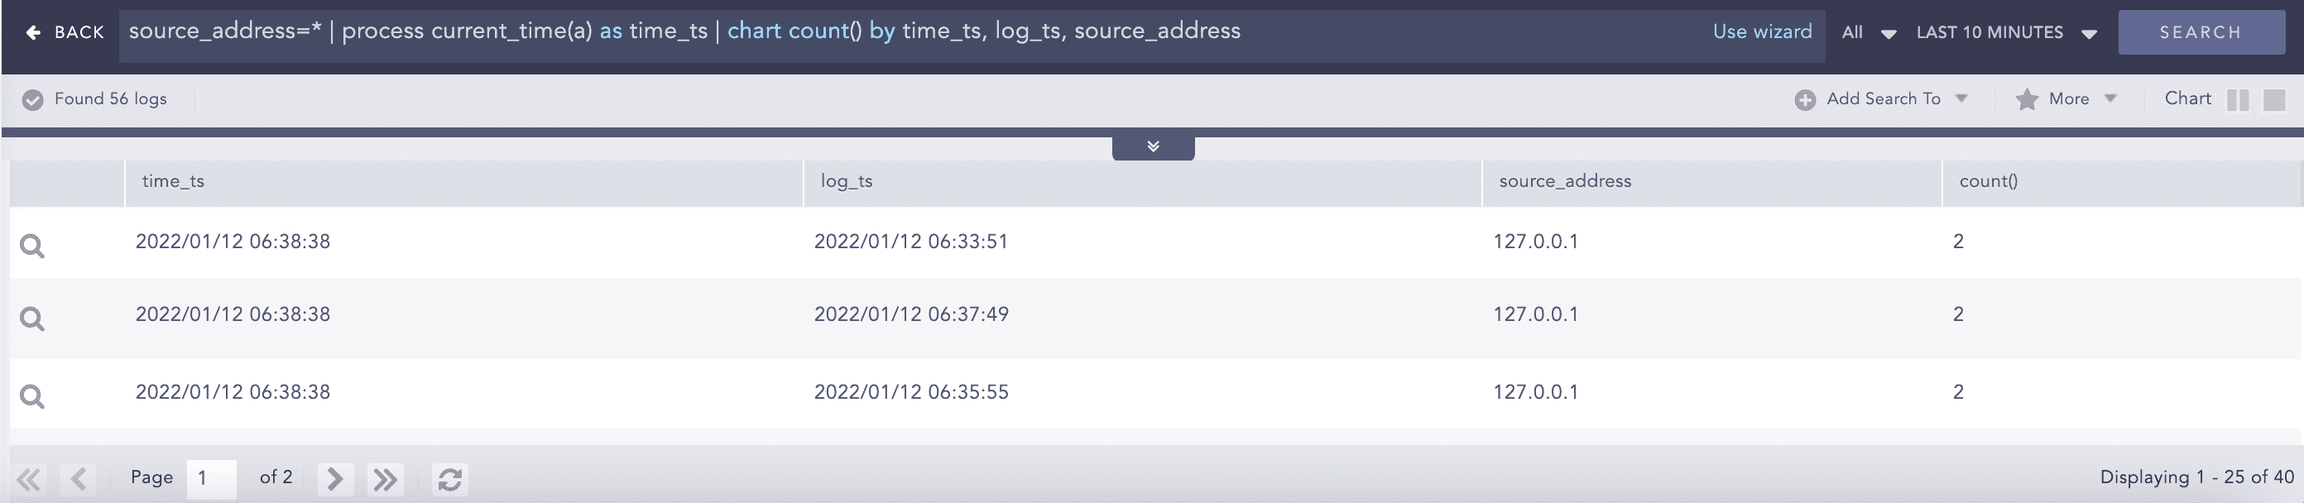
Current Time
Gets the current time from the user and adds it as a new field to all the logs. This information can be used to compare, compute, and operate the timestamp fields in the log message.
Syntax:
Example:
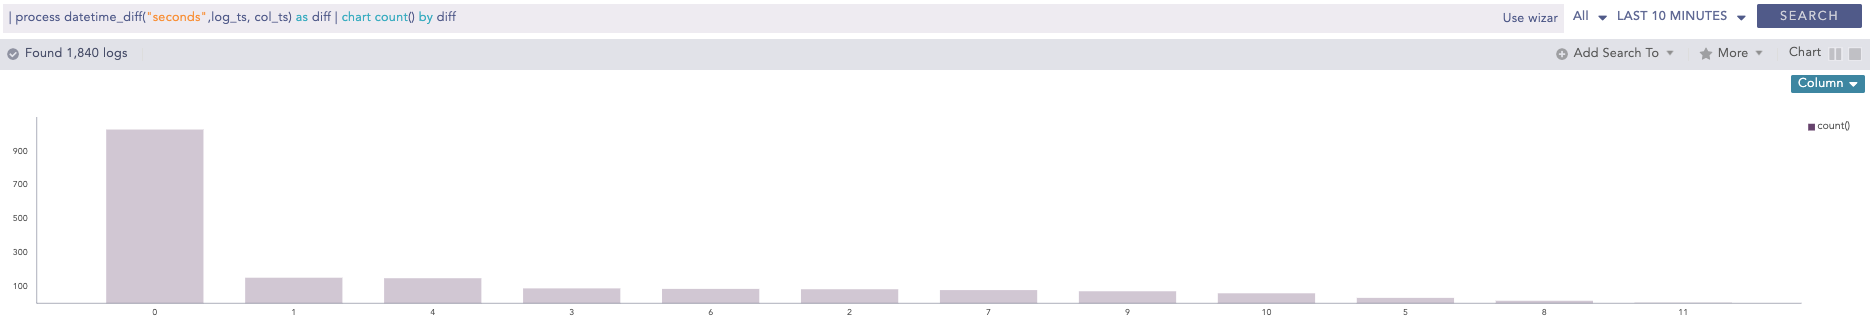
DatetimeDiff
Processes two lists, calculates the difference between them, and returns the absolute value of the difference as the delta. The two lists must contain timestamps. It requires two first and second input parameters that are mandatory and can either be a list or a single field. The third parameter is mandatory and represents the required difference between the two input fields. This difference must be specified in either seconds, minutes or hours. The purpose of the third parameter is to determine how the difference between the two input fields can be represented. For instance, if the difference is specified in seconds, the output will show the absolute difference in seconds.
Syntax:
Example:
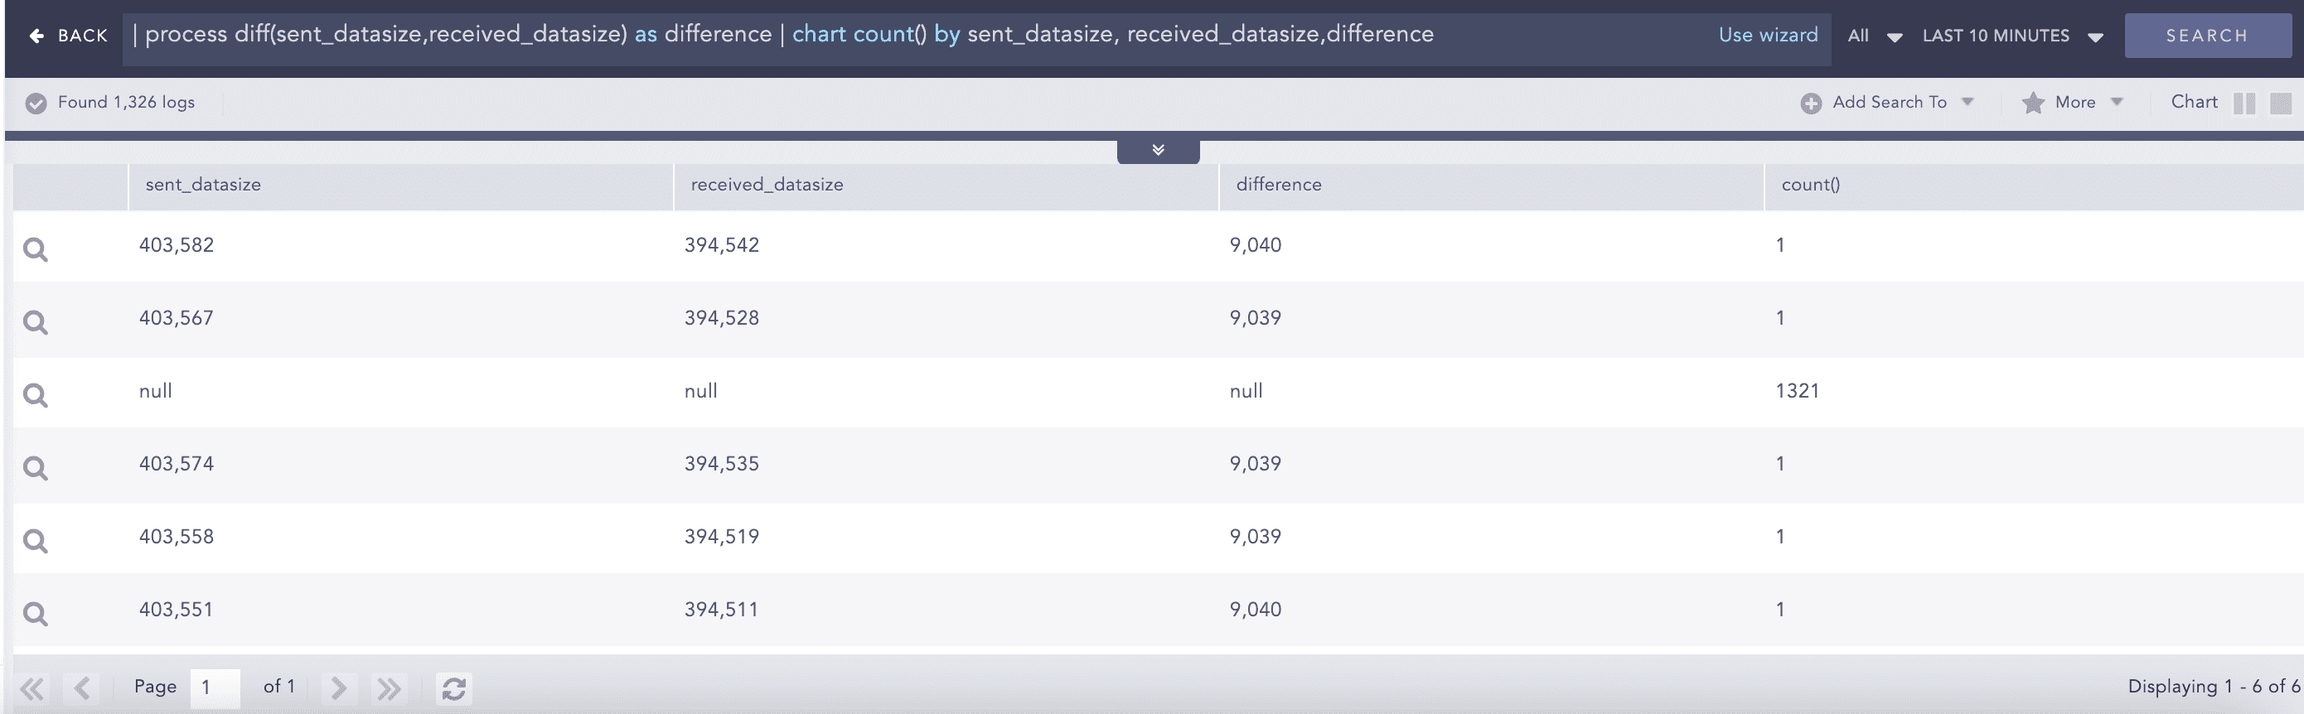
Difference
Calculates the difference between two numerical field values of a search.
Syntax:
Example:
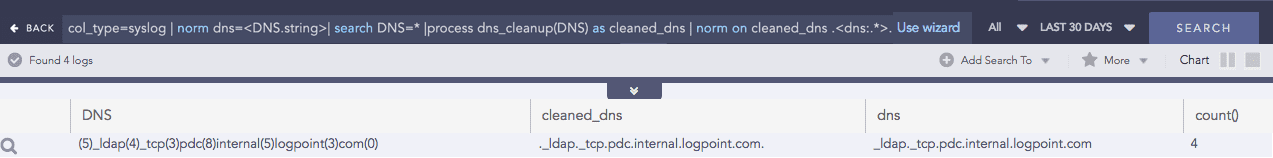
DNS Cleanup
Converts a DNS from an unreadable format to a readable format.
Syntax:
Example:
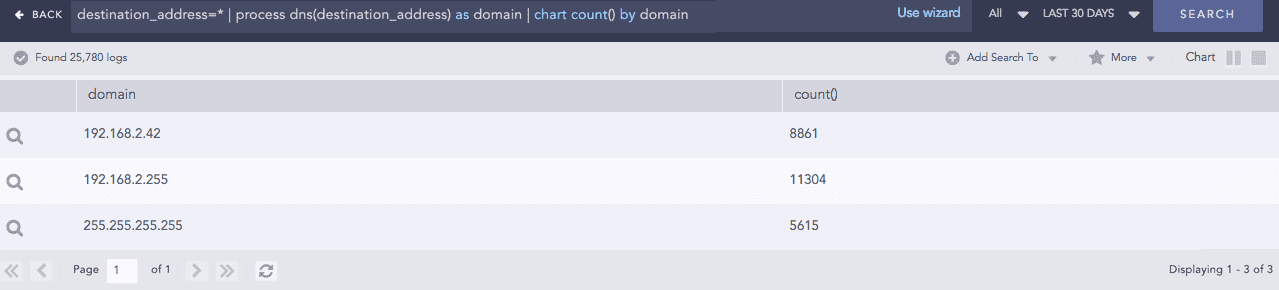
DNS Process
Returns the domain name assigned to an IP address and vice-versa. It takes an IP address or a Domain Name and a Field Name as input. The plugin then verifies the value of the field. If the input is an IP Address, it resolves the address to a hostname and if the input is a Domain Name, it resolves the address to an IP Address. The output value is stored in the Field Name provided.
Syntax:
Example:
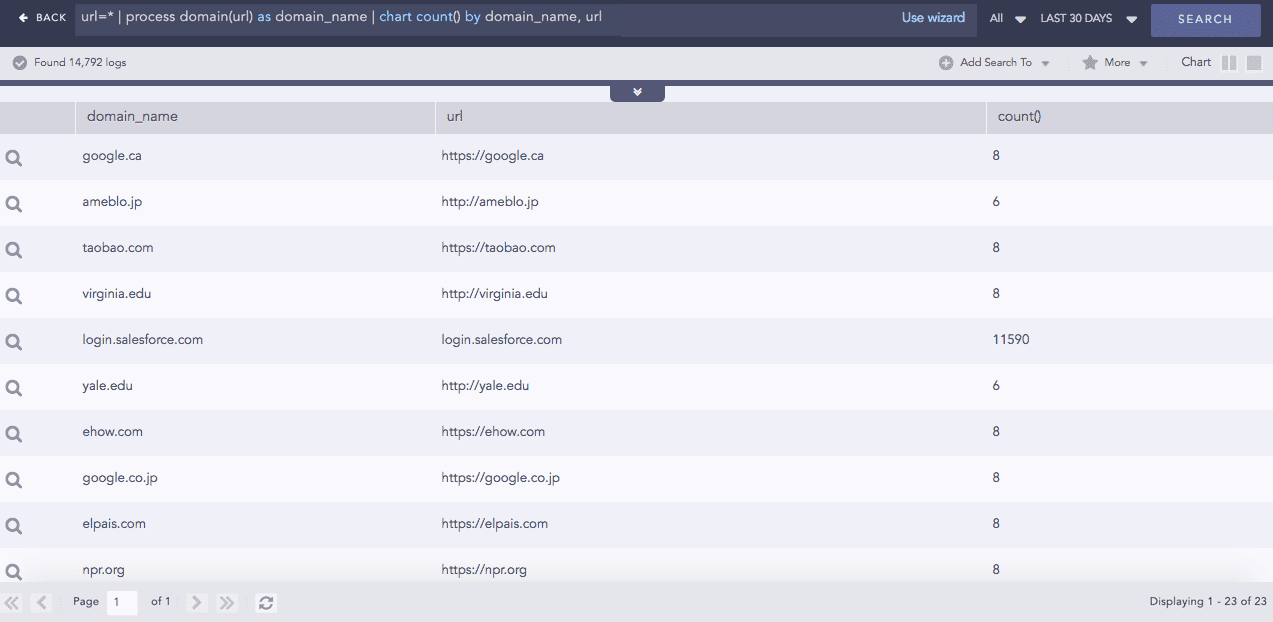
Domain Lookup
Provides the domain name from a URL.
Syntax:
Example:
Entropy
Entropy measures the degree of randomness in a set of data. This process command computes the entropy of a field using the Shanon entropy formula and displays the results in the provided field. A higher entropy value indicates a data set with greater randomness, which increases the likelihood that the values were artificially generated and could lead to a malicious conclusion.
Syntax:
Example:
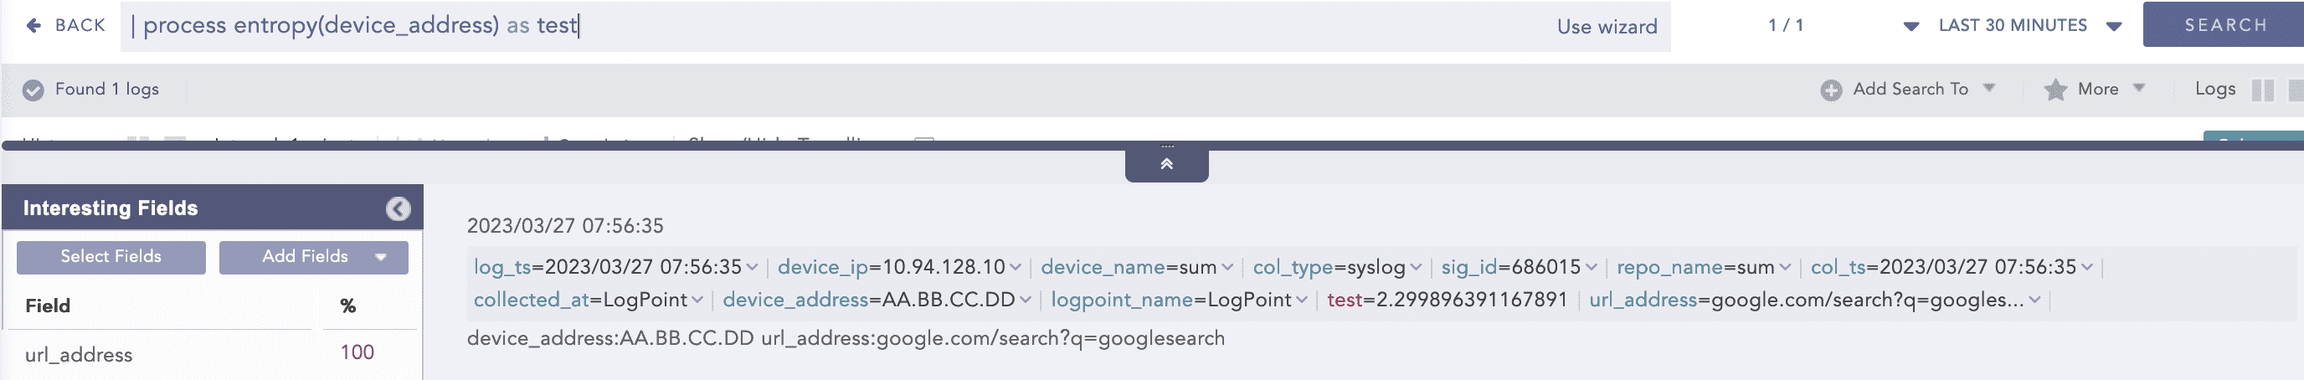
Here, the “| process entropy (device_address) as test” query calculates the entropy of the device_address field and displays it in test.
Example:
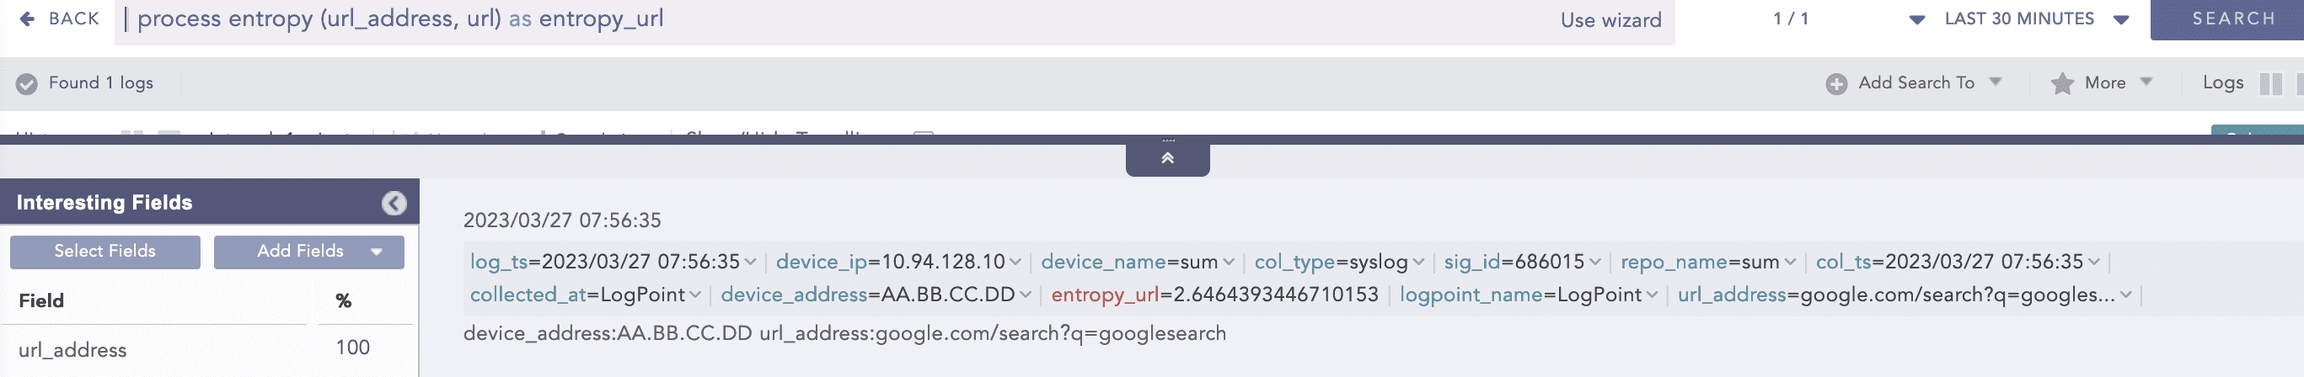
Here, the “| process entropy (url_address, url) as entropy_url” query takes url as an optional parameter and extracts the domain name from the url_address to perform entropy calculation on it and displays it in entropy_url.
Example:
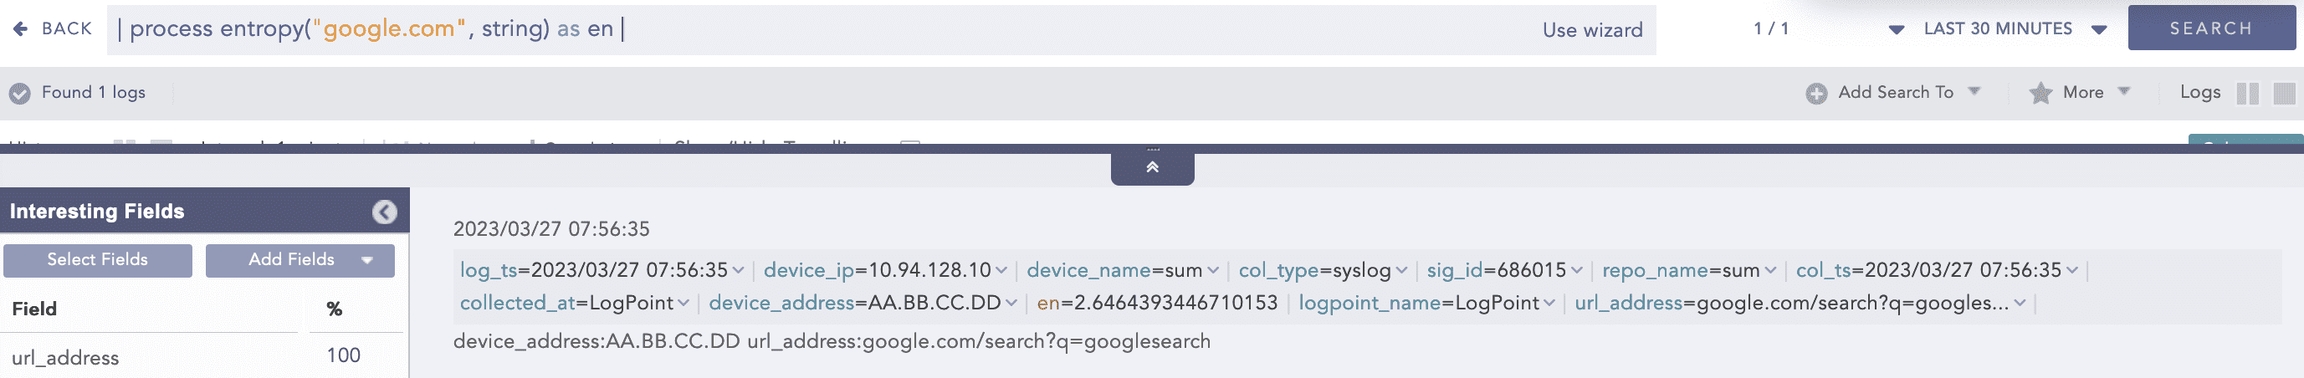
Here, the “| process entropy (“google.com”, string) as en” query takes string as an optional parameter and calculates the entropy of the google.com raw string field and displays it in en.
Eval
Evaluates mathematical, boolean, and string expressions. It stores the evaluation result in an identifier as a new field.
Syntax:
Example:
For more information, go to the Evaluation Process Plugin Manual.
Experimental Median Quartile Quantile
Performs statistical analysis (median, quartile, and quantile) of events based on fields. All these commands take numerical field values as input.
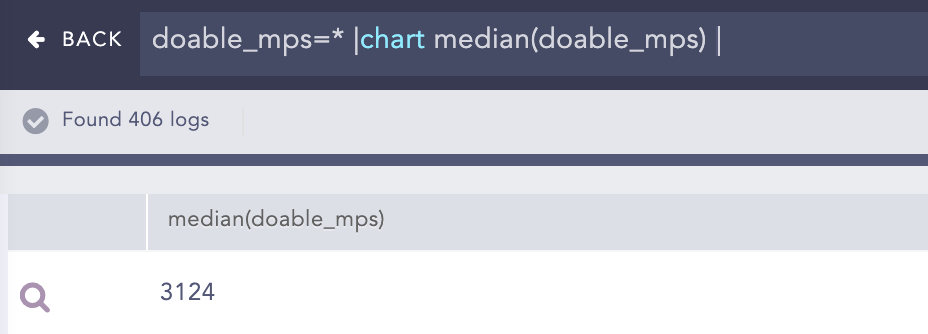
Median
Syntax:
Example:
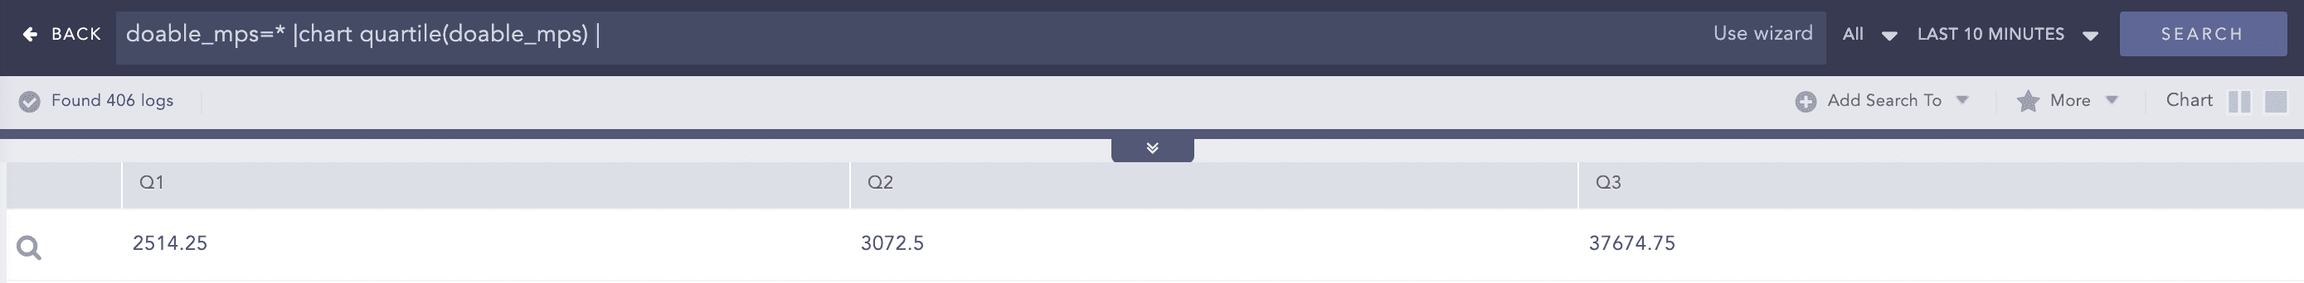
Quartile
Syntax:
Example:
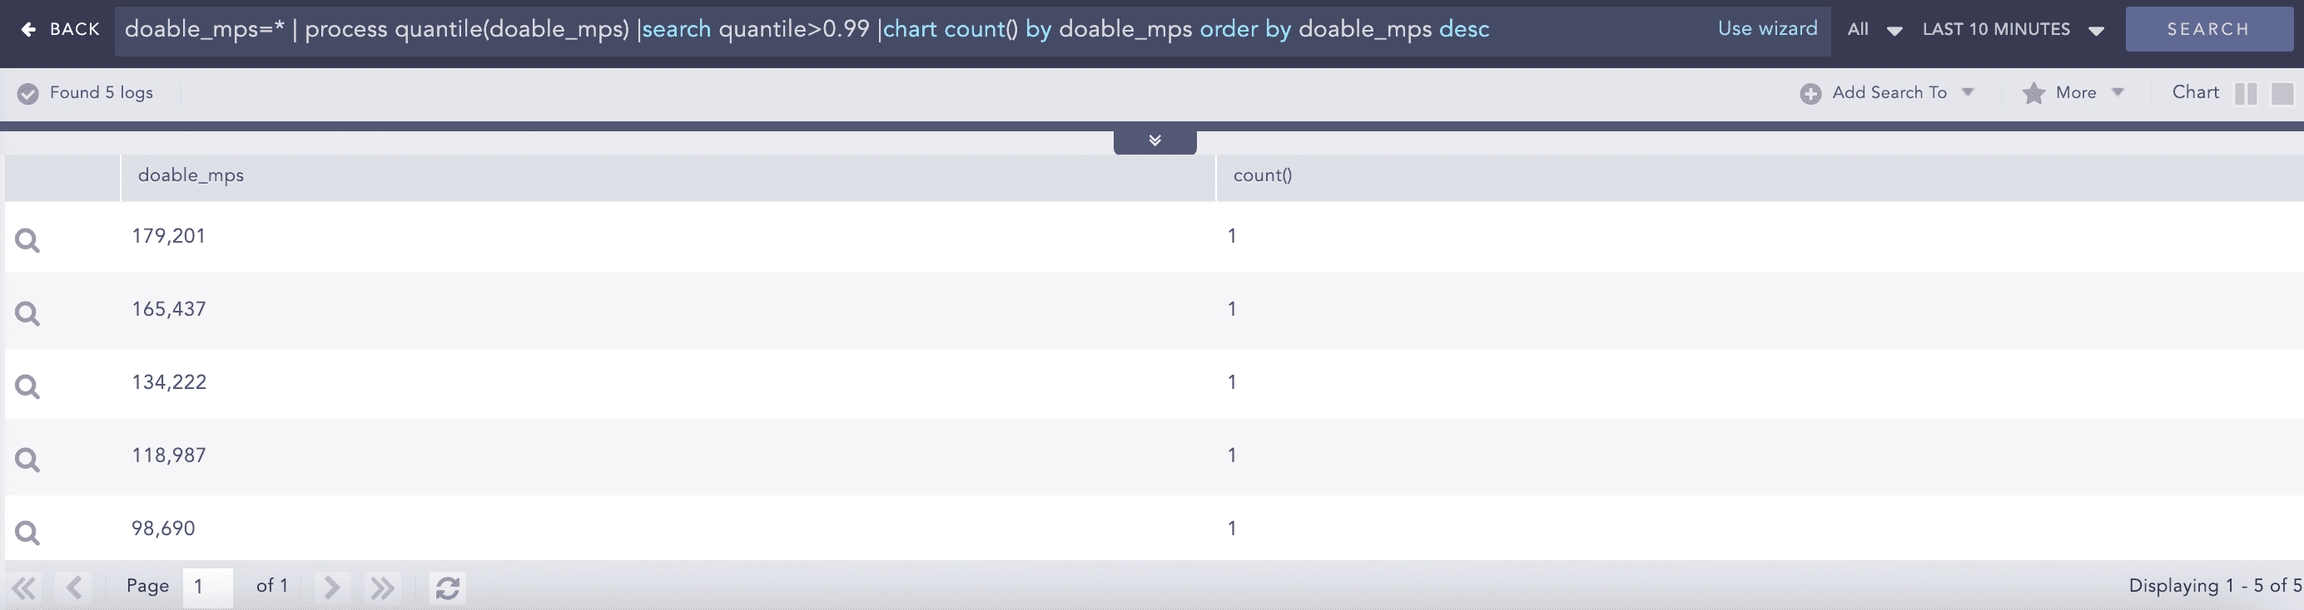
Quantile
Syntax:
Example:
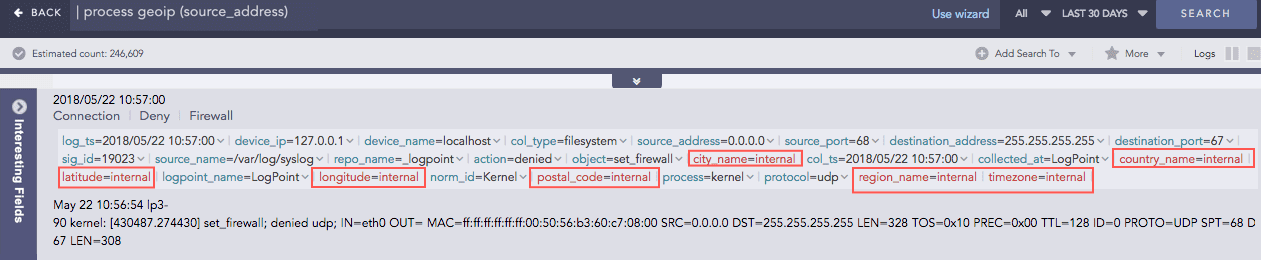
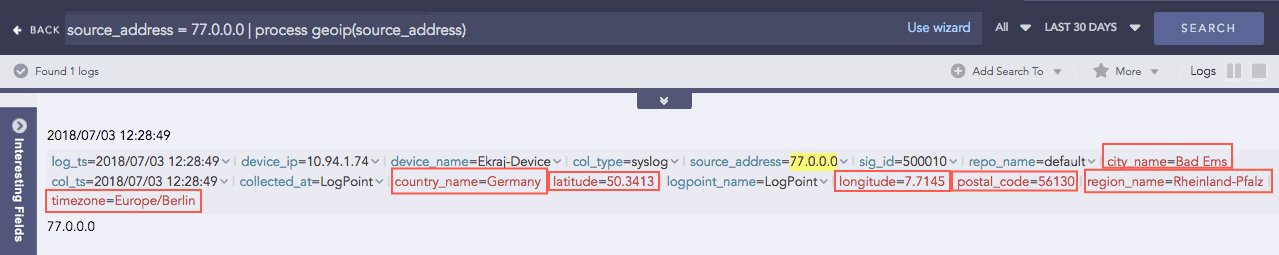
GEOIP
Gives the geographical information of a public IP address. It adds a new value “internal” to all the fields generated for the private IP, supporting the RFC 1918 Address Allocation for Private Internets.
Syntax:
Example:
For the Private IP:
For the Public IP:
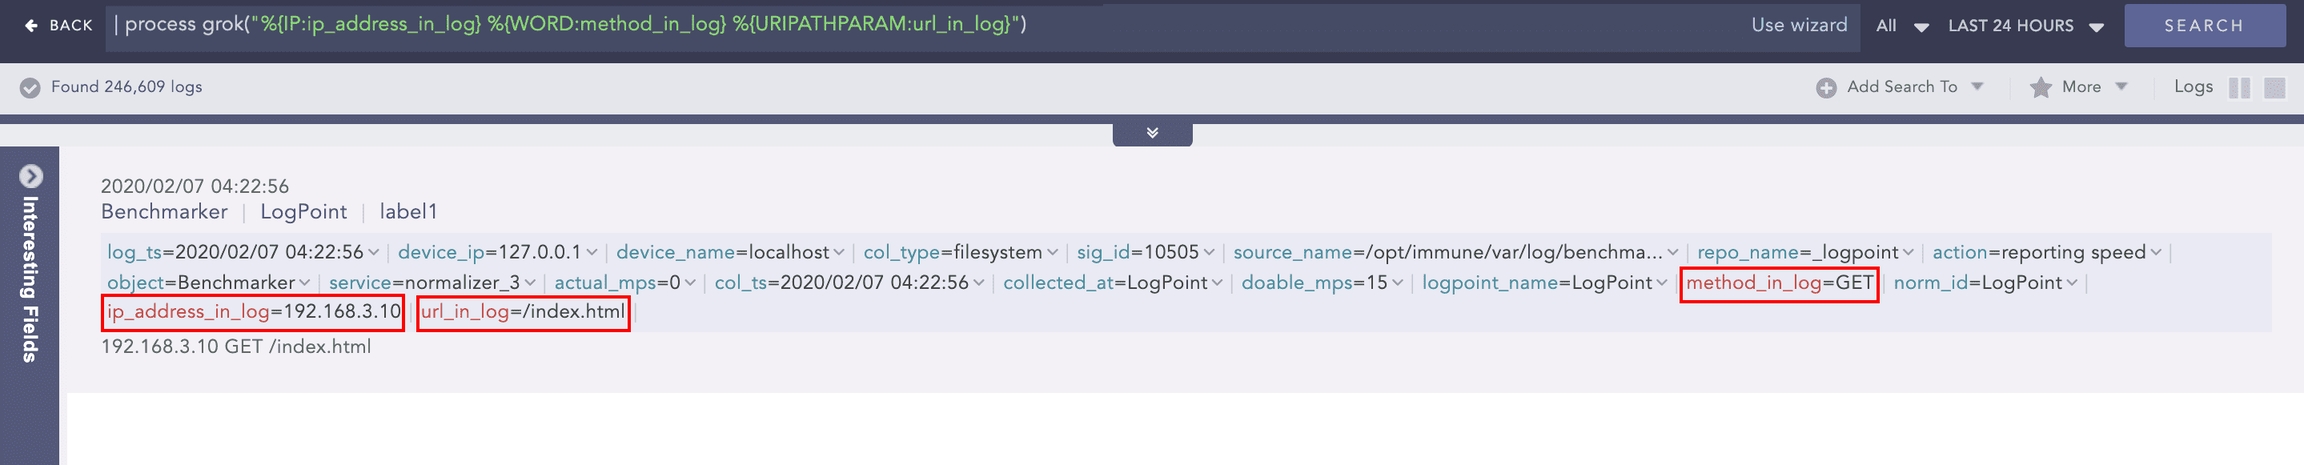
Grok
Extracts key-value pairs from logs during query runtime using Grok patterns. Grok patterns are regular expressions that match words, numbers, IP addresses, and other data formats.
Refer to Grok Patterns and find a list of all the Grok patterns and their corresponding regular expressions.
Syntax:
A signature can contain one or more Grok patterns.
Example:
To extract the IP address, method, and URL from the log message:
Use the command:
Using this command adds the ip_address_in_log, method_in_log, and url_in_log fields and their respective values to the log if it matches the signature pattern.
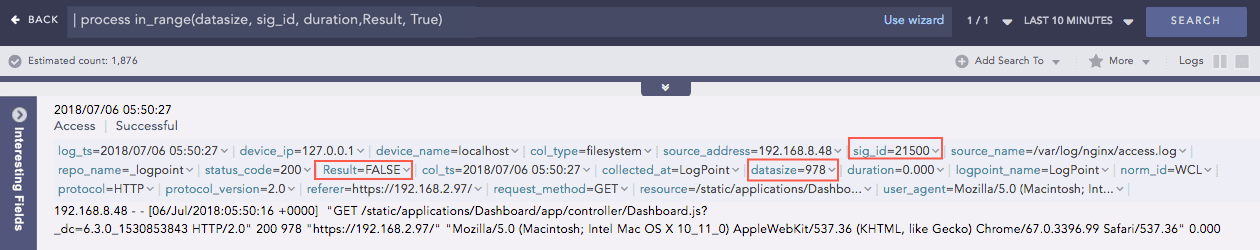
InRange
Determines whether a certain field-value falls within the range of two given values. The processed query returns TRUE if the value is in the range.
Syntax:
Example:
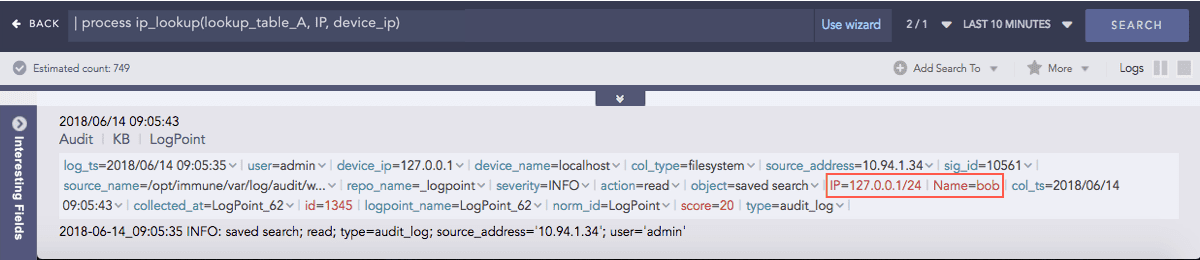
IP Lookup
Enriches the log messages with the Classless Inter-Domain Routing (CIDR) address details. A list of CIDRs is uploaded in CSV format during the configuration of the plugin. For any IP Address type in the logs, it matches the IP to the user-defined Lookup table and enriches the search results by adding CIDR details.
Syntax:
Example:
Here, the command compares the IP column of the lookup_table_A with the device_ip field of the log and if matched, the search result is enriched.
JSON Expand
Takes the field with a valid JSON array value and:
Splits the array into individual JSON objects.
Creates multiple log instances for each array value of that field.
Assigns the original field name to each array value.
Syntax:
Use Case 1
For example, a normalized events field with a valid JSON array value.
events = [
{“source_ip”: “192.168.0.1”, “action”: “login”, “status”: “success”},
{“source_ip”: “192.168.0.2”, “action”: “login”, “status”: “failure”},
{“source_ip”: “192.168.0.3”, “action”: “login”, “status”: “success”}
]
Query:
Output:
Index Log 1:
events = {“source_ip”: “192.168.0.1”, “action”: “login”, “status”: “success”}
Index Log 2:
events = {“source_ip”: “192.168.0.2”, “action”: “login”, “status”: “failure”}
Index Log 3:
events = {“source_ip”: “192.168.0.3”, “action”: “login”, “status”: “success”}
You can further normalize JSON array values (JSON objects) into indexed logs.
Syntax:
x enables normalizing the key-value pair of the JSON array into the indexed logs. The normalization occurs up to two levels, and a JSON field is ignored if it conflicts with the existing normalized field.
Use Case 2
For example, a normalized evidence field with a valid JSON array value.
evidence = [
{ “odata_type”:”userAccount”, “userAccount”: {“accountName”: “Logpoint”,”azureUserId”: “177”, “details” :{“department”: “IT”, “accountName”: “Logpoint_IT”} } } },
{ “odata_type”:”ipAddress”,”ipAddress”: “192.168.1.1” }
]
Query:
Output:
Index Log 1:
evidence = {“odata_type”:”userAccount”, “userAccount”: {“accountName”: “Logpoint”,”azureUserId”: “177”, “details” :{“department”: “IT”, “accountName”: “Logpoint_IT”} } } } // preserving the original field
odata_type = userAccount
userAccount_accountName = Logpoint
userAccount_azureUserId = 177
Here,
In level 1, odata_type and userAccount fields are extracted, and in level 2, userAccount_accountName and userAccount_azureUserId fields.
userAccount_details_department and userAccount_details_accountName fields can be extracted manually.
userAccount_details_accountName field is ignored since userAccount_accountName already exists.
Index Log 2:
evidence = {“odata_type”:”ipAddress”,”ipAddress”:”192.168.1.1”} // preserving the original field
odata_type = ipAddress
ipAddress = 192.169.1.1
Example:
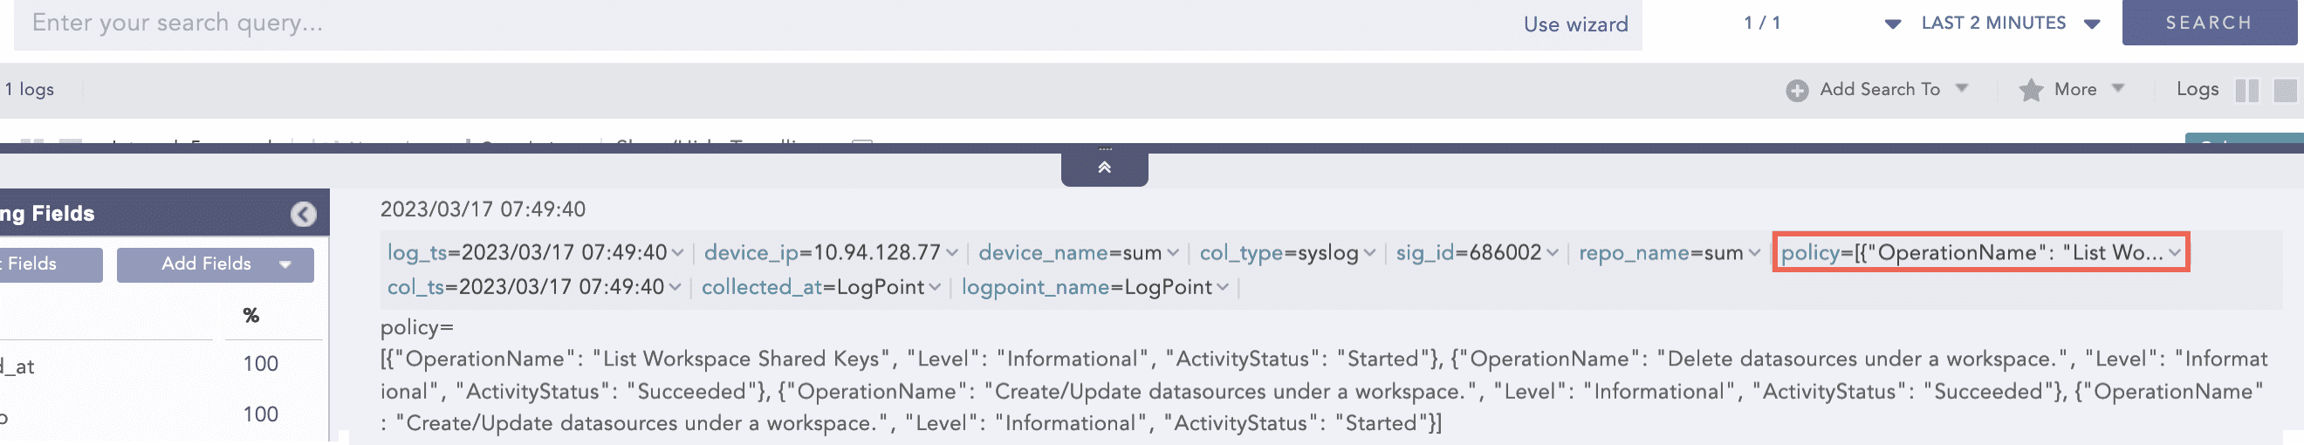
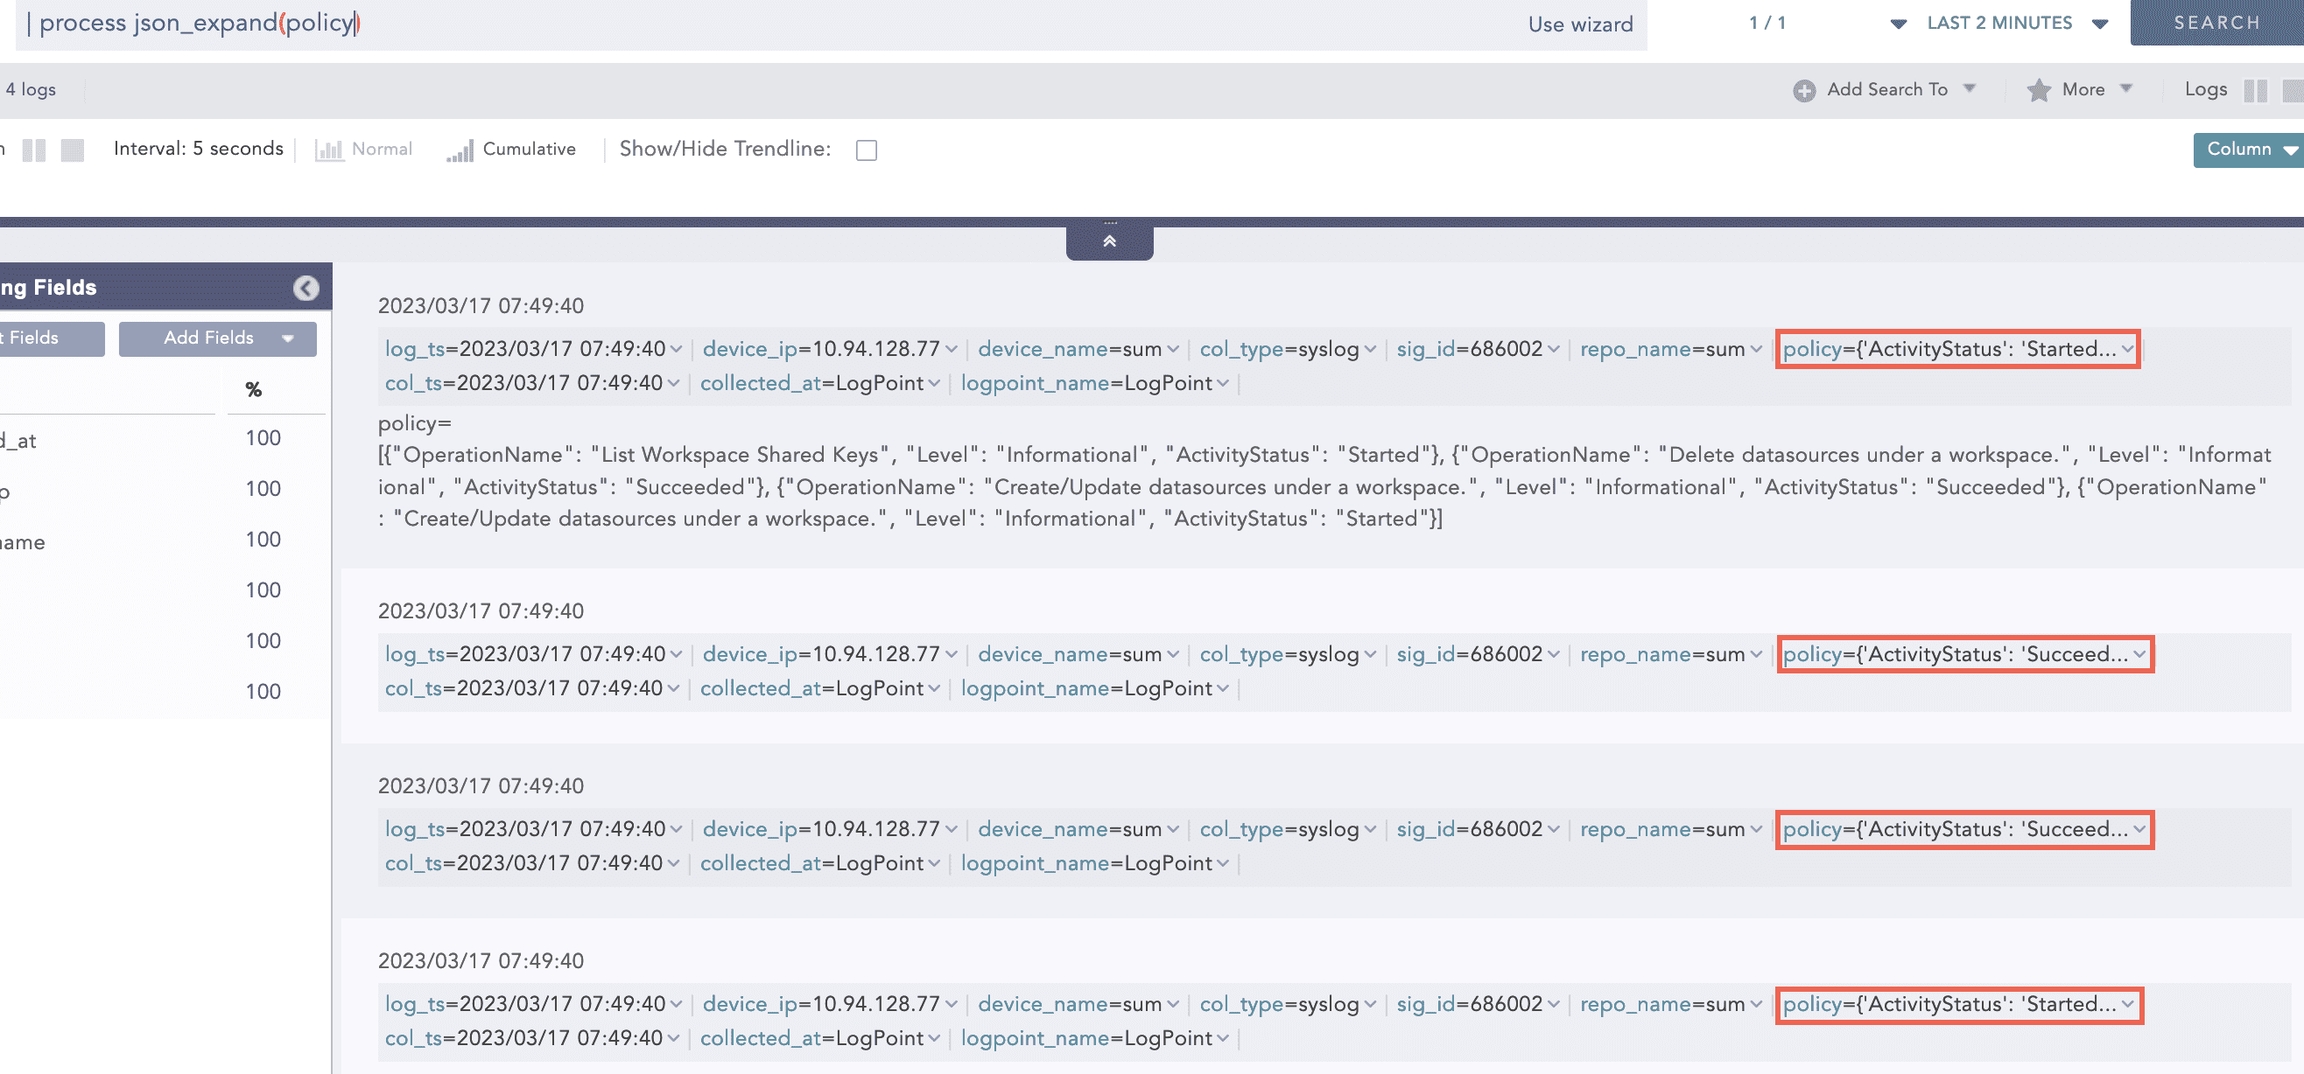
Here, the “| process json_expand (policy)” query expands the policy field into four log instances. After expansion, each array value takes the policy as a field name.
JSON Parser
The JavaScript Object Notation (JSON) Parser reads JSON data and extract key values from valid JSON fields of normalized logs. A string filter is applied to the provided field, which defines a path for extracting values from it. The filter contains a key, which can be alphanumeric and special characters except square brackets ([]), backtick (`) and tilde (~). These exceptional characters are reserved for essential use cases, such as mapping the list and selecting a condition in JSON Parser.
Syntax:
The supported filter formats are:
Chaining for nested JSON
Example: .fields.user.Username
Array access
Example: .[1]
The supported filters are:
flatten
It collapses nested arrays into a single, flat array and simplifies the structure of deeply nested arrays by combining all their items into a single level. Example:
arr = [“John”, “Doe”, [“Hello”, “World”], “Welcome”]
Query:
process json_parser(arr, “flatten”) as flattened_arr
Output:
flattened_arr = [“John”, “Doe”, “Hello”, “World”, “Welcome”]
reverse
It reverses the order of items in an array, simplifying operations that require reversing the order, such as sorting or searching. Example:
jsn_list = {“severity”: [5,4,1,8]}
Query:
process json_parser(jsn_list, “.severity | reverse”) as reversed_severity
Output:
reversed_severity = [8, 1, 4, 5]
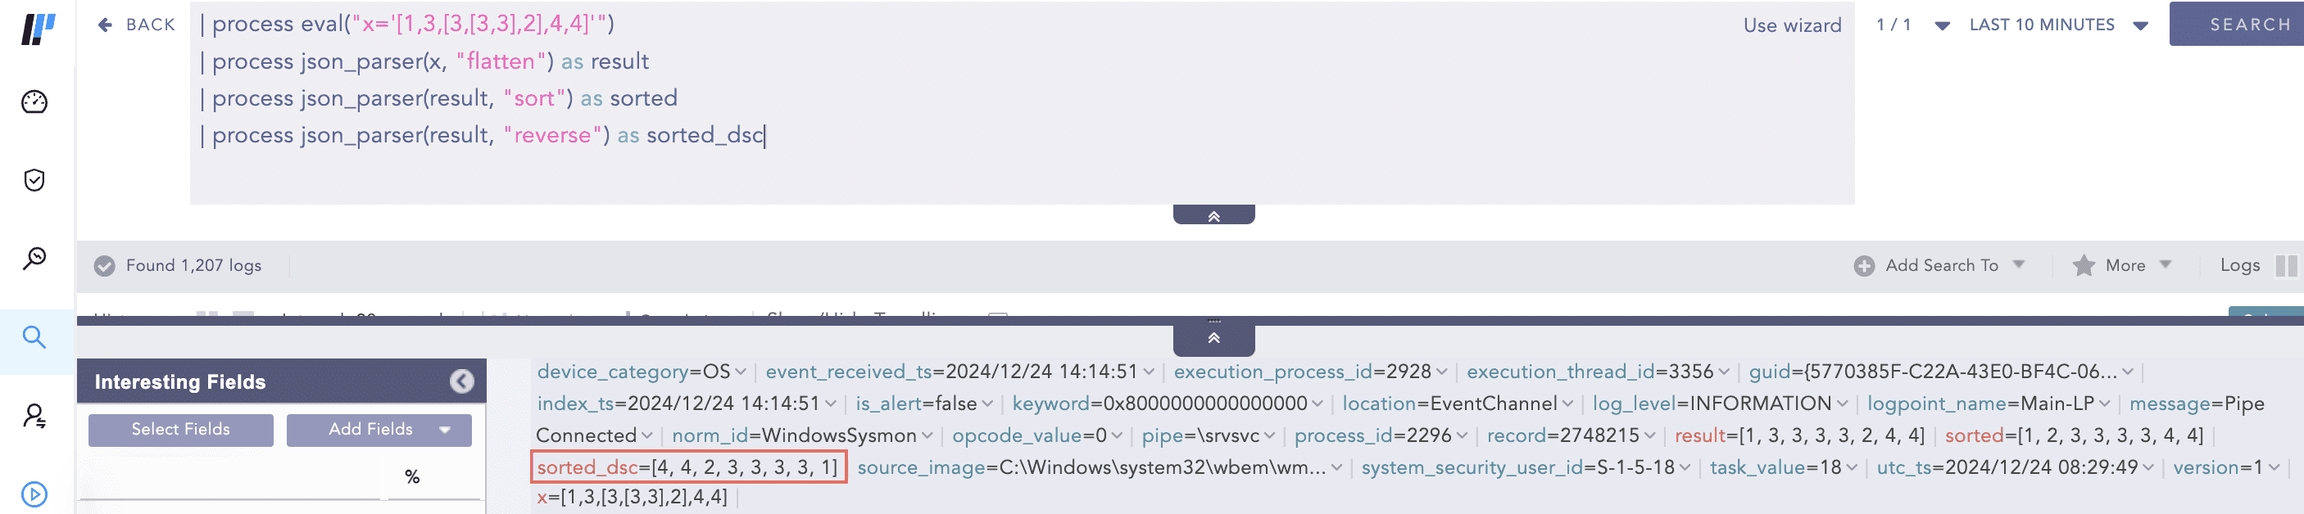
Using Reverse Filter with Flatten and Sort Filters sort
It arranges the items of an array in ascending order.
The items of an array are sorted in the following order:
null
false
true
numbers
strings, lexicographically
objects
Example 1:
jsn_list = {“severity”: [5,4,1,8]}
Query:
process json_parser(jsn_list, “.severity | sort”) as sorted_severity
Output:
sorted_severity = [1, 4, 5, 8]
Example 2:
x: [true, false, null, “abc”, “ab”, 0, 5, 1]
Query:
process eval (“x=’[true, false, null, “abc”, “ab”, 0, 5, 1]’”)process json_parser(x, “sort”) as sorted_result
Output:
sorted_result = [null, false, true, 0, 1, 5, “ab”, “abc”]
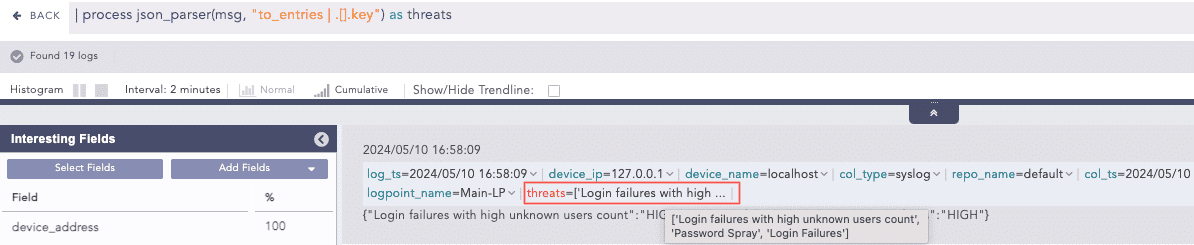
to_entries It transforms a JSON object into an array of object, where each key-value pair becomes an object with key and value fields. This helps process key-value pairs or convert an object into a more manageable structure in a query result.
Example:
jsn_obj = {“name”: “John Doe”, “age”: 30, “email”: “[email protected]”}
Query:
process json_parser(jsn_obj, “to_entries”) as key_fields
Output:
key_fields = [ {“key”: “name”,”value”: “John Doe”}, {“key”: “age”,”value”: 30}, {“key”: “email”,”value”: “[email protected]”} ]
Using to_entries Filter to get Key Fields unique It removes duplicate items from an array. After applying the filter, the resulting array contains only one instance of each unique item from the original array, ensuring that all values in the returned array are distinct. Example:
jsn_list = {“files”: [“1.exe”, “1.exe”, “2.exe”]} Query:
process json_parser(jsn_list, “.files | unique”) as unique_file
Output:
unique_file = [“1.exe”, “2.exe”]
JSON Parser supports map and select functions for applying filters with true conditional statements. The supported conditional operators are: =, !=, >, < , >= and <=.
General syntax to use map and select functions:
JSON Parser converts a non-JSON value to a list with a single item when dot (.) filter is applied.
Use Case:
For example, a normalized col_type field with a non-JSON filesystem value.
Query:
Output:
JSON Parser supports negative indexes, enabling the return of the last element of a data set.
Use Case:
For example, a normalized IP field appearing as a multiple-value array.
ip = [10,20,30,40]
Query:
Output:
Example 1:
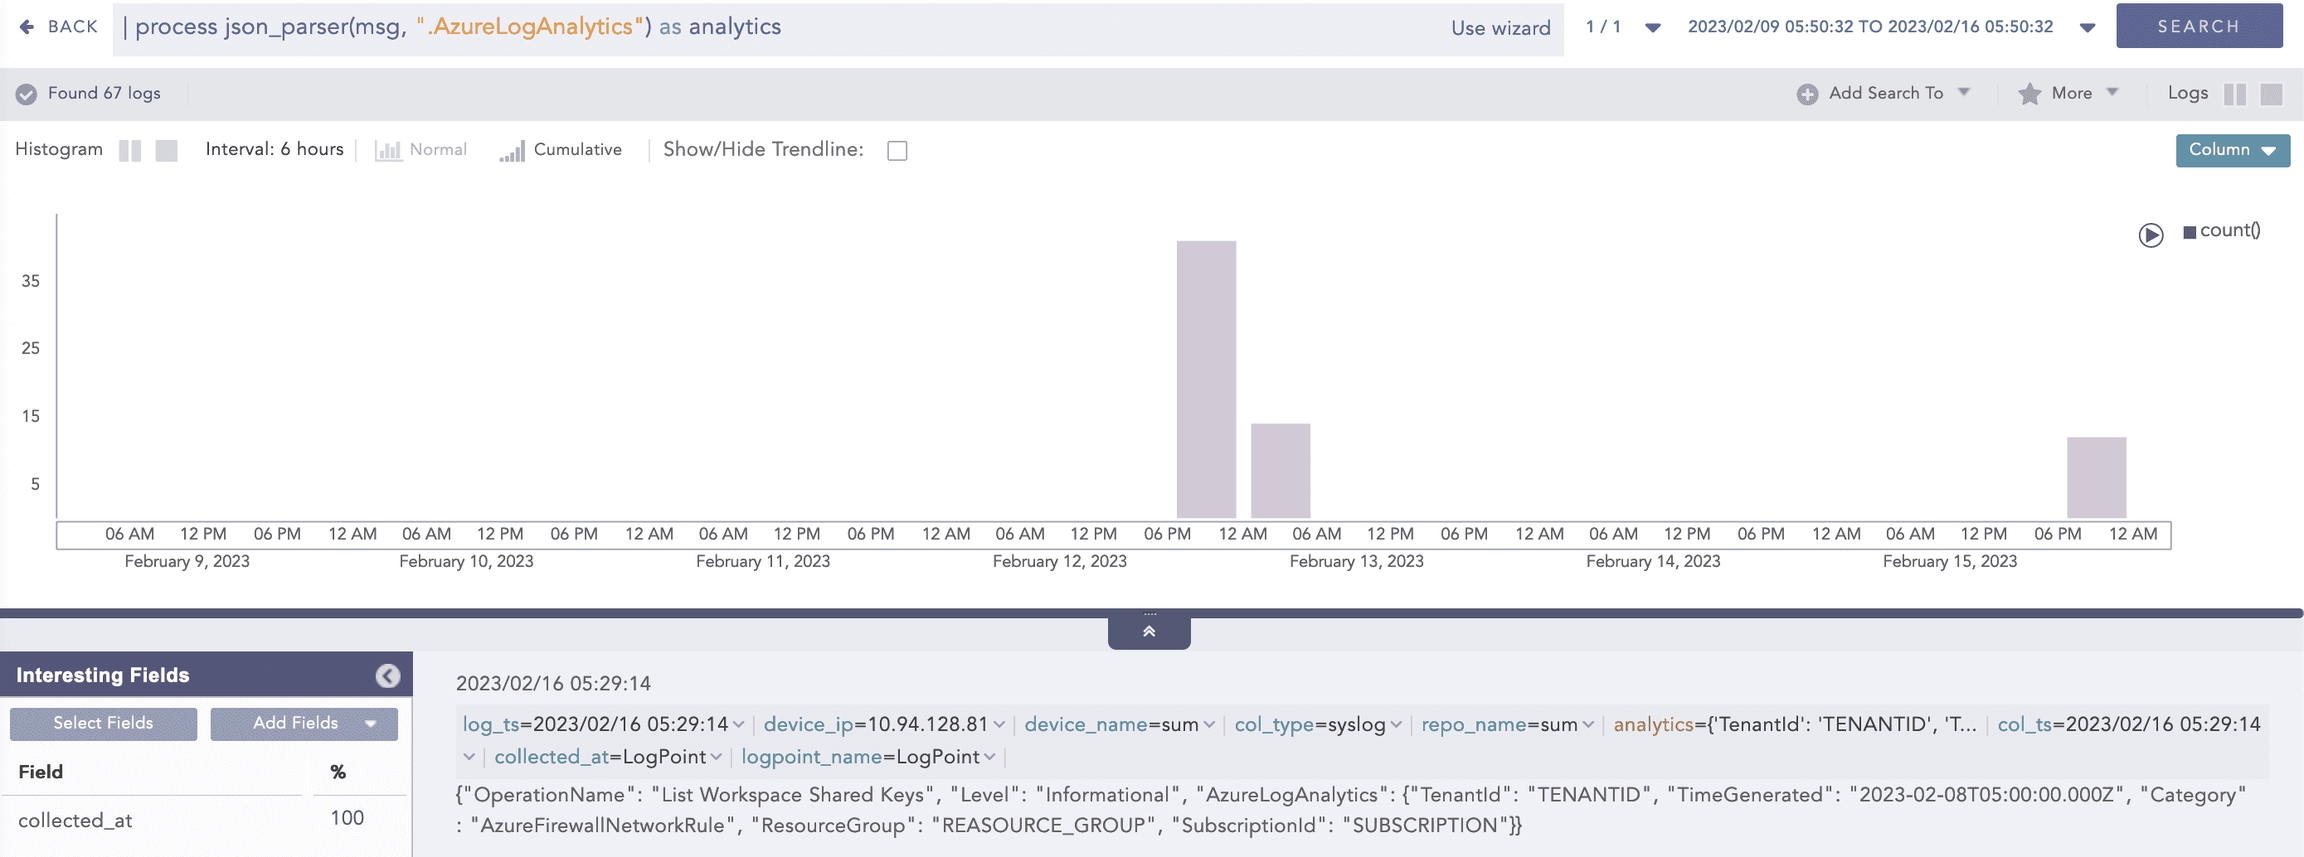
Here, the “| process json_parser (msg, “.AzureLogAnalytics”) as analytics” query applies the AzureLogAnalytics filter to the msg field and extracts the key values to the analytics field
Example 2:
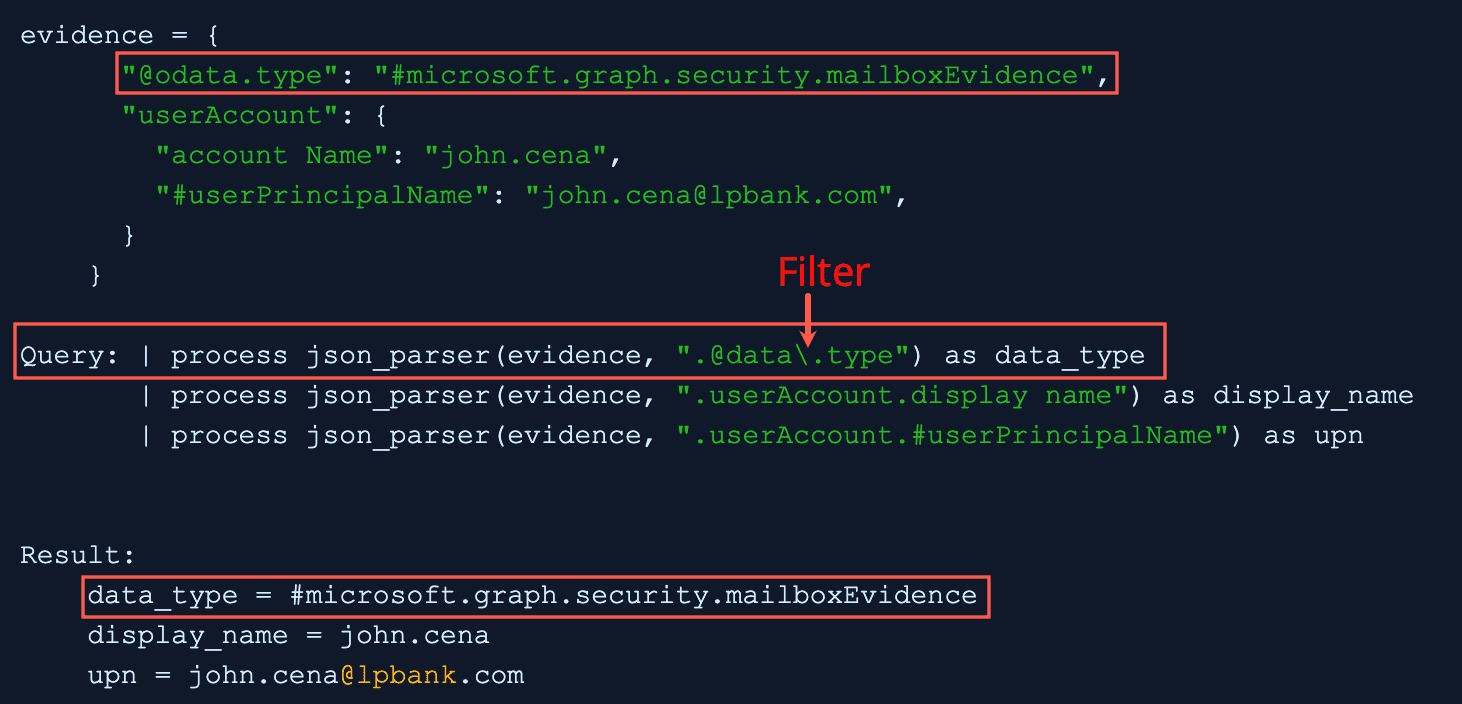
In filter, the backslash escaped the period before type and query applies the filter to the evidence field and extracts the key value to the data_type field.
Example 3:
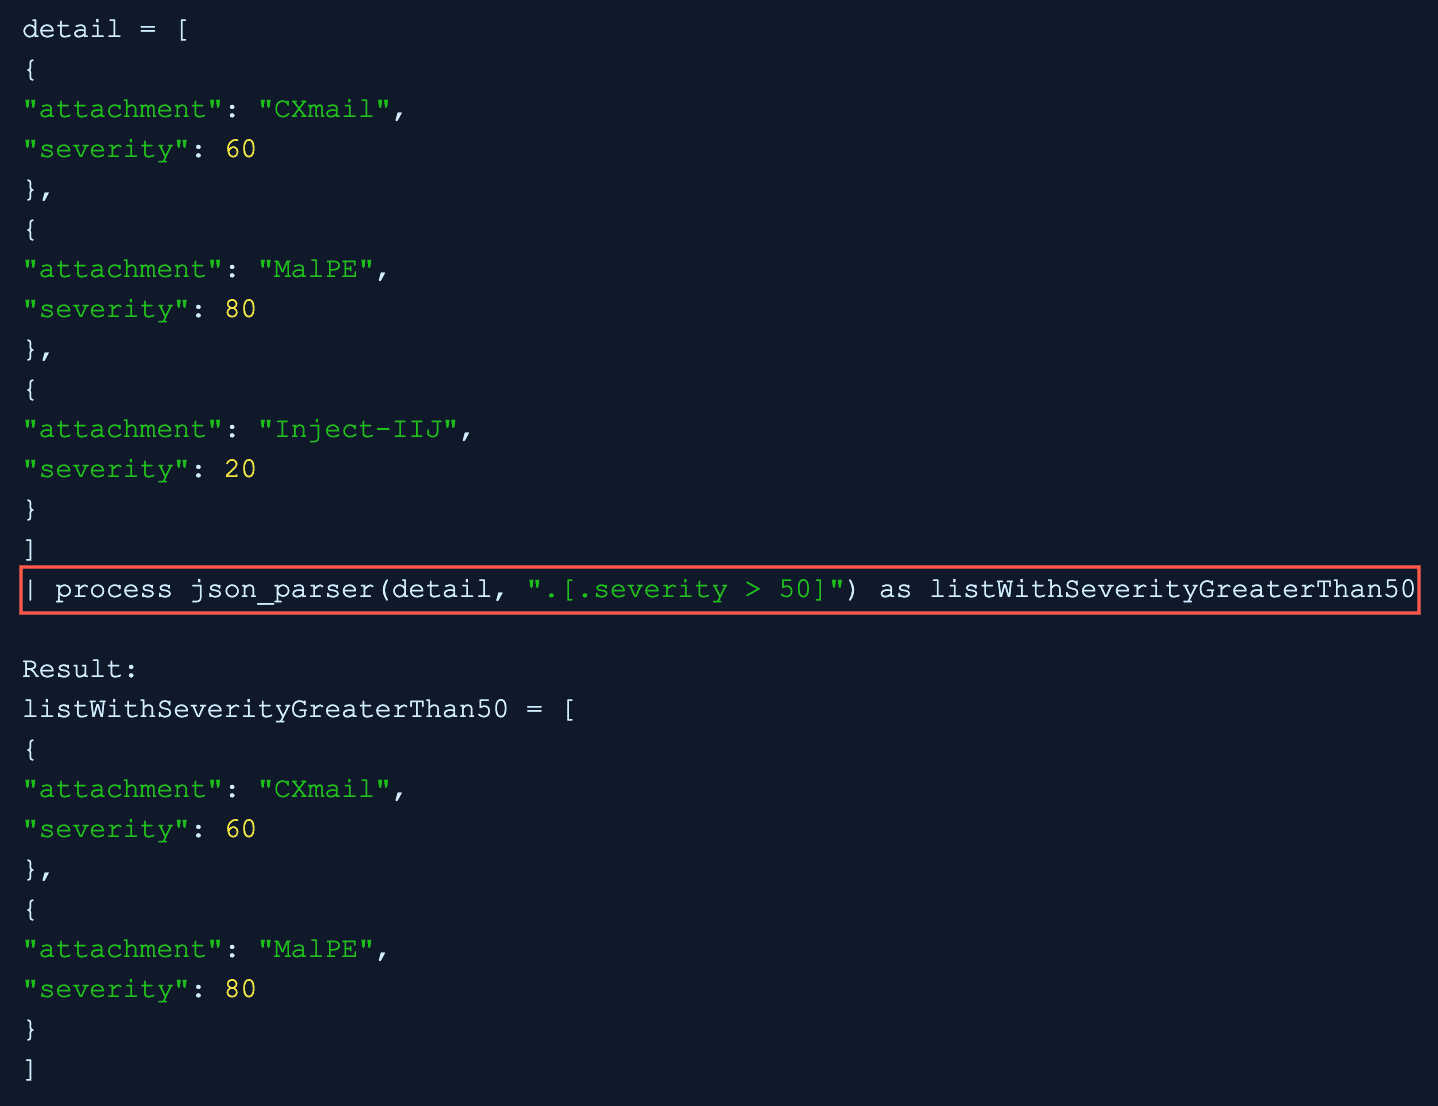
In the .[.severity>50] filter, a conditional statement severity>50 is used and the “| process json_parser(detail, “.[.severity > 50]”) as listWithSeverityGreaterThan50” query applies the filter to the detail field and extracts the list of key values with the true condition to the listWithSeverityGreaterThan50 field.
ListLength
For an indexed field with a list of values, such as destination_port = [67, 23, 45, 12, 10], the command returns the number of elements in the list. The command does not support the static or dynamic lists.
Syntax:
Use Case:
For example, an indexed usernames field appears as a multiple-value array.
usernames = [‘Alice’, ‘Bob’, ‘Carol’, ‘John’]
Query:
Output:
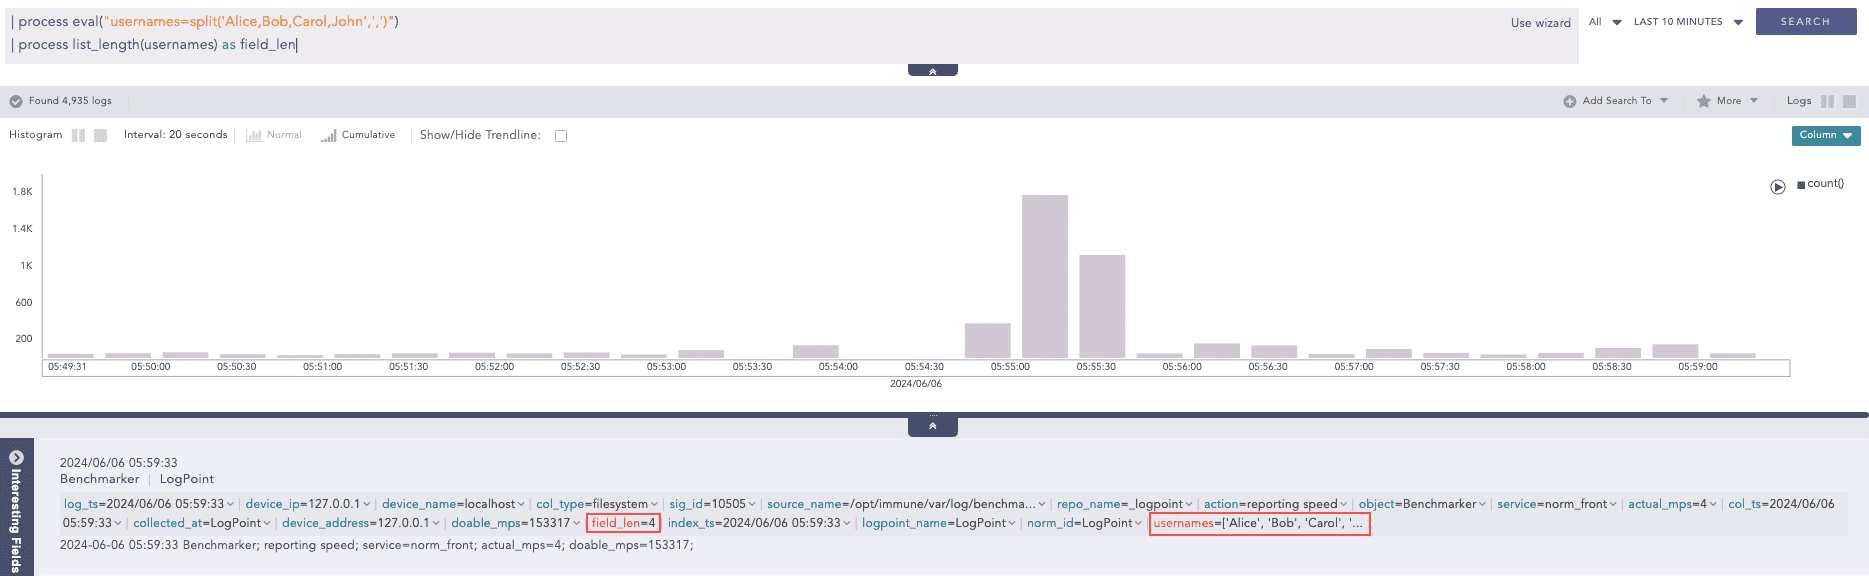
Here, the “| process eval(“usernames=split(‘Alice,Bob,Carol,John’,’,’)”)” query splits the string ‘Alice,Bob,Carol,John’ into a list of strings and assigns the list to usernames field. Then, the “| process list_length(usernames) as field_len” query calculates the length of the usernames field values and returns the result in the field_len field.
Example:
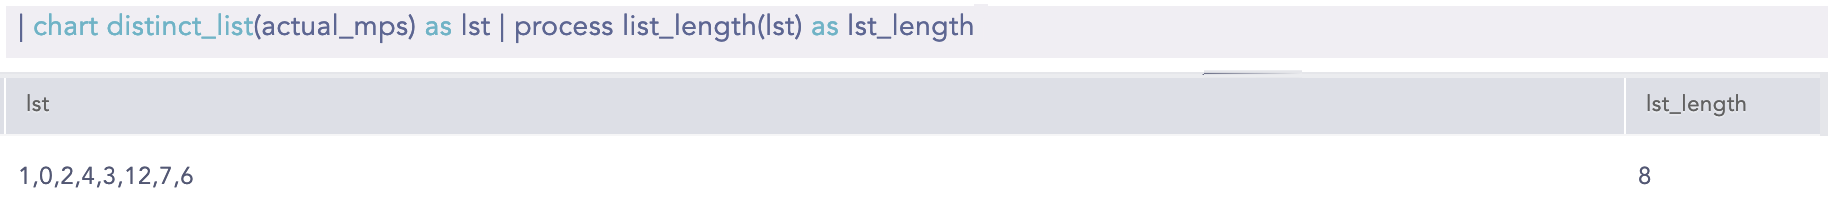
Here, the “| chart distinct_list(actual_mps) as lst” query creates a distinct list of values from the actual_mps field and assigns it to the lst field. Then, the “| process list_length(lst) as lst_length” query calculates the length of the lst field values and returns the result in the lst_length field.
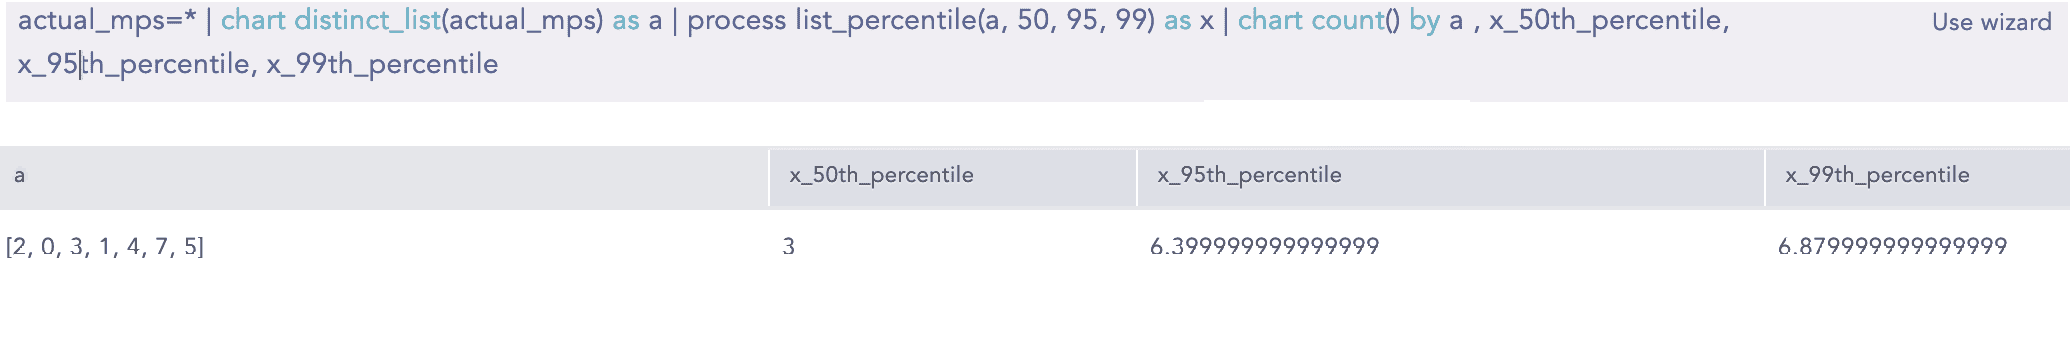
ListPercentile
Calculates the percentile value of a given list. It requires at least two input parameters. The first parameter is mandatory and must be a list. This command can also accept up to five additional parameters. The second parameter must be an alias used with the percentile to determine the required percentile. The alias is concatenated with the percentile percentage to store the required percentile value. Syntax:
Example:
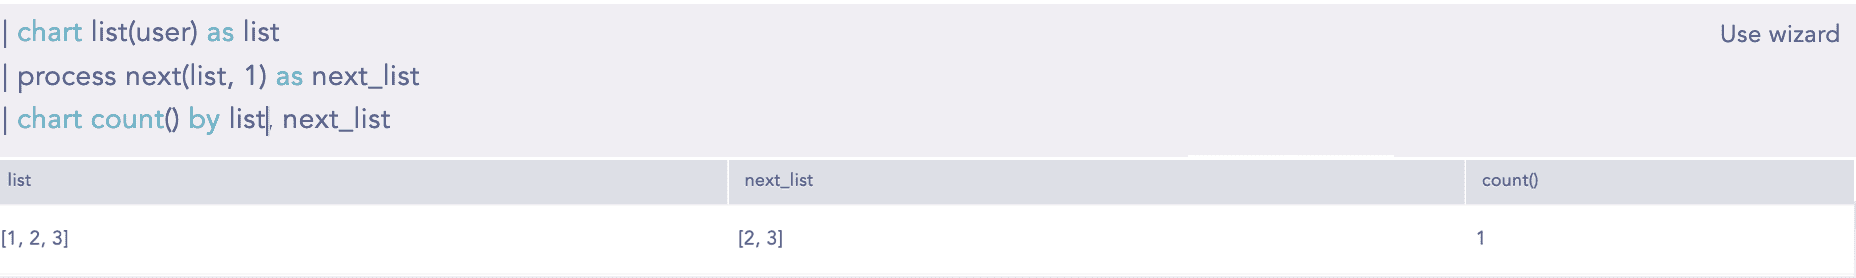
Next
Takes a list and an offset as input parameters and returns a new list where the elements of the original list are shifted to the left by the specified offset. The maximum allowable value for the offset is 1024. For example, if the original list is [1, 2, 3, 4, 5, 6] and the offset is 1, the resulting list would be [2, 3, 4, 5, 6]. Similarly, if the offset is 2, the resulting list would be [3, 4, 5, 6]. This command requires two parameters as input. The first is mandatory and must be a list. The second parameter is mandatory and represents the offset value. An alias of 1 must be provided as input.
Syntax:
Example:
Percentile
Percentiles are numbers below which a portion of data is found. This process command calculates the statistical percentile from the provided field and informs whether the field’s value is high, medium or low compared to the rest of the data set.
Syntax:
Example:
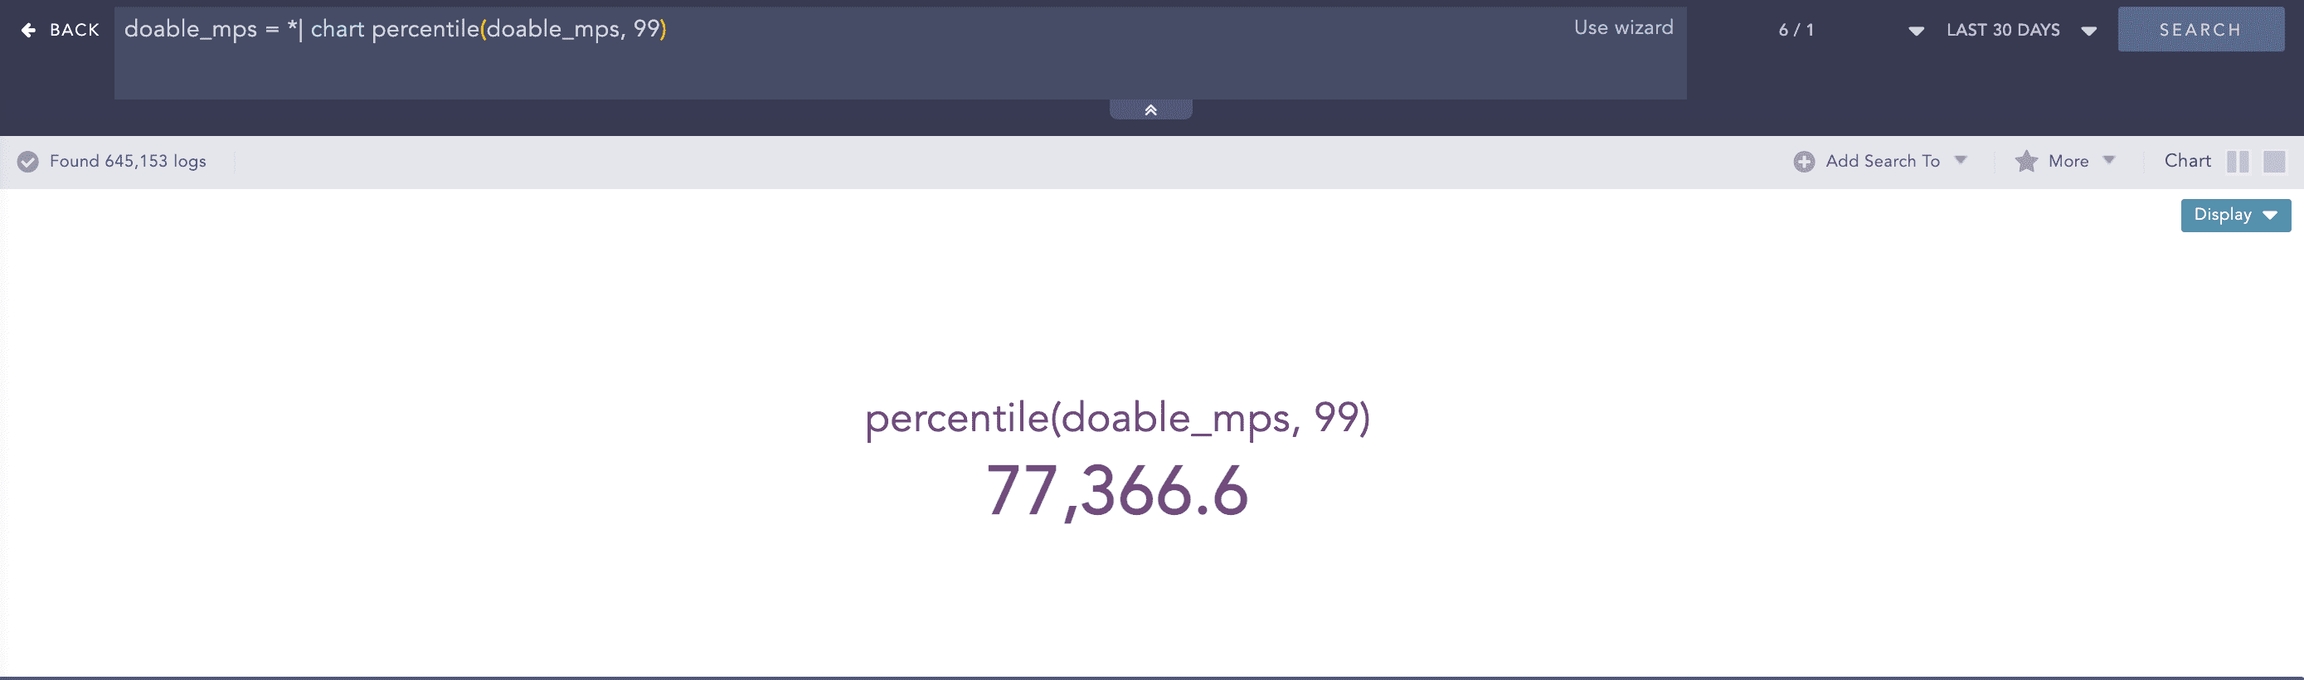
Here, the “| chart percentile (doable_mps, 99)” command calculates the percentile for the value of the doable_mps field.
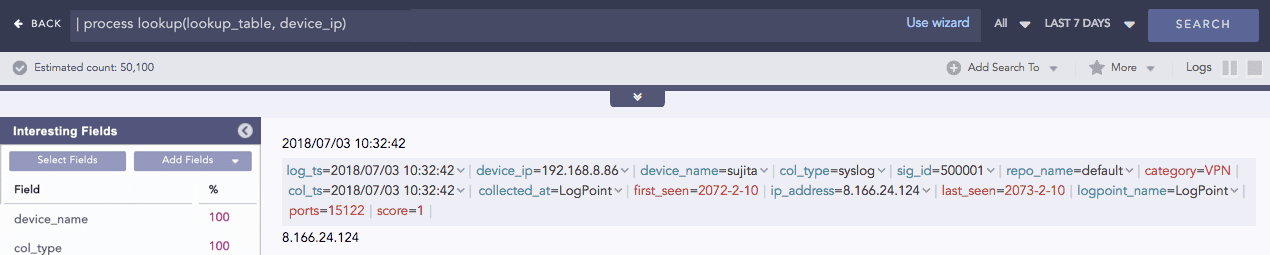
Process lookup
Looks up related data from a user-defined table.
Syntax:
Example:
Regex
Extracts specific parts of the log messages into custom field names based on a regex pattern applied.
Syntax:
Add a filter parameter in the syntax with true or false values to apply a filter to the extracted value. The filter allows only the values matching the regex pattern to be included in the output.
If the filter value is true, the filter is applied to the extracted values and the regex command output matches only those values. If the value is false, the filter is not applied, and the output includes matched and non-matched values.
If a filter is not specified, the default value is false.
Syntax:
Use Case 1:
For example, in the indexed log below,
Log Entry:
Query:
Regex pattern:
In (?P<fst_name>KetS+),
(?) indicates the start of a capture group. A capture group is a way to define and extract specific parts of a text or pattern in a regular expression. It’s like putting parentheses around the part of the text you want to focus on.
P indicates literal character.
<fst_name> is the field name assigned to the capture group. It is the custom field name.
Ket matches the literal characters Ket.
S+ matches one or more non-whitespace characters after Ket in the log.
Process:
The regex pattern searches for sequences that start with Ket followed by non-whitespace characters in each log’s user field.
The pattern matches Ketty and Keth from log entries 2 and 3.
The pattern captures the matched values, and the filter is applied before assigning the values to the fst_name field.
Output:
These are the first names extracted from the user field where the user’s name starts with Ket.
Use Case 2:
For the same log entries above,
Query:
or
process regex(“(?P<fst_name>KetS+)”, user)
When the filter value is false or the filter is not specified, the pattern captures the matched values. It assigns matched and non-matched user field values to the fst_name field.
Output:
Example 1:
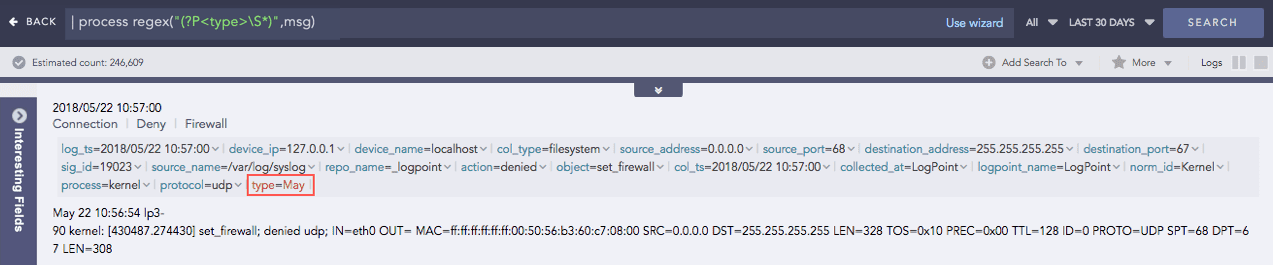
Here, the “| process regex(“(?P<type>S*)”,msg)” query extracts any sequence of non-whitespace characters from the msg field and assigns it to a capture grouped type field.
(?P<type>S*) is the regular expression pattern where,
(?P<type>…) is a capture group, marked by (?P<…>). It assigns the type field name to the matched pattern.
S matches zero or more non-whitespace characters.
‘*’ specifies zero or more occurrences of non-whitespace characters.
msg is the data field to which the regular expression will be applied.
Example 2:
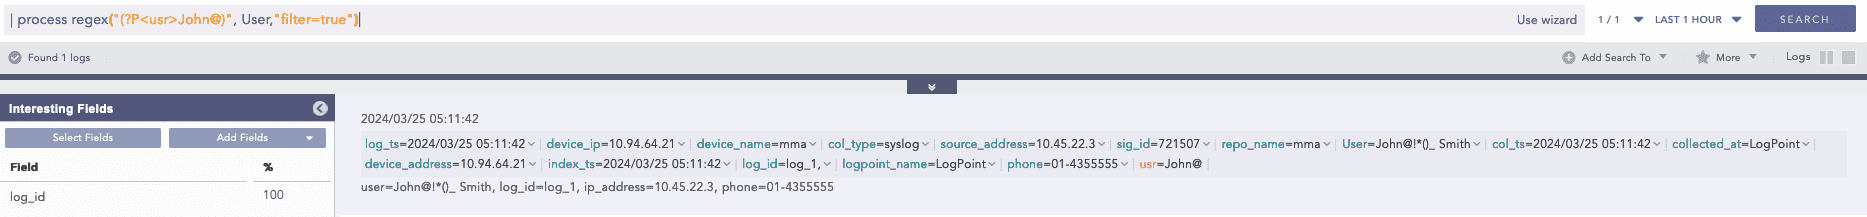
Here, the “| process regex(“(?P<usr>John@)”, User,”filter=true”)” query captures the text in the User field that matches the John@ pattern and assigns it to the captured grouped usr field.
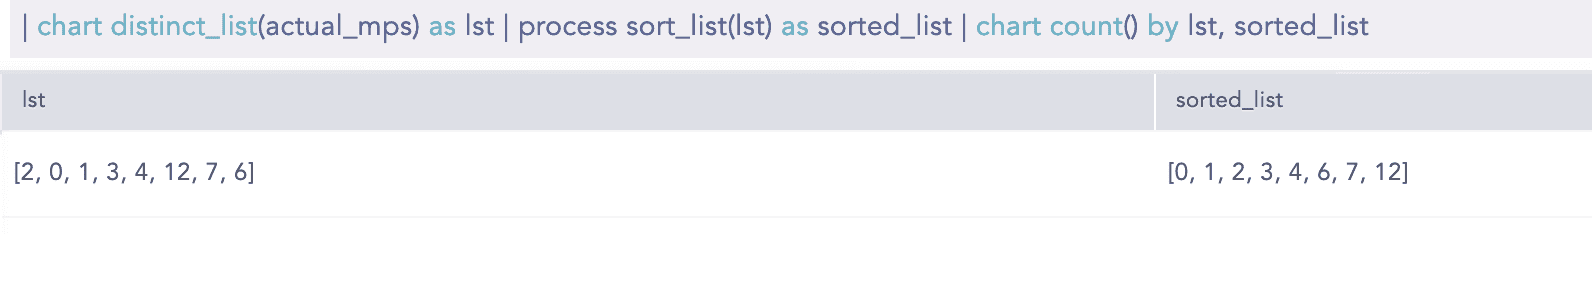
SortList
Sorts a list in ascending or descending order. By default, the command sorts a list in ascending order. The first parameter is mandatory and must be a list. The second parameter desc is optional.
Syntax:
Example:
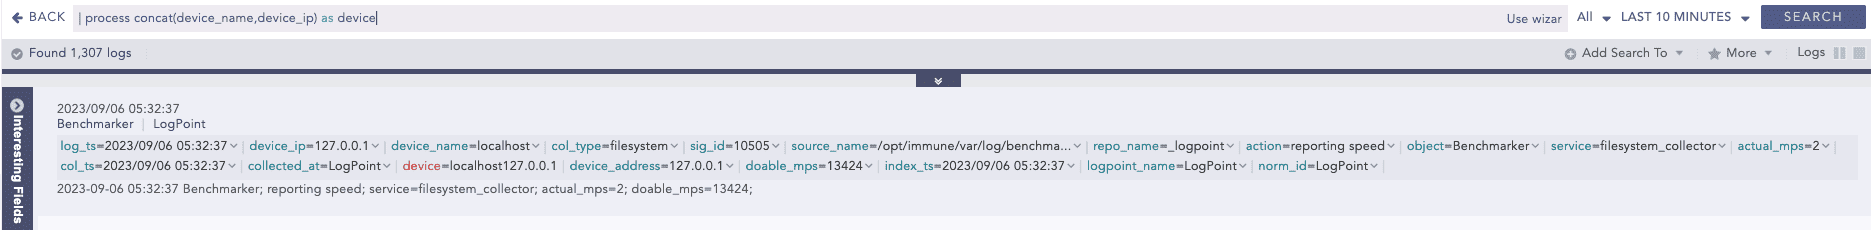
String Concat
Joins multiple field values of the search results.
Syntax:
Example:
Summation
Calculates the sum between two numerical field values of a search.
Syntax:
Example:
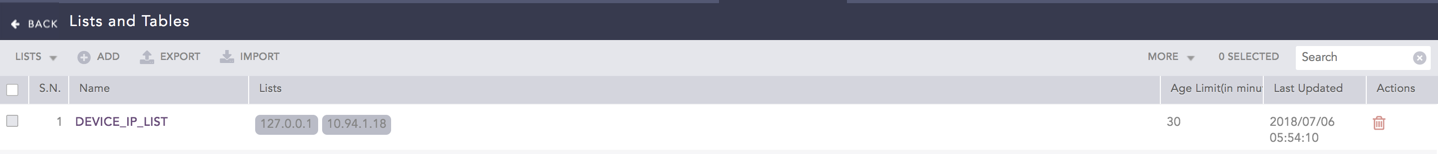
toList
Populates the dynamic list with the field values of the search result. To learn more, go to Dynamic List.
Syntax:
Example:
toTable
Populates the dynamic table with the fields and field values of the search result. To learn more, go to Dynamic Table.
Syntax:
Example:
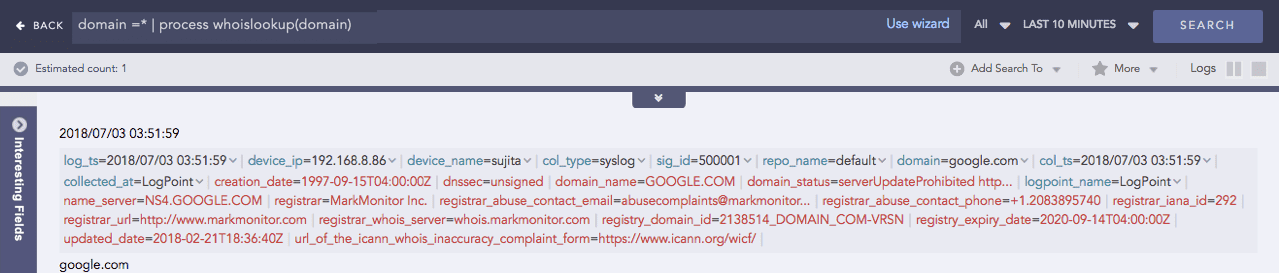
WhoIsLookup
Enriches the search result with the information related to the given field name from the WHOIS database. The WHOIS database consists of information about the registered users of an Internet resource, such as registrar, IP address, registry expiry date, updated date, name server information, and other information. If the specified field name and its corresponding value are matched with the equivalent field values of the WHOIS database, the process command enriches the search result; however, note that the extracted values are not saved.
Syntax:
Example:
Filtering Commands
Filtering commands help you filter the search results.
search
To conduct searches on search results, use the search command. It searches on dynamic fields returned from the norm, rex, and the table commands.
Logpoint does not advise using the search command unless absolutely necessary. This is because the search command consumes significant resources. It is always better to apply a filter before running the search command.
To search for users who have logged in more than 5 times:
If you create a dynamic field new field using the norm command as,
To view the logs that have 100 as the value of the new field, use the search command as:
We recommend you to use the search command only in the following cases:
To filter the results for a simple search (non-key-value search).
For example:
To filter the results using the or logical operator.
For example:
filter
The filter command is used to drill down on the search results. The search command is more efficient as it does not index intermediate fields. The filter command can also filter results based on dynamic fields generated by the norm, rex, and table commands. It supports only expressions that use the =, >, <, >=, and <= operators. To apply multiple conditions, you must chain several filter expressions.
Syntax:
For example, to display only the domains that have more than 10 events associated with them in the search results, use the following query:
The query searches for all the logs containing the fields url and norm_id with the value of norm_id having Firewall at the end. It then adds a new field domain to the logs based on the respective URLs and groups the results by their domains. Finally, the filter command limits the results to only those domains that have more than 10 events associated with them.
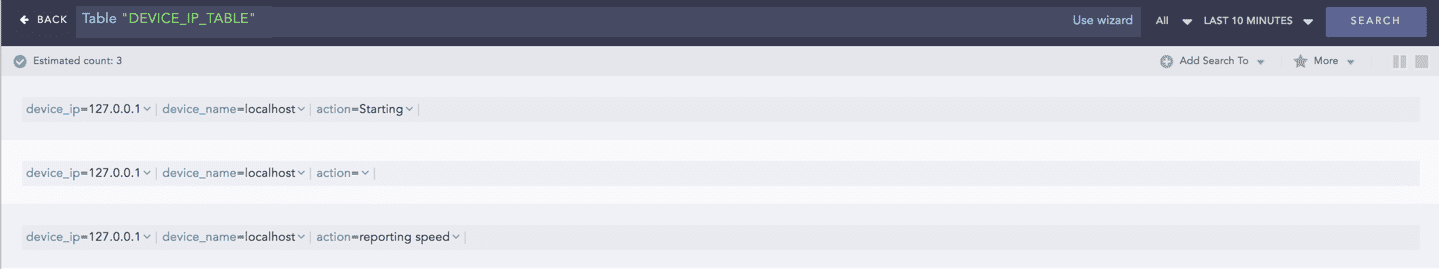
latest
The latest command finds the most recent log messages for every unique combination of provided field values.
This query searches for the latest logs of all the devices.
This query searches for all the latest devices based on the log_ts field whose web server running on the port number 80 is down.
order by
Use order by to sort the search results based on a numeric field in either ascending or descending order. The sorting order of the search results is inconsistent when a search query does not contain an order sorting command. Use the order by command to make it consistent.
For simple searches that do not contain aggregation or correlation queries, the command can sort the search results based on only timestamp fields such as log_ts and col_ts. However, for other searches, all fields are supported.
Examples:
This query searches for all the syslog messages generated from the device named John Doe and sorts them in ascending order of their col_ts values.
This query searches for the logs from all the devices in the system and sorts them in descending order of their log_ts values.
This query filters logs where device_name exists, then counts occurrences grouped by email and log_ts, and sorts the results in ascending order of log_ts.
limit <number>
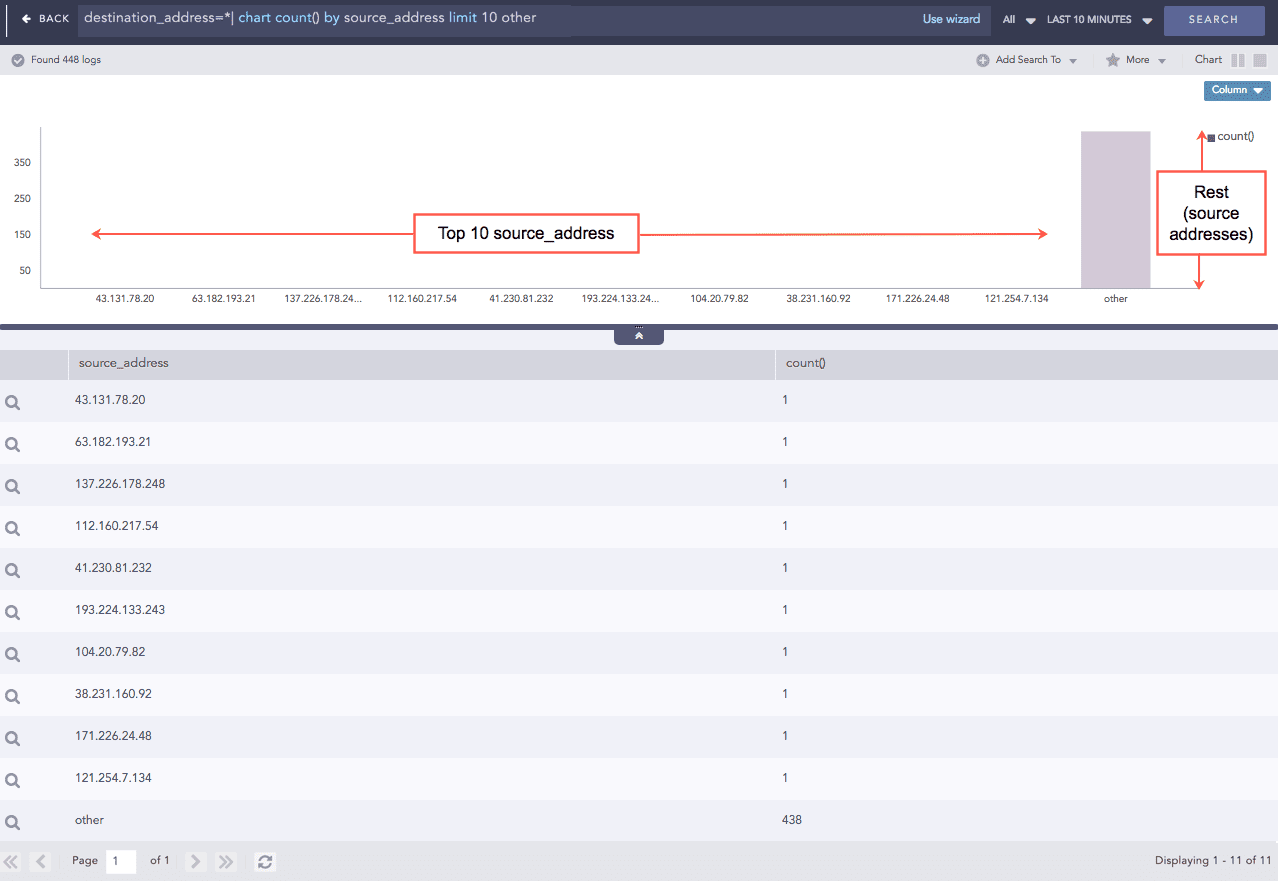
Use the limit <number> command to limit the number of results displayed. Additionally, you can add the other keyword at the end of the query to display the aggregation of the rest of the results. While using the limit <number> command to retrieve a large volume of logs, make sure that your system has enough resources to load and render the data.
The feature to display the Top-10 and the Rest graphs is supported for the aggregation queries.
Example:
This query searches for all the logs having a destination address, filters the top 10 results by their source address and rolls-up all the remaining results in the eleventh line. The source_address field displays the word other in the table as shown in the figure below.
Other examples:
Pattern Finding
Pattern finding is a method of finding one or multiple streams and patterns of data to correlate a particular event. For example: five failed logins, followed by a successful login. It can be performed on the basis of the count and the time of occurrence of the stream. Use the Pattern Finding rules to detect complex event patterns in a large number of logs.
Correlation is the ability to track multiple types of logs and deduce meanings from them. It lets you look for a collection of events that make up a suspicious behavior and investigate further.
Single Stream
A stream consists of a count or occurrence of a query. The query can be a simple search query or an aggregating query. The stream can consist of having the same or a within expression. Stream has a notion of time.
Syntax
Description
[ ]
For single streams, square brackets contain a stream of events.
within
Keyword to denote the notion of time frame
having same
Keyword
Following are the working examples for pattern finding using single stream:
To find 5 login attempts:
To find 5 login attempts within a timeframe of 2 minutes:
To find 5 login attempts by the same user:
To find 10 login attempts by the same user from the same source_address (multiple fields) within 5 minutes:
The time format for specifying timeframe are: second(s), minute(s), hour(s) and day(s).
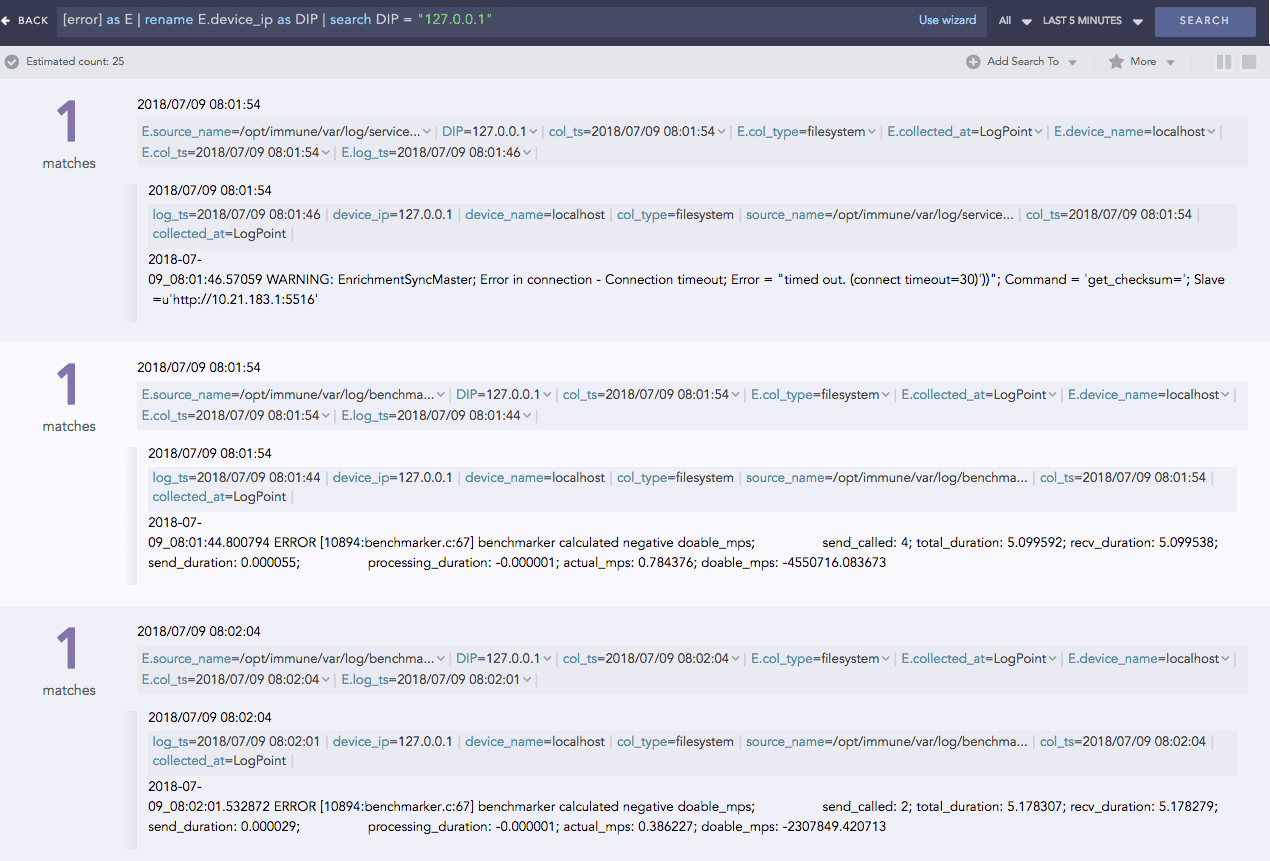
This query finds the logs with errors. It then aliases the result as E and displays the fields prefixed with E such as E.severity, and E.device_ip. You can then use the aliased fields as shown below:
Pattern finding queries for different conditions:
10 login to localhost (source_address) by the same user for the last 15 minutes.
The field of a log file with a norm command.
Multiple Streams
You can join multiple patterns by using Pattern Finding by Joining Streams and Pattern Finding by Following Streams.
Left Join
You can use a left join to return all the values from the table or stream on the left, and only the common values from the table or stream on the right.
Example:
Right Join
You can use a right join to return all the values from the table or stream on the right and only the common values from the table or stream on the left.
Example:
Join
Join queries are used to link the results from different sources. The link between two streams must have an on condition. The link between two lookup sources or any of the lookup and stream does not require a time-range. Join as a part of a search string, can link one data-set to another based on one or more common fields. For instance, two completely different data-sets can be linked together based on a username or event ID field present in both the data-sets.
The syntax for joining multiple patterns is as follows:
[stream 1] <aliased as s1> <JOIN> [stream 2] <aliased as s2> on <Join_conditions> | additional filter query.
To find the events where a reserved port of an Operating System (inside the PORT_MACHINE table) is equal to the blocked port (inside the BLOCKED_PORT table):
To find 5 login attempts by the same user within 1 minute followed by 5 failed login attempts by the same user within 1 minute
To find 5 login attempts by the same user within 1 minute followed by 5 failed attempts by the same user within 1 minute and users from both result are same
Followed by
Pattern Finding by followed by is useful when two sequential streams are connected to an action.
For example:
Here,
Syntax
Description
[ ] AS stream1
A simple pattern finding query aliased as stream1
followed by
Keyword
[ ] AS stream2
A simple search aliased as stream2
ON
Keyword
stream1.user = stream2.user
Matching field from the 2 streams
The syntax for joining multiple patterns is as follows:
[stream 1] <aliased as s1> <followed by> [stream 2] <aliased as s2> <within time limit> on <Join_conditions>| additional filter query.
[stream 1] as s1 followed by [stream2] as s2 within time_interval on s1.field = s2.field
[stream 1] as s1 followed by [stream2] as s2 on s1.field = s2.field
[stream 1] as s1 followed by [stream2] as s2 within time_interval
The inference derived from the above queries:
Streams can be labeled using alias. Here, the first stream is labeled as s1. This labeling is useful while setting the join conditions in the join query.
The operation between multiple streams is carried out using “followed by” or “join”.
Use the followed by keyword to connect two sequential streams anticipating an action, e.g., multiple login attempts followed by successful login.
Use the join keyword to view additional information in the final search. The join syntax is mostly used with tables for enriching the data.
Time limit for occurrence can also be specified.
If you use the join keyword, then specify the on condition.
Join conditions are simple mathematical operations between the data-sets of two streams.
Use additional filter query to mitigate false positives which are generally created while joining a stream and a table. Searching the query with a distinct key from the table displays an error-less result.
This query does not display histogram but displays the log table.
This query displays both the histogram and the log table.
The Latest command is supported in pattern finding queries.
All the reserved keywords such as on, join, as, and chart are not case-sensitive.
If you want to use reserved keywords in simple search or some other contexts, put them in quotes.
Chaining of commands
Chain multiple commands into a single query by using the pipe (|) character. Any command except fields can appear before or after any other command. The fields command must always appear at the end of the command chain.
Example:
This query returns the number of logs with the same device_name that appear more than 1000 times.
This query captures all the log messages labeled as logoff and those collected between 8 AM and 4 PM. It then displays the timechart of the recent users for the selected time frame.
Was this helpful?