Dashboards
Dashboards and visualizations help you monitor, explore, and investigate logs by presenting search results in visual formats. They allow you to combine multiple visual elements into a single view, making it easier to identify trends, patterns, and anomalies across your environment.
Dashboards and visualizations also support drilldown functionality that lets you move from a visual representation of data to detailed search results. This allows you to investigate events directly from charts and widgets without creating new searches manually.
Dashboards
Dashboards provide a consolidated view of multiple visualizations. Each dashboard consists of widgets that display search results in various chart formats.
Logpoint Dashboards allow you to:
View and work with dashboards in All Dashboards
Use dashboard tools to manage layout and widgets
Share dashboards with other users
Import and export dashboards
Use drilldown to investigate data directly from dashboard widgets
Access Overview dashboards for quick visibility into specific datasets. They are designed for monitoring and analysis without requiring configuration.
Dashboard Types
My Dashboards: User-created dashboards that can be customized to track specific security metrics, trends, and investigation data.
Used Dashboards: Dashboards that users have accessed and interacted.
Shared Dashboards: Dashboards that are accessible to multiple users.
Vendor Dashboards: The Pre-built dashboards provided by Logpoint.
Creating a Dashboard
Go to Dashboard from the navigation bar and click All Dashboards.
Click +.
Enter the Dashboard Name.
Click Ok.
Exporting Dashboards
Go to Settings >> Knowledge Base from the navigation bar and click Dashboards.
Select the dashboards to export and click EXPORT.
Save the .pak file as a backup to use it in another Logpoint.
Importing Dashboards
The imported dashboards are automatically shared with the users in the Logpoint Administrator user group.
Go to Settings >> Knowledge Base from the navigation bar and click Dashboards.
Click IMPORT.
Browse and upload the .pak file.
Click Submit.
Widgets
Widgets display search query results in a visual format, enabling real-time monitoring of logs. Each widget is based on a search query and represents a single view of that data. Widgets are added to dashboards, where multiple widgets are combined to provide an overview of activity across your environment.
For example, to monitor firewall activity, you can create a widget based on firewall-related search queries and add it to a dashboard for continuous visibility.
Adding a Widget
Go to Dashboard from the navigation bar and click All Dashboards.
Select a Dashboard and click Add Widget.
Enter a Name for the widget.
Enter a Query. Alternatively, click Select to select a query from the Advanced Query Picker.
Select the Repos to access logs stored in them.
When configuring repos for a new dashboard, only select the relevant ones. Using a large number of repos impacts Logpoint performance.
Select the log Limit.
Select Expose widget to public URL? to share the widget with other users. If you select Expose widget to public URL?, click Open public URL to open the search results in a new window.
Enter a Description for the widget.
Select a Time Range for the logs in the repos in minutes, hours, or days. The maximum limit of the time range for the day is 30.
Click Finish.
If Data Privacy Module is enabled, Can Request Access users can only view encrypted data.
Widget Options
Widgets on a dashboard can be updated at any time to adjust how your search results are visualized or to refine the underlying query driving them.
Click the Widget Options icon in the top-right corner of the widget to perform the following actions:
Search – Re-run or tweak the search query directly from the widget.
Info – View metadata for the widget, including its name, description, and source query.
Edit – Modify the widget’s configuration, including the query, repositories, time range, and visualization settings.
Remove – Delete the widget from the dashboard.
Open Public URL – Open the widget’s data in a public URL if the widget has been shared.
Toggle Legend – Show or hide the legend for charts that include one.
Create Alerts or Incidents – From this widget’s results, you can create alerts or incidents
Customizable Drilldown from Dashboard Widgets
Customizable drill-down options are available in dashboard widgets. You can get more information from your search queries. Using drill down in your dashboard widgets lets you look at specific details of query results.
For example, when viewing results that include the destination_address, destination_port, source_address, and source_port in the query you can drill down in each individual parameter.
Here are two scenario examples.
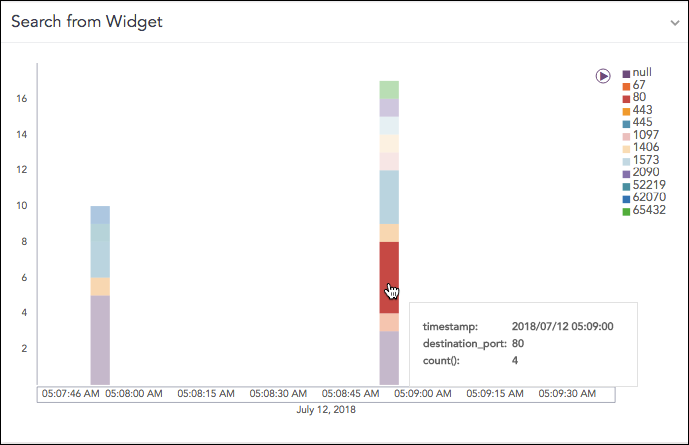
Non-Empty Search from Widget
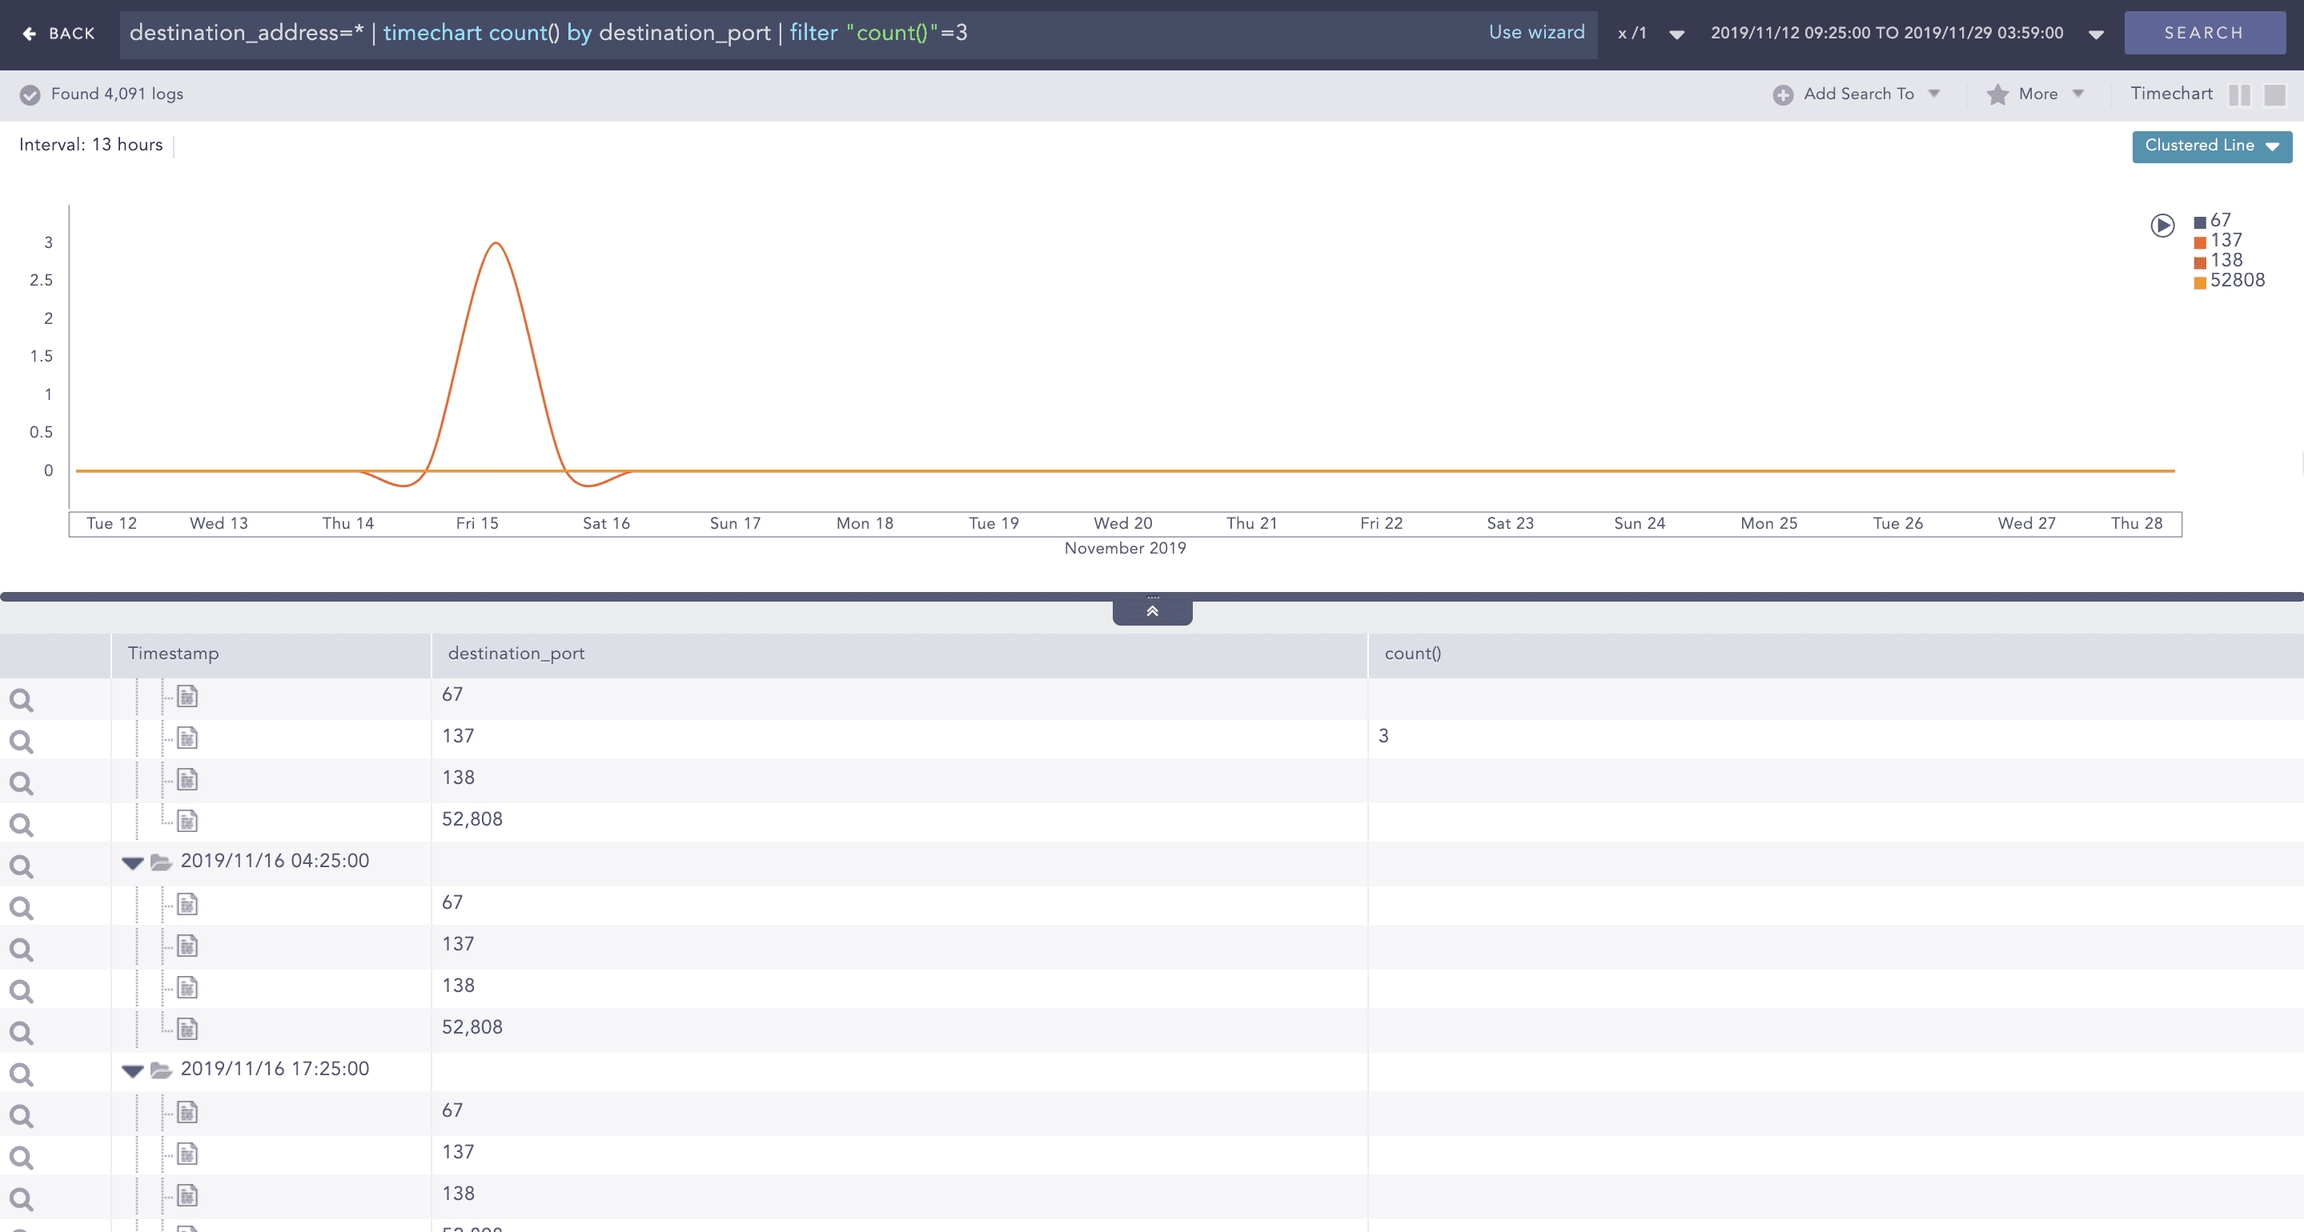
A widget with the following search query:
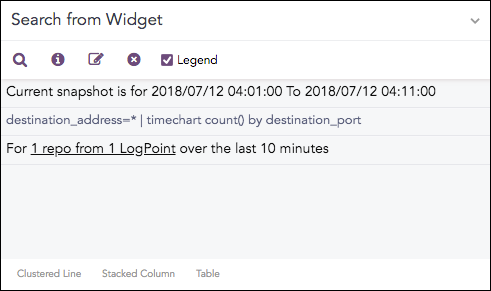
The query results are displayed as a graph.
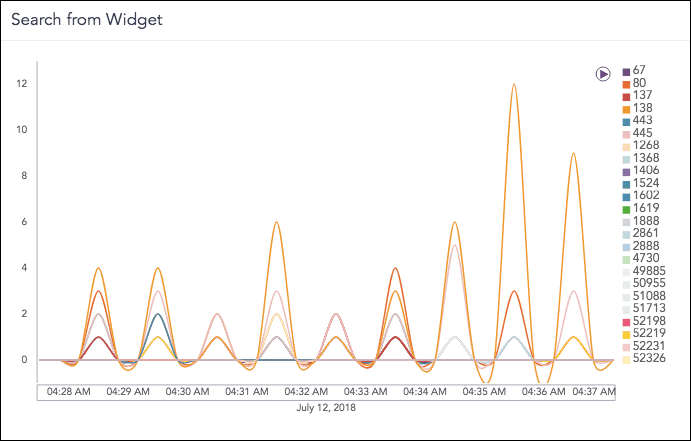
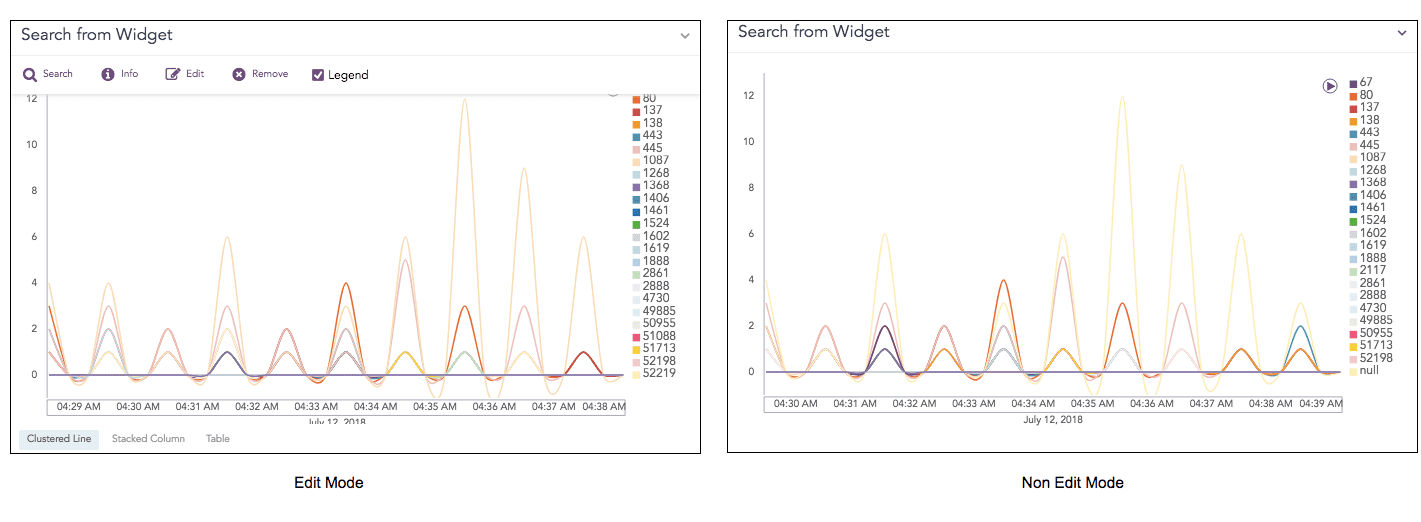
Toggle between edit and non-edit mode. In edit mode, you can select the graph type, for example, Clustered Line Chart, Stacked Column Chart, and Tables. In non-edit mode, you can drill down.
Select destination_port: 80 and count(): 3 to drill down.
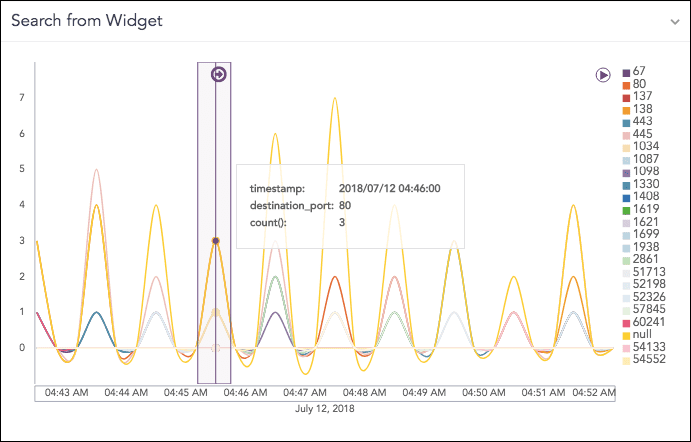
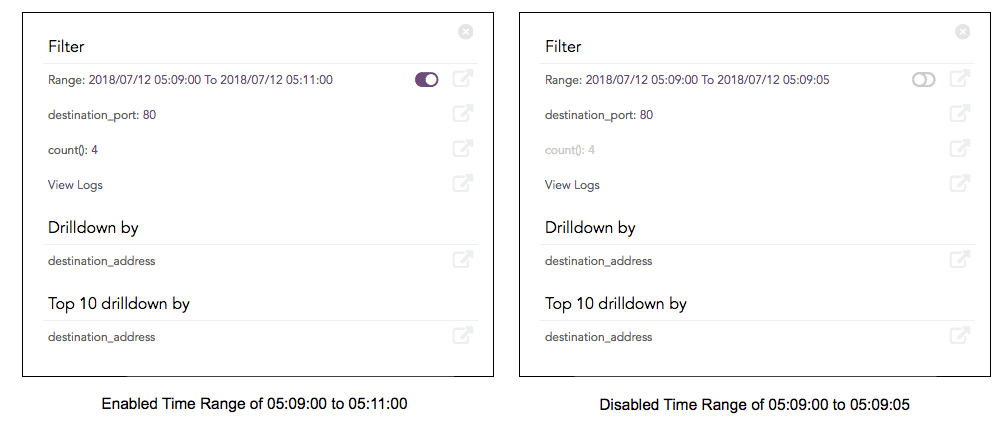
When you click on the highlighted result, you get the option to drill down one of the following specific parameters:
Filter
Drill down by
Top 10 drill-down by
The Filter drilldown searches on Range, destination_port and count(). The Drilldown by and Top 10 drill-down searches for the destination_address.
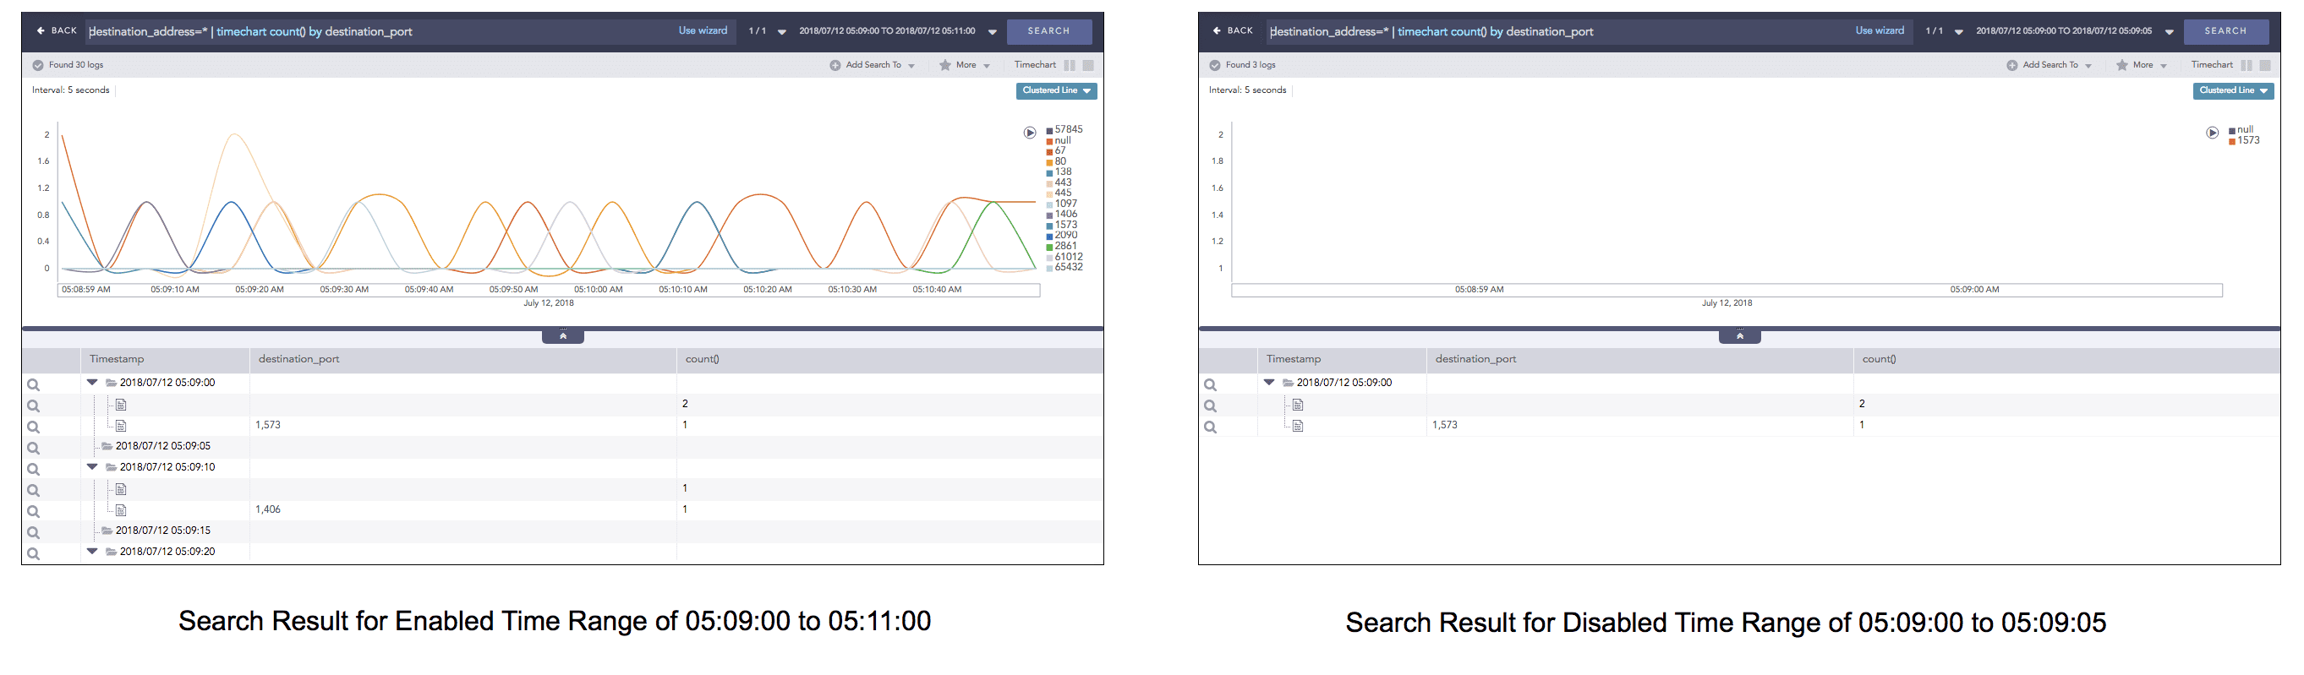
The results of all three drilldown types can be opened and viewed in the same window or a new window. Enable Range.
When drilling down on the Range value, the results open on the same page.
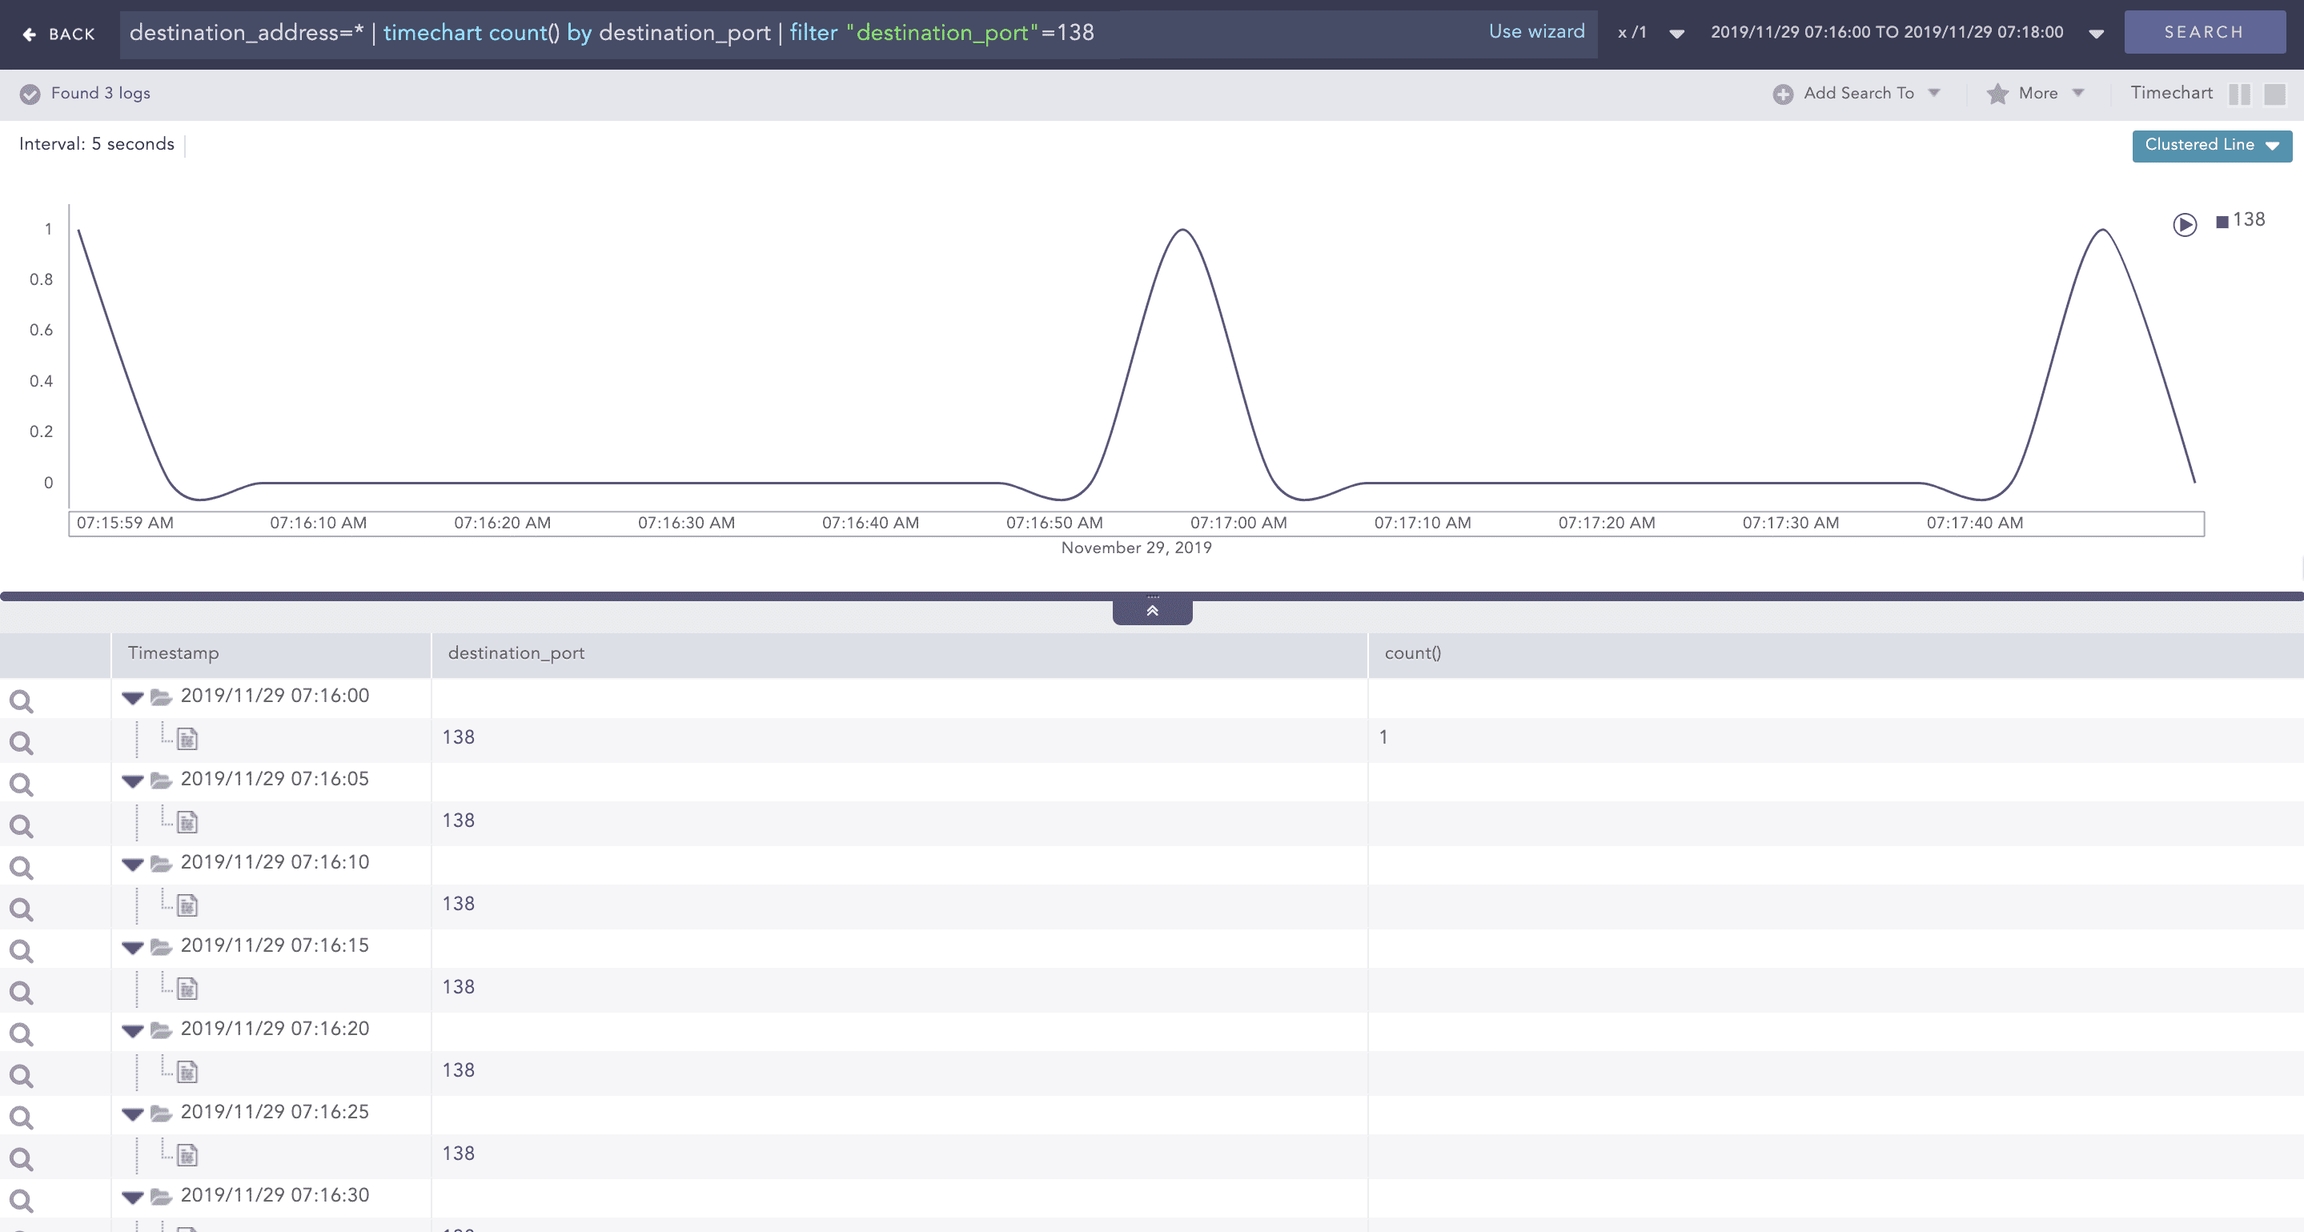
When drilling down on destination_port=138, the results for the destination port open on the same page.
When drilling down to count()=3, the search results open on the same page.
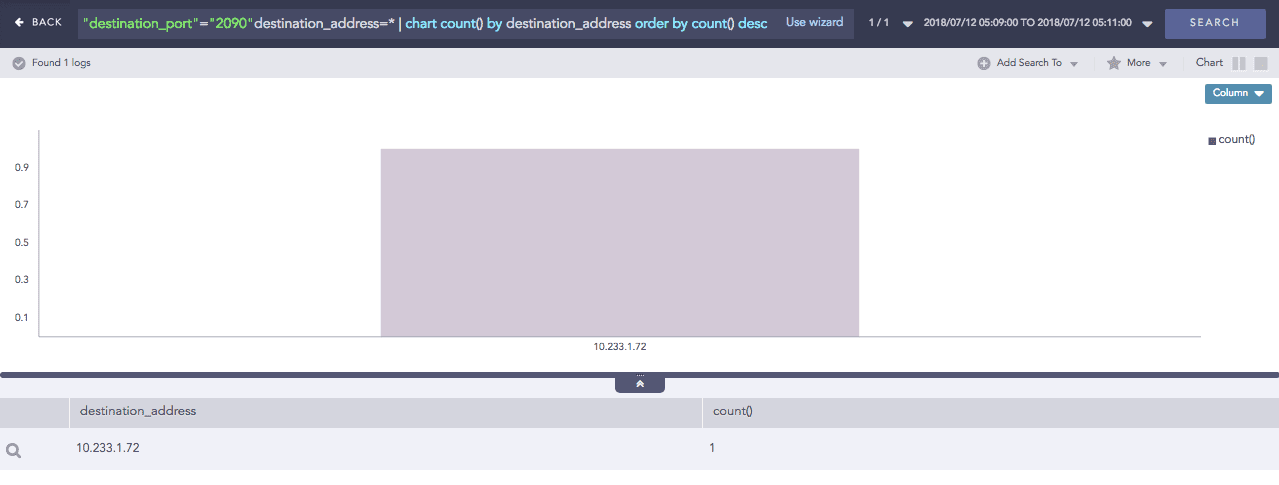
When drilling down on destination_address, the results open on the same page.
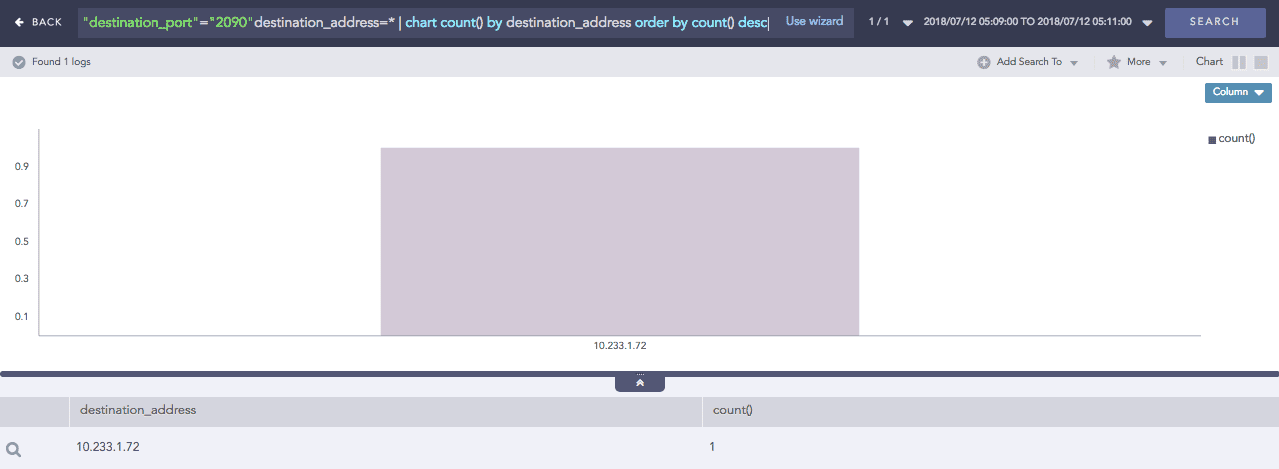
When drilling down on the destination_address, the results open on the same page.
Empty Search from Widget
This widget has no search query.
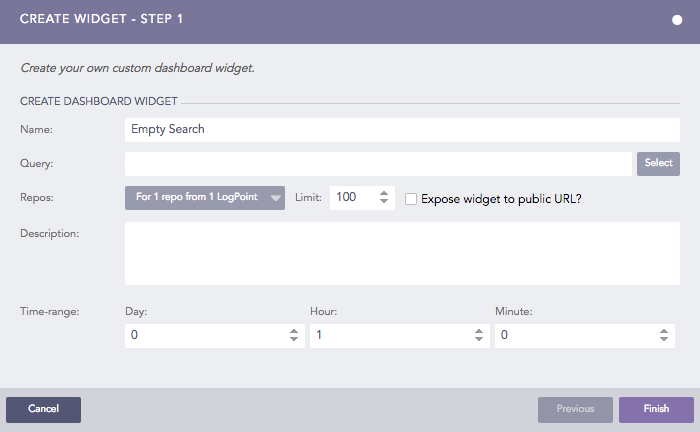
The results of a blank query are only the logs collected for the specified time range; no graphs. You can refine the search query by clicking on specific parts of the search results, for example, a key-value pair or a raw log. This starts a search based on the selected parameter.
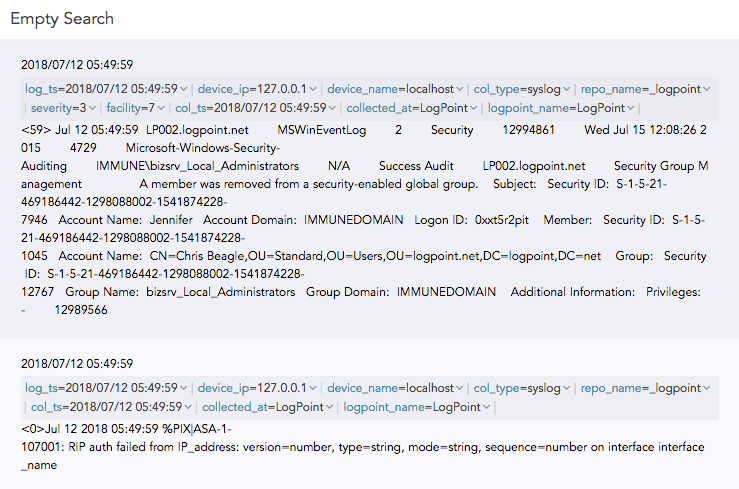
For example, clicking syslog will open the search result of the query “col_type”=”syslog”.
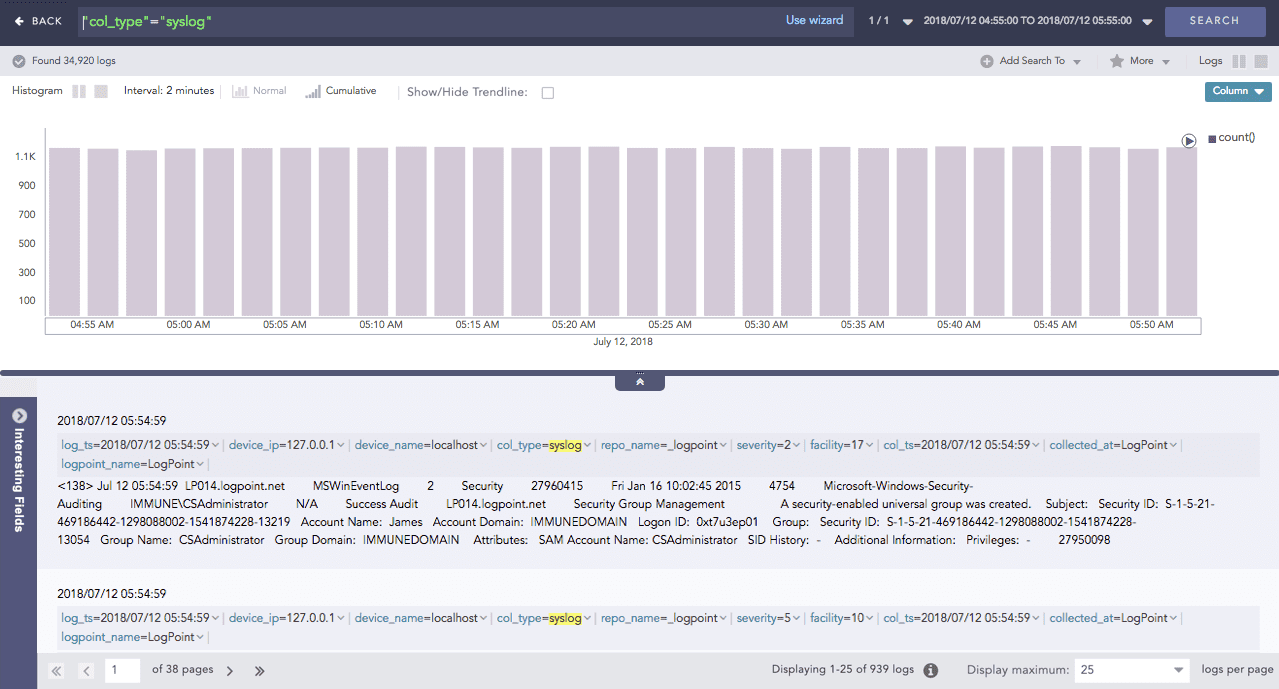
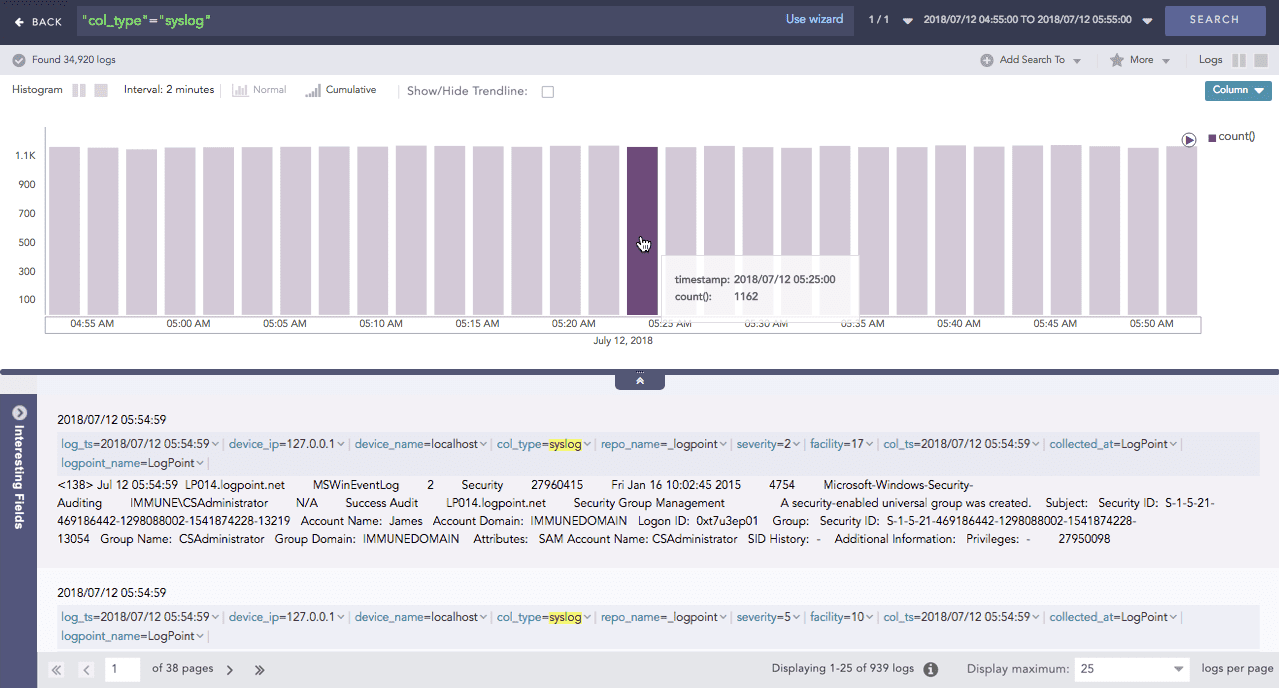
Now you can drill down. When you hover over a specific part of the search results, drill down to get more details.
Sharing a Dashboard
Sharing dashboards helps teams collaborate, hand over shifts, and ensure that everyone has access to the same monitoring and investigation views. You can share dashboards with other users and grant them appropriate permissions so they can view or modify the shared content as required.
When a dashboard is shared, changes to the search definitions, data filters, or widget configurations are reflected for all users with access. Layout changes like resizing or rearranging widgets affect only your personal view and do not change how the dashboard appears for others.
UEBA and vendor dashboards cannot be shared.
Dashboards shared with you appear in My Dashboards, where you can continue investigations, make edits, or share them with additional users from the Dashboard page or the Knowledge Base, based on your permissions.
Sharing a Dashboard from the Dashboard Page
Go to Dashboard from the navigation bar and select a dashboard to share.
Click Share.
Select a User Group. All the users in that user group are listed in the drop-down.
Select the Read, Edit, or Full permission for the users. Selecting the Full permission allows the user to read, edit, remove, and share the dashboard.
Click Submit.
Sharing a Dashboard from the Knowledge Base
Go to Settings >> Knowledge Base from the navigation bar and click Dashboard.
Select My Dashboard from the drop-down.
Click the Share icon in Actions.
Select a User Group. All the users in that user group are listed in the drop-down.
Select the Read, Edit, or Full permission for the users.
Click Submit.
Using a Shared Dashboard
When you open a shared dashboard, the data shown depends on your access to the underlying repositories. If you do not have access to a repository used in the dashboard, only data from repositories you do have access to will appear. If the dashboard uses only a repository you cannot access, it will be empty.
If a user with edit or full permission changes a widget’s graph or query, those changes are visible to everyone the dashboard is shared with. Users with only read permission who change a graph will see those changes only in their own view.
To use a shared dashboard:
From the navigation bar
Go to Settings >> Knowledge Base from the navigation bar and click Dashboard.
Select Shared Dashboard from the drop-down.
Click the Use icon in Actions.
From the Knowledge Base
Go to Dashboard from the navigation bar and click Dashboard.
Click Shared Dashboard.
Select the dashboard to use, then click OK.
Choose Repos and click Ok.
Deleting a Shared Dashboard’s Owner
Go to Settings >> User Accounts from the navigation bar and click Users.
De-activate the user by clicking the De-Activate User icon in the Actions column.
Click Manage De-Activated Users.
Click the Delete icon in the Actions column of the user.
Click Yes.
To transfer ownership, select a user from the drop-down and click Submit. The transferred dashboard is listed in My Dashboards of the new owner.
To delete the user and the user’s dashboard without transferring ownership, click Delete.
Overview Dashboards
Overview dashboards are predefined dashboards that provide quick visibility into specific data sets. They are designed for monitoring and analysis without requiring configuration. Unlike dashboards in All Dashboards, Overview dashboards cannot be customized or shared.
There are multiple overview dashboards tailored to different roles, such as SOC managers, SOC analysts, and SIEM engineers. Each dashboard aggregates widgets from various sources, consolidates their data, and presents it in a consistent format to support monitoring and decision-making.
Logpoint admin permission is required to view the Overview Dashboard.
To access the Overview dashboard, go to Dashboard, then select Overview next to All Dashboards.
System Health Dashboard
The System Health dashboard provides administrators with a high-level view of Logpoint system performance and capacity. It monitors key system components, including disk usage, memory usage, CPU utilization, and message throughput.
Use this dashboard to:
Identify unusual system behavior
Assess whether the system is running efficiently
Detect early signs of capacity issues or performance degradation
Take corrective action before system health impacts operations
The dashboard’s widgets are:
Widget Name
Description
Disk Usage
The total number of gigabytes Logpoint is using to run programs and carry out tasks daily in the specified period. Disk usage relates to hard disk performance.
Memory Usage
The trend of memory (RAM) capacity Logpoint uses while running processes or tasks in the specified period. This helps admin users understand system capacity and make sure there is enough memory.
CPU Usage
The total percentage of processing power in use so an admin user can check system performance, health and speed.
Messages Per Second
Logpoint’s scalability and capacity to handle a large volume of messages within a second. It can help admin users identify peak message rates and assess capacity.
SOC Operation Dashboard
The SOC Operation dashboard provides an overview of real-time security operations and incident handling. It presents key metrics for incidents, cases, and response activities derived from daily data collected over a specified period.
Use this dashboard to:
Monitor incident and case trends
Assess SOC effectiveness
Evaluate detection, investigation, and response workflows
Identify areas that may require operational improvement
The dashboard’s widgets are:
Widget Name
Description
Incidents By Status
Unresolved and resolved incident trend’s accumulated data collected each day over a specified period so SOC managers can use to find the number of changed incident states.
Incidents By Severity
The total number of accumulated incidents with severity (critical, high and medium) not closed daily in a specified period so a SOC manager can view risk trends associated with incidents and adjust the incident threshold.
Cases By Severity
The total number of accumulated cases with severity (critical, high and medium) not closed daily in a specified period so SOC managers can see how case severity has changed and help them prioritize case work.
Cases By Status
The accumulated data on open and in progress cases trends for each day in a specified period. SOC managers can view the proportion of cases whose status changed and evaluate the current risk level.
Automated Response vs Manual Response
The accumulated data of cases closed by playbooks (automated response) and cases closed by SOC analysts (manual response) monthly in the specified period to assess the case resolution reliability of the playbook so SOC managers can track the efficiency of automation.
Was this helpful?